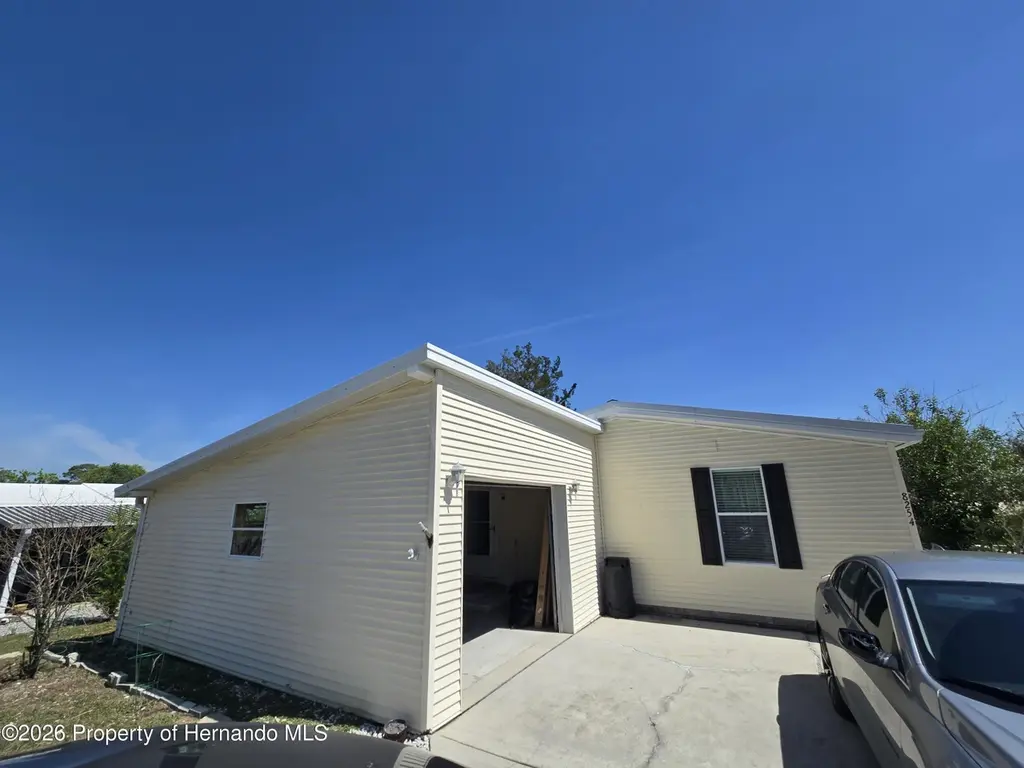
8254 Weatherford Ave · Brookridge, FL
Flood risk 1/10 · Minimal
- FEMA flood zone
- X (unshaded)
- Chance of flooding over 30 yrs
- 0.0%
- Est. flood insurance / yr
- $507 – $1,088
Fire risk 4/10 · Minor
- Est. fire insurance / yr
- $947 – $1,759
Heat risk 10/10 · Severe
- Hot days now (above 109°F)
- 7 days/yr
- Hot days in 30 yrs
- 26 days/yr
Wind risk 9/10 · Severe
- Chance of severe wind over 30 yrs
- 99.0%
Air-quality risk 2/10 · Minimal
- Unhealthy air days now
- 2 days/yr
- Unhealthy air days in 30 yrs
- 2 days/yr
Risk factors via First Street. Map © Google.
Why this score? — see what drove the D- grade
The composite is a weighted blend of 9 inputs, each scored 0–100. Each bar is that input's sub-score; the figure is the points it added to the 100-point composite (weight × sub-score).
- Cash flow +13.8/30.0
- DSCR +4.2/10.0
- Schools +4.2/10.0
- 1% rule +3.8/10.0
- Livability +3.5/5.0
- ARV discount +3.2/15.0
- Rent growth +2.5/5.0
- Condition / age +2.5/5.0
- Appreciation +0.0/10.0
$199,907
🖨 Deal sheet (PDF) 📄 Offer letter ✓ Due diligence
Listing remarks
MOTIVATED SELLERS! 3 Bedroom 2 Bathroom 1 CAR GARAGE HOME and DOUBLE DRIVEWAY! Located in the very popular 55+ Brookridge Community! You will own your own land and only pay 55.00 a month for your HOA. This home sits in an amazing location that is within walking distance of the very active community center and Golf Club. You'll find yourself swimming in the pool, playing pickleball & Golf. NEWER Metal Roof 2-2019. Newer AC & Water Heater~ This 3/2+1 Car Garage home was built in 2003 and has an enclosed Florida room. The Kitchen has a modern white cabinets, granite counter tops and stainless appliances as well as amble cabinets and a pantry. Bathroom vanities have been updated in
Key facts
- Stainless appliances
- Granite counter tops
- Vaulted ceilings
Tags
Property features AI
Finance
- Other: Zoned R1-MH (Residential Single Family Housing)
- HOA & community: Homeowners association with monthly fee of $55; Association fee covers grounds maintenance and security; Community is gated and has street lights; Community amenities include clubhouse, fitness center, golf course, racquetball, tennis courts, shuffleboard, pool, RV/boat storage, storage, and security; Senior community
Exterior
- Parking: Attached garage; Garage door opener; Additional parking; 1-car garage
- Security: Smoke detectors
- Utilities: Public water; Public sewer; Electricity connected; Water connected; Sewer connected; Cable connected
- Home design: Manufactured home (double wide); Single-story; Faces west; Residential property
- Construction: Vinyl siding; Metal roof; One level
- Exterior features: Chain link fence; Private maintained road; Asphalt road frontage; Private road; Lot with Other features
Interior
- Kitchen: Electric cooktop; Electric oven; Electric range; Microwave; Dishwasher; Refrigerator; Breakfast bar; Pantry; Eat-in kitchen
- Bedrooms: Walk-in closet(s) included
- Flooring: Laminate flooring; Tile flooring
- Bathrooms: 2 full bathrooms
- Heating & cooling: Central heating; Central air conditioning; Ceiling fans
- Interior features: Breakfast bar; Ceiling fans; Eat-in kitchen; Open floorplan; Pantry; Vaulted ceilings; Walk-in closets; Double vanity
- Laundry & utility: Washer and dryer included; In-unit laundry; Washer hookup; Electric dryer hookup
Neighborhood map
What this means for you Summary
Snapshot
- This is a 3-bed/2.0-bath manufactured listed at $200k.
Deal economics
- At list price, monthly cash flow is $19 ($225/yr) — positive.
- The deal already cash-flows at list — no discount required.
- To meet the 1% rule (rent ≥ 1% of price), the offer needs to be $177k (11.6% below list).
- Recommended offer: $177k (11.6% below list) — sets the bar for 1% rule.
Location & tenants
- Location reads 70/100 on livability (#421 in FL) — a middle-class / working-renter tenant base. Strengths: cost of living A+, housing A+, crime B+; Watch: employment C-, health & safety C-, amenities F.
- Hernando (suburban): math 50% / reading 50% proficiency, ranked #38 of 73 in FL (top 52%) — acceptable for families but not a draw, mixed tenant base, ~2y average lease.
- Zoned schools: Pine Grove Elementary School (math 60% / reading 45%, grade C-, #976 of 2,144 statewide, top 46%, 991 students, 60% FRL); West Hernando Middle School (math 36% / reading 37%, grade F, #405 of 571 statewide, top 72%, 695 students, 58% FRL); Central High School (math 34% / reading 44%, grade F, #312 of 667 statewide, top 48%, 1,426 students, 53% FRL) — zoned schools at 57% FRL track the district average.
- Market conditions: 695 active listings in the ZIP; 13 comparable units currently listed for rent nearby; rentals at typical pace (median 20d on market — plan ~3-4 weeks tenant-placement turnaround); 2,505 units permitted in Hernando County in 2024 (318 in 5+ unit buildings).
- This rent runs 36% of the median local income ($59k/yr) — at the standard rent-burdened threshold; future hikes will face affordability resistance.
Forward outlook
- Local home prices are declining (-3.0%/yr); year-one equity from $1k of loan paydown is wiped out by about $6k of value loss. Plan a longer hold.
- Hernando County population projected at +11% by 2050 — modest demand growth; plan on rents tracking national, not racing it.
Negotiation context
- It's been on market 66 days — a 6% lower offer ($188k) is reasonable based on typical stale-listing flexibility.
- 12 sale attempts since 13y ago; this cycle's ask has dropped $30k (13%) from the opening price — seller is motivated, your offer sets the floor, not the list.
Risks & watch-outs
- Climate carrying-cost: severe wind risk, 99% chance of damaging wind over 30y; extreme-heat days projected 7→26/yr by 2055 (HVAC capex compounding) — expect insurance premiums to compound above CPI over the hold.
Questions for the listing agent
- It's been on market 66 days. Have you received any prior offers? Is the seller open to a 12% concession, seller financing, or rate buy-down credit?
- What does the HOA fee cover, when was the last increase, and are there any pending special assessments or reserve-fund shortfalls?
- Why hasn't it sold? Are there any deal-killer items the seller is aware of (foundation, flood, title, zoning, code violations)?
- Is there a deadline driving the sale (1031 exchange, divorce, estate, relocation)? That informs how much negotiation room exists.
- Schools are F-rated, which usually means shorter tenancies and higher turnover. Who's the typical renter profile here, and what's been the actual vacancy rate?
- The area grade is low — what's the realistic commute time and amenity access for the typical tenant pool here? Any planned neighborhood developments (good or bad) we should know about?
- What's the average days-on-market for RENTAL listings here right now (not sales)? A rising rental-DOM trend means longer vacancies and softer asking-rent achievability than the comps imply.
- What's the recent tenant-quality profile in this submarket — average credit score on applications, eviction rate, late-payment / NSF rate, and stable-employment percentage? A property-management company in the area should have these aggregated.
- How much new for-sale + rental construction is in the pipeline within 1–3 miles? Heavy new supply typically softens prices + rents 12–24 months out; constrained supply supports both.
Investment metrics
- 1% rule
- 0.88% ✗
- Cap rate
- 6.41%
- Cash-on-cash
- 0.40%
- DSCR
- 1.02
- GRM
- 9.4
CMA / ARV
- ARV (on-the-fly)
- $182,520
- Comps found
- 12
Show comp detail 12 sales within ~0.75 mi
| Address | Dist | Beds/Ba | Sqft | Sold | Price | $/sf | Match |
|---|---|---|---|---|---|---|---|
| 8305 Weatherford Ave | 0.10mi | 2/2.0 (-1) | 1,314 (-6%) | 1mo | $193,000 | $147 | 79 |
| 8271 Modena Ave | 0.20mi | 2/2.0 (-1) | 1,265 (-10%) | 0mo | $107,000 | $85 | 69 |
| 14232 Rialto Ave | 0.40mi | 2/2.0 (-1) | 1,448 (+3%) | 3mo | $164,000 | $113 | 69 |
| 8399 Fleetway Ave | 0.50mi | 2/2.0 (-1) | 1,431 (+2%) | 3mo | $215,000 | $150 | 66 |
| 14279 Midmoor Blvd | 0.33mi | 2/2.0 (-1) | 1,512 (+8%) | 3mo | $250,000 | $165 | 64 |
| 7408 Morelli Ave | 0.56mi | 3/2.0 | 1,485 (+6%) | 3mo | $192,500 | $130 | 62 |
| 14563 Brookridge Blvd | 0.63mi | 3/2.0 | 1,344 (-4%) | 2mo | $224,000 | $167 | 62 |
| 7472 Moriah Ave | 0.45mi | 2/2.0 (-1) | 1,288 (-8%) | 1mo | $158,000 | $123 | 60 |
| 14221 Midmoor Blvd | 0.37mi | 2/2.0 (-1) | 1,550 (+10%) | 1mo | $198,000 | $128 | 60 |
| 14383 Dehaven Ave | 0.63mi | 3/2.0 | 1,493 (+6%) | 1mo | $189,000 | $127 | 59 |
| 14761 Rialto Ave | 0.63mi | 2/2.0 (-1) | 1,512 (+8%) | 2mo | $181,000 | $120 | 51 |
| 7464 Dinsmore St | 0.45mi | 2/2.0 (-1) | 1,200 (-14%) | 2mo | $175,000 | $146 | 49 |
Match score weights: distance 35% · size 25% · config 20% · recency 20%. Top-matched comps best support the ARV.
Projected returns pro-forma
-3.0% appreciation · 3.0% rent growth · sell at horizon
- IRR
- -15.6%
- Equity multiple
- 0.44×
- Total profit
- $-31,174
- Equity at exit
- $29,807
- IRR
- -7.2%
- Equity multiple
- 0.54×
- Total profit
- $-25,508
- Equity at exit
- $17,284
Cash invested: $55,974 (down + closing). Projections, not guarantees.
Landlord ↔ Tenant lean methodology
- Overall (STATE)
- 87 Strongly Landlord-Friendly
- State Florida
- 87 Strongly Landlord-Friendly · R+3
- County
- — inherits STATE
- City
- — inherits STATE
ZIP-level market 34613
- Home prices YoY
- -17.2%
- Active inventory
- 695
- Price-to-rent
- 9.4×
Monthly cashflow live
- Estimated rent
- $1,768 high interval (Pro) →
- Mortgage (P&I)
- −$1,048
- Tax from tax record
- −$191 /mo · $2,294/yr
- Insurance
- −$83
- HOA
- −$55
- Vacancy / Maint / Mgmt
- −$371
- Net cashflow
- $19
Break-even live
Sensitivity live
| Price | -10% $132 | -5% $75 | +0% $19 | +5% $-38 | +10% $-94 |
|---|---|---|---|---|---|
| Rent | -10% $-121 | -5% $-51 | +0% $19 | +5% $89 | +10% $158 |
| Rate | -1.0pp $119 | -0.5pp $70 | base $19 | +0.5pp $-33 | +1.0pp $-86 |
UW: 25.0% down · 7.5% · 30yr · 1.5% tax · 5.0% vac · 8.0% maint · 8.0% mgmt
Financing live
Cash to close
- Down payment
- $49,977
- Closing costs
- $5,997
- Reserves months
- —
- Total cash needed
- —
Loan-product check · same deal, 3 products live
Conventional
25% down · 7.5% · 30yr
- Down + closing
- —
- Monthly P&I
- —
- Monthly cashflow
- —
- DSCR
- —
- Eligible?
- —
Personal DTI + credit; lowest rate.
DSCR
20% down · 8.5% · 30yr
- Down + closing
- —
- Monthly P&I
- —
- Monthly cashflow
- —
- DSCR
- —
- Eligible?
- —
No personal income docs; deal must DSCR.
Hard money
10% down · 12.0% · 12mo
- Down + closing
- —
- Monthly P&I
- —
- Monthly cashflow
- —
- DSCR
- —
- Eligible?
- —
Short-term bridge; refi at stabilization.
Rent comps 13 comps
| Address | Beds | Baths | Sqft | Rent | $/sqft | DOM | Units | Dist |
|---|---|---|---|---|---|---|---|---|
| 8407 Weatherford Ave Brooksville, FL | 2.0 | 2.0 | 1104 | $1,500 | $1.36 | 19d | 1 | 0.23mi |
| 14342 Starcross St Brooksville, FL | 2.0 | 1.0 | 900 | $1,025 | $1.14 | 23d | 1 | 0.31mi |
| 9356 Southern Charm Cir Brooksville, FL | 3.0 | 2.0 | 1621 | $1,800 | $1.11 | 26d | 1 | 0.44mi |
| 14697 Brookridge Blvd Brooksville, FL | 2.0 | 2.0 | 1056 | $1,350 | $1.28 | 26d | 1 | 0.55mi |
| 14131 Lemon Yellow Tree Ln Brooksville, FL | 3.0 | 2.0 | 1840 | $1,979 | $1.08 | 6d | 1 | 0.57mi |
| 8917 Southern Charm Cir Brooksville, FL | 3.0 | 2.0 | 1437 | $1,695 | $1.18 | 5d | 1 | 0.67mi |
| 8871 Southern Charm Cir Brooksville, FL | 3.0 | 2.0 | 1482 | $2,050 | $1.38 | 26d | 1 | 0.71mi |
| 9919 Scepter Ave Brooksville, FL | 3.0 | 2.0 | 1188 | $1,250 | $1.05 | 6d | 1 | 0.75mi |
| 8761 Fetterbush Ct Brooksville, FL | 3.0 | 2.0 | 1730 | $1,850 | $1.07 | 26d | 1 | 0.84mi |
| 7124 Barclay Ave Unit A Spring Hill, FL | 2.0 | 2.0 | 927 | $1,500 | $1.62 | 26d | 1 | 0.95mi |
| 9289 Scepter Ave Brooksville, FL | 3.0 | 2.0 | 1512 | $1,400 | $0.93 | 6d | 1 | 1.20mi |
| 14360 Barley Grass Rd Spring Hill, FL | 3.0–5.0 | 2.0–3.0 | 1975 | $2,195 | $1.11 | 3d | 19 | 1.20mi |
| 14373 Irving St Unit B Brooksville, FL | 2.0 | 1.0 | 900 | $1,750 | $1.94 | 1d | 1 | 1.48mi |
HOA detail
- Monthly dues
- $55 · $660/yr
- Likely covers
- waterpool
Listing history 45 events
-
2026-06-21days on market $199,907 Active 66 DOM
-
2026-06-18days on market $199,907 Active 63 DOM
-
2026-06-17days on market $199,907 Active 62 DOM
-
2026-06-16days on market $199,907 Active 61 DOM
-
2026-06-15days on market $199,907 Active 60 DOM
-
2026-06-13days on market $199,907 Active 58 DOM
-
2026-06-13days on market $199,907 Active 57 DOM
-
2026-06-09days on market $199,907 Active 54 DOM
-
2026-06-08days on market $199,907 Active 53 DOM
-
2026-06-07pricedays on market $199,907 Active 52 DOM
-
2026-06-04pricedays on market $209,907 Active 49 DOM
-
2026-06-03days on market $219,907 Active 48 DOM
-
2026-06-02days on market $219,907 Active 47 DOM
-
2026-06-01days on market $219,907 Active 46 DOM
-
2026-05-31days on market $219,907 Active 45 DOM
-
2026-04-16$229,900 Active
-
2025-06-11historical
-
2025-06-11historical
-
2025-05-19price $240,000
-
2025-05-19price $240,000
-
2025-03-26$250,000 Active
-
2025-03-21$250,000 Active
-
2024-05-29historical
-
2024-05-29historical
-
2024-05-16status Active
-
2024-05-16status Active
-
2024-05-10status Pending
-
2024-05-10historical Active Under Contract - Accepting Back Up Offers
-
2024-04-23price $240,000
-
2024-04-23price $240,000
-
2024-03-22$250,000 Active
-
2024-03-22$250,000 Active
-
2022-01-03soldstatus $190,000
-
2021-12-30soldstatus $190,000 Closed
-
2021-12-30soldstatus $190,000
-
2021-10-31status Pending
-
2021-10-29$190,000 Active
-
2021-10-29$190,000
-
2019-06-03soldstatus $95,000
-
2015-09-25soldstatus $65,000
-
2015-09-25soldstatus $65,000
-
2015-06-29$67,000
-
2015-06-29$67,000
-
2014-02-11historical
-
2013-06-22$52,000
ⓘ Source: listings_history table (triggers on properties + properties_extension) + one-shot
backfill from property_details.listing_events for pre-trigger history.
Tax reassessment forecast FL · Resets to sale price
- Current annual tax
- $2,294 · $191/mo
- Projected year-2 tax
- $2,294 · $191/mo
- Expected delta
- $0/yr ($0/mo · 0.0%)
ⓘ Screening estimate from a state-policy table — verify with the county assessor before closing.
Climate risk First Street
- Flood 1/10 Low FEMA zone X (unshaded) · 0% chance over 30 yrs
- Wildfire 4/10 Moderate
- Heat 10/10 Extreme 7 d/yr ≥109°F today · 26 d/yr by 30 yrs out
- Wind 9/10 Extreme 99% chance of damaging wind over 30 yrs
- Air quality 2/10 Low 2 unhealthy d/yr today · 2 by 30 yrs out
Nearby sold comps map
Loading sold comps map…
Walkable amenities ~0.75 mi
Loading nearby amenities…
Taxation est. · year 1
- Rental income
- $21,213
- − Mortgage interest
- −$11,198
- − Property taxes
- −$2,294
- − Insurance
- −$1,000
- − Repairs & maintenance
- −$1,697
- − Management
- −$1,697
- − HOA
- −$660
- − Depreciation
- −$5,815
- Taxable loss
- −$3,148
- Est. tax savings @ 24.0%
- +$755
- After-tax cash flow
- $981/yr
For passive investors: Depreciation is non-cash, so a rental often shows a tax loss while cash-flowing — sheltering income. Rental losses are passive: they offset passive income freely, and up to $25,000/yr can offset ordinary (W-2) income if you actively participate and your MAGI is under $100k (phasing out to $0 by $150k); unused losses carry forward. On sale, claimed depreciation is recaptured at up to 25%, and gains may owe capital-gains tax (a 1031 exchange can defer both). Figures are a year-1 estimate at your 24.0% rate — not tax advice; consult a CPA.
Schools (NCES district)
- District
- Hernando
- NCES district ID
- 1200810
- Math proficiency
- 50% ▼ -8.00%
- Reading proficiency
- 50% ▼ -4.00%
- Median HH income
- $41,985
- Composite
- 42.03/100
- National rank
- #3329
- State rank
- #38 of 73 in FL
Livability — Brookridge
- Score
- 70/100
- State rank
- #421
- US rank
- #7529
Category grades
Schools grade is shown separately in the Schools card above.
Census & demographics
- Census place
- Brookridge, FL
- County
- Hernando County · 169,677 people
- Metro
- Tampa-St. Petersburg-Clearwater, FL
- Population (ZIP)
- 19,337
- Household income
- $58,596
- Rent vs Own
- Severe rent burden
- 307.0
Population outlook (Hernando County) Hauer SSP2
- Today (2025)
- 189,218 people
- By 2030
- 194,367 · +2.7%
- By 2040
- 203,398 · +7.5%
- By 2050
- 209,589 · +10.8%
- By 2075
- 218,452 · +15.4%
- By 2100
- 205,923 · +8.8%
Race, ethnicity, and origin ACS 2023
- Neighborhood character
- Predominantly White (88%)
- Race & ethnicity
- White 88% Hispanic / Latino 6% Two or more races 4% Black 2% Asian 1%
- Hispanic origin (detail)
- Mexican 1% Puerto Rican 2% Cuban 1%
- Common ancestry
- Romanian 4% Lithuanian 3% Slovak 2%
- Foreign-born
- 8% · Canada, Vietnam
- Languages at home
- 92% English-only · Spanish 3% French/Haitian/Cajun 1% Russian/Polish/Slavic 1%
Political lean MEDSL · Hernando
- 2024 margin
- Solid R (+37.0) · D 31.1% · R 68.2%
- 2008→2024 swing
- -33.5pp toward R · 2008: -3.6pp · 2024: -37.0pp
- All cycles
- 2024: R+37.0 2020: R+30.2 2016: R+29.0 2012: R+8.5 2008: R+3.6
Not yet ingested
- Civics
- —
Market trends
- HPI YoY
- ▼ -57.51%
- Current HPI
- 276.2229
- Rent YoY
- —
- Metro
- Tampa-St. Petersburg-Clearwater, FL
- State GDP YoY
- ▲ 3.28%
- F500 in state
- 36
Industry mix (Fortune 500 HQ in FL)
| Industry | F500 HQs | Revenue |
|---|---|---|
| Industrial Technology | 2 | $29B |
|
||
| Insurance | 2 | $17B |
|
||
| Retail | 1 | $60B |
|
||
| Technology Distribution | 1 | $58B |
|
||
| Homebuilding | 1 | $35B |
|
||
| Technology Manufacturing | 1 | $35B |
|
||
Price history
+342.1% since first listed30 events — show timeline
- 2026-04-16 Listed $229,900 HCAR
- 2025-06-11 Listing Removed — HCAR
- 2025-06-11 Listing Removed — Stellar MLS as Distributed by MLS Grid
- 2025-05-19 Price Changed $240,000 HCAR
- 2025-05-19 Price Changed $240,000 Stellar MLS as Distributed by MLS Grid
- 2025-03-26 Listed $250,000 HCAR
- 2025-03-21 Listed $250,000 Stellar MLS as Distributed by MLS Grid
- 2024-05-29 Listing Removed — Stellar MLS as Distributed by MLS Grid
- 2024-05-29 Listing Removed — HCAR
- 2024-05-16 Relisted — Stellar MLS as Distributed by MLS Grid
- 2024-05-16 Relisted — HCAR
- 2024-05-10 Pending — Stellar MLS as Distributed by MLS Grid
- 2024-05-10 Contingent — HCAR
- 2024-04-23 Price Changed $240,000 HCAR
- 2024-04-23 Price Changed $240,000 Stellar MLS as Distributed by MLS Grid
- 2024-03-22 Listed $250,000 Stellar MLS as Distributed by MLS Grid
- 2024-03-22 Listed $250,000 HCAR
- 2022-01-03 Sold (Public Records) $190,000 Public Records
- 2021-12-30 Sold (MLS) $190,000 St. Augustine and St. Johns County Board of REALTORS®
- 2021-12-30 Sold (MLS) $190,000 HCAR
- 2021-10-31 Pending — HCAR
- 2021-10-29 Listed $190,000 St. Augustine and St. Johns County Board of REALTORS®
- 2021-10-29 Listed $190,000 HCAR
- 2019-06-03 Sold (Public Records) $95,000 Public Records
- 2015-09-25 Sold (MLS) $65,000 St. Augustine and St. Johns County Board of REALTORS®
- 2015-09-25 Sold (MLS) $65,000 HCAR
- 2015-06-29 Listed $67,000 St. Augustine and St. Johns County Board of REALTORS®
- 2015-06-29 Listed $67,000 HCAR
- 2014-02-11 Listing Removed — HCAR
- 2013-06-22 Listed $52,000 HCAR
Property tax history
+6.3%/yrLatest (2025): $2,294 · +0.8% YoY. Source: county tax records.
Cash-flow waterfall
monthlySold comps — $/sqft
last 12 mo · ≤1 miLoading sold comps…