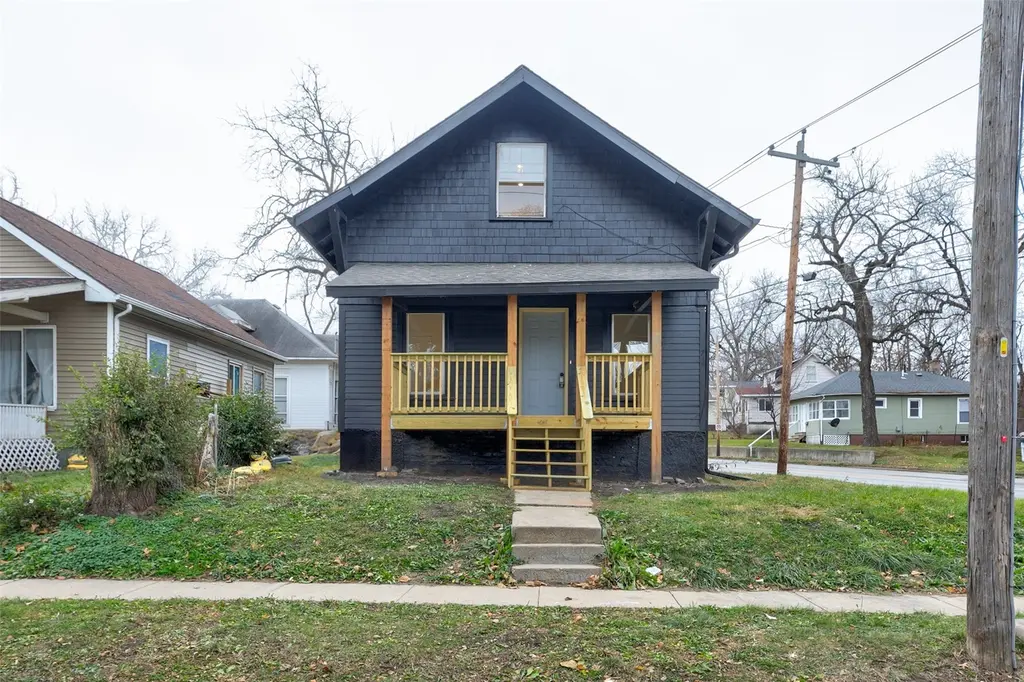
1946 Franklin Ave · Des Moines, IA
Flood risk 1/10 · Minimal
- FEMA flood zone
- X (unshaded)
- Chance of flooding over 30 yrs
- 0.0%
- Est. flood insurance / yr
- $473 – $860
Fire risk 1/10 · Minimal
- Est. fire insurance / yr
- $902 – $1,676
Heat risk 3/10 · Minor
- Hot days now (above 103°F)
- 7 days/yr
- Hot days in 30 yrs
- 15 days/yr
Wind risk 2/10 · Minimal
- Chance of severe wind over 30 yrs
- —
Air-quality risk 2/10 · Minimal
- Unhealthy air days now
- 1 days/yr
- Unhealthy air days in 30 yrs
- 2 days/yr
Risk factors via First Street. Map © Google.
Why this score? — see what drove the D+ grade
The composite is a weighted blend of 9 inputs, each scored 0–100. Each bar is that input's sub-score; the figure is the points it added to the 100-point composite (weight × sub-score).
- Cash flow +10.4/30.0
- Appreciation +10.0/10.0
- ARV discount +5.8/15.0
- Rent growth +4.5/5.0
- Livability +4.0/5.0
- Schools +3.8/10.0
- DSCR +3.0/10.0
- Condition / age +2.5/5.0
- 1% rule +2.3/10.0
$152,500
🖨 Deal sheet (PDF) 📄 Offer letter ✓ Due diligence
Listing remarks MLS
Welcome to 1946 Franklin Ave, a home that’s been thoughtfully refreshed from top to bottom. Inside, you’ll find new flooring, new appliances, completely updated bathrooms and kitchen, accompanied by fresh paint, updated trim, and clean bright spaces throughout. The main level offers an open living area with new LVP flooring and natural light. The kitchen features brand-new appliances, fresh cabinetry, butcher-block counters, and plenty of room to cook and gather between the kitchen and dining area. A main-floor bedroom and new ¾ bath make daily living easy. Upstairs, two additional bedrooms sit next to a second renovated ¾ bath, each with new fixtures, vanities, showers, and flooring. The exterior has received its own attention: a modern paint refresh and a newly built front porch that gives the home instant curb appeal. A solid, cleanly updated home at this price point in Des Moines is tough to find—this one delivers value without the renovation headache.
Key facts
- Fresh cabinetry
- New flooring
- New appliances
Tags
Neighborhood map
What this means for you Summary
Snapshot
- This is a 3-bed/1.0-bath single-family listed at $152k.
Deal economics
- At list price, monthly cash flow is $-81 ($-976/yr) — negative.
- To cash-flow at today's rent, offer at most $138k (9.4% below list).
- To meet the 1% rule (rent ≥ 1% of price), the offer needs to be $111k (27.1% below list).
- Recommended offer: $111k (27.1% below list) — sets the bar for 1% rule.
- Cap rate 5.7% vs local median 3.1% in Des Moines — top-decile yield for the area; either an underpriced asset or a hidden risk that comps aren't pricing in. Stress-test before assuming the spread holds.
Location & tenants
- Location reads 81/100 on livability (#63 in IA, #1,432 nationally) — a professional / high-income tenant draw. Strengths: commute A+, cost of living A+, housing A+; Watch: employment C-, crime F.
- Des Moines Independent Community School District (urban): math 43% / reading 46% proficiency, ranked #289 of 289 in IA (top 100%) — families likely to look elsewhere, expect single-tenant / working-renter base with shorter leases; 63% free/reduced lunch — lower-income household profile, screen leases tightly.
- Zoned schools: Monroe Elementary School (math 30% / reading 27%, grade F, #606 of 616 statewide, top 98%, 423 students, 95% FRL); Meredith Middle School (math 40% / reading 40%, grade F, #239 of 246 statewide, top 97%, 664 students, 84% FRL); Hoover High School (math 46% / reading 55%, grade D+, #311 of 336 statewide, top 93%, 991 students, 78% FRL) — zoned schools average 86% FRL vs 63% district-wide (23 pts higher); higher-poverty schools than district average — tighter screening recommended.
- Market conditions: Rents rising fast (+8.2%/yr); 64 active listings in the ZIP; 40 comparable units currently listed for rent nearby; rentals at typical pace (median 25d on market — plan ~3-4 weeks tenant-placement turnaround); 40% of comp listings sitting > 30 days — soft ceiling on asking rent; lower-income renter base — watch delinquency; 2,953 units permitted in Polk County in 2024 (540 in 5+ unit buildings).
Forward outlook
- In year one you build about $16k of equity ($1k loan paydown + $15k appreciation (10.0% local appreciation)).
- Polk County population projected at +37% by 2050 — long-run rental-demand tailwind backs the buy-and-hold thesis.
- At projected returns (10.0% appreciation + 8.0% rent growth), your $43k cash investment doubles in ~3 years — after that, you're playing with house money.
- By year 3, paydown + projected appreciation supports a ~$41k cash-out refi (75% LTV) — recoverable capital for the next deal without selling this one.
Negotiation context
- It's been on market 208 days — a 12% lower offer ($134k) is reasonable based on typical stale-listing flexibility.
- 3 sale attempts since 21y ago; this cycle's ask has dropped $12k (8%) from the opening price — seller is motivated, your offer sets the floor, not the list.
- Current owner paid $83k; list at $152k implies a 84% gain — meaningful room to come down on a strong offer.
Risks & watch-outs
- Watch-outs: built in 1910 — expect roof / HVAC / electrical / plumbing capex.
Questions for the listing agent
- What do current leases actually rent for vs. the listed asking? Can we see a recent rent roll and the last 12 months of T-12 income?
- It's been on market 208 days. Have you received any prior offers? Is the seller open to a 27% concession, seller financing, or rate buy-down credit?
- Built in 1910 — when were the roof, HVAC, electrical panel, plumbing, and water heater last replaced?
- Why hasn't it sold? Are there any deal-killer items the seller is aware of (foundation, flood, title, zoning, code violations)?
- Is there a deadline driving the sale (1031 exchange, divorce, estate, relocation)? That informs how much negotiation room exists.
- Schools are D-rated, which usually means shorter tenancies and higher turnover. Who's the typical renter profile here, and what's been the actual vacancy rate?
- Crime grade is F in this area — have there been break-ins, vandalism, or insurance claims at this property in the last 3 years? What carrier currently insures it and at what premium?
- The area grade is low — what's the realistic commute time and amenity access for the typical tenant pool here? Any planned neighborhood developments (good or bad) we should know about?
- What's the average days-on-market for RENTAL listings here right now (not sales)? A rising rental-DOM trend means longer vacancies and softer asking-rent achievability than the comps imply.
- What's the recent tenant-quality profile in this submarket — average credit score on applications, eviction rate, late-payment / NSF rate, and stable-employment percentage? A property-management company in the area should have these aggregated.
- How much new for-sale + rental construction is in the pipeline within 1–3 miles? Heavy new supply typically softens prices + rents 12–24 months out; constrained supply supports both.
Investment metrics
- 1% rule
- 0.73% ✗
- Cap rate
- 5.65%
- Cash-on-cash
- -2.29%
- DSCR
- 0.90
- GRM
- 11.4
CMA / ARV
- ARV (median comp)
- $147,098
- List price
- $152,500
- Delta
- 3.67%
- Verdict
- FAIR
- Comps
- 20 within 1.0 mi
Show comp detail 12 sales within ~0.75 mi
| Address | Dist | Beds/Ba | Sqft | Sold | Price | $/sf | Match |
|---|---|---|---|---|---|---|---|
| 1527 Martin Luther King Jr Pkwy | 0.29mi | 2/1.0 (-1) | 1,086 (-2%) | 2mo | $60,000 | $55 | 77 |
| 1821 Washington Ave | 0.17mi | 3/2.0 | 977 (-11%) | 1mo | $165,500 | $169 | 68 |
| 1559 23rd St | 0.30mi | 3/1.0 | 1,223 (+11%) | 1mo | $167,500 | $137 | 67 |
| 2200 Clark St | 0.40mi | 2/1.0 (-1) | 1,030 (-6%) | 0mo | $176,900 | $172 | 65 |
| 1503 13th St | 0.66mi | 3/1.0 | 1,070 (-3%) | 1mo | $87,000 | $81 | 64 |
| 1820 23rd St | 0.19mi | 2/2.0 (-1) | 992 (-10%) | 3mo | $190,000 | $192 | 63 |
| 2101 30th St | 0.71mi | 3/1.0 | 1,082 (-2%) | 2mo | $234,400 | $217 | 62 |
| 1412 Chautauqua Pkwy | 0.39mi | 2/2.0 (-1) | 1,038 (-6%) | 2mo | $255,000 | $246 | 61 |
| 1821 12th St | 0.62mi | 3/3.0 | 1,097 (-0%) | 2mo | $199,000 | $181 | 61 |
| 1543 29th St | 0.69mi | 2/1.0 (-1) | 1,148 (+4%) | 3mo | $166,350 | $145 | 54 |
| 1327 23rd St | 0.61mi | 2/2.0 (-1) | 1,042 (-5%) | 2mo | $140,000 | $134 | 52 |
| 1534 12th St | 0.66mi | 3/1.5 | 1,220 (+11%) | 1mo | $201,000 | $165 | 49 |
Match score weights: distance 35% · size 25% · config 20% · recency 20%. Top-matched comps best support the ARV.
Projected returns pro-forma
10.0% appreciation · 8.0% rent growth · sell at horizon
- IRR
- 24.1%
- Equity multiple
- 2.96×
- Total profit
- $83,709
- Equity at exit
- $137,384
- IRR
- 22.5%
- Equity multiple
- 7.21×
- Total profit
- $265,064
- Equity at exit
- $296,274
Cash invested: $42,700 (down + closing). Projections, not guarantees.
Landlord ↔ Tenant lean methodology
- Overall (STATE)
- 83 Strongly Landlord-Friendly
- State Iowa
- 83 Strongly Landlord-Friendly · R+6
- County
- — inherits STATE
- City
- — inherits STATE
ZIP-level market 50314
- Home prices YoY
- 9.8%
- Rents YoY
- 8.2%
- Active inventory
- 64
- Price-to-rent
- 11.4×
Monthly cashflow live
- Estimated rent
- $1,112 high interval (Pro) →
- Mortgage (P&I)
- −$800
- Tax from tax record
- −$97 /mo · $1,160/yr
- Insurance
- −$64
- HOA
- −$0
- Vacancy / Maint / Mgmt
- −$234
- Net cashflow
- $-81
Break-even live
Sensitivity live
| Price | -10% $5 | -5% $-38 | +0% $-81 | +5% $-125 | +10% $-168 |
|---|---|---|---|---|---|
| Rent | -10% $-169 | -5% $-125 | +0% $-81 | +5% $-37 | +10% $6 |
| Rate | -1.0pp $-5 | -0.5pp $-43 | base $-81 | +0.5pp $-121 | +1.0pp $-161 |
UW: 25.0% down · 7.5% · 30yr · 1.5% tax · 5.0% vac · 8.0% maint · 8.0% mgmt
Financing live
Cash to close
- Down payment
- $38,125
- Closing costs
- $4,575
- Reserves months
- —
- Total cash needed
- —
Loan-product check · same deal, 3 products live
Conventional
25% down · 7.5% · 30yr
- Down + closing
- —
- Monthly P&I
- —
- Monthly cashflow
- —
- DSCR
- —
- Eligible?
- —
Personal DTI + credit; lowest rate.
DSCR
20% down · 8.5% · 30yr
- Down + closing
- —
- Monthly P&I
- —
- Monthly cashflow
- —
- DSCR
- —
- Eligible?
- —
No personal income docs; deal must DSCR.
Hard money
10% down · 12.0% · 12mo
- Down + closing
- —
- Monthly P&I
- —
- Monthly cashflow
- —
- DSCR
- —
- Eligible?
- —
Short-term bridge; refi at stabilization.
Rent comps 40 comps
| Address | Beds | Baths | Sqft | Rent | $/sqft | DOM | Units | Dist |
|---|---|---|---|---|---|---|---|---|
| 1718 22nd St Des Moines, IA | 2.0 | 1.0 | 840 | $995 | $1.18 | 16d | 1 | 0.13mi |
| 1714 College Ave Des Moines, IA | 3.0 | 1.0 | 1015 | $1,050 | $1.03 | 45d | 1 | 0.32mi |
| 2501 24th St Unit 121 Des Moines, IA | 3.0 | 2.0 | 950 | $995 | $1.05 | 25d | 1 | 0.43mi |
| 2501 24th St Apt 106 Des Moines, IA | 4.0 | 2.0 | 1175 | $1,245 | $1.06 | 45d | 1 | 0.44mi |
| 2501 24th St Unit 113 Des Moines, IA | 2.0 | 1.0 | 750 | $945 | $1.26 | 45d | 1 | 0.44mi |
| 2501 24th St Apt 107 Des Moines, IA | 3.0 | 2.0 | 950 | $1,045 | $1.10 | 16d | 1 | 0.44mi |
| 2501 24th St Unit 111 Des Moines, IA | 2.0 | 1.0 | 750 | $760 | $1.01 | 25d | 1 | 0.44mi |
| 2501 24th St Unit 101 Des Moines, IA | 2.0 | 1.0 | 750 | $725 | $0.97 | 25d | 1 | 0.44mi |
| 2501 24th St Des Moines, IA | 2.0 | 1.0 | 910 | $795 | $0.87 | 25d | 1 | 0.44mi |
| 2717 Meek Ave Des Moines, IA | 2.0 | 2.0 | 1128 | $1,550 | $1.37 | 16d | 1 | 0.54mi |
| 1312 22nd St Des Moines, IA | 2.0 | 1.0 | 841 | $825 | $0.98 | 45d | 1 | 0.61mi |
| 1312 22nd St Unit 2 Des Moines, IA | 2.0 | 1.0 | 841 | $850 | $1.01 | 45d | 1 | 0.61mi |
| 1312 22nd St Unit 2 Des Moines, IA | 2.0 | 1.0 | 841 | $825 | $0.98 | 25d | 1 | 0.61mi |
| 1314 Harrison Ave Des Moines, IA | 3.0 | 1.0 | 1150 | $1,195 | $1.04 | 25d | 1 | 0.67mi |
| 1217 24th St Des Moines, IA | 2.0 | 1.0–2.0 | 618 | $1,400 | $2.26 | 16d | 4 | 0.72mi |
| 1914 10th St Des Moines, IA | 2.0 | 1.0 | 740 | $1,050 | $1.42 | 45d | 1 | 0.73mi |
| 1914 10th St Des Moines, IA | 2.0 | 1.0 | 740 | $1,050 | $1.42 | 25d | 1 | 0.73mi |
| 1171 21st St Unit 2 Des Moines, IA | 4.0 | 1.0 | 1210 | $1,300 | $1.07 | 45d | 1 | 0.76mi |
| 1171 21st St Unit 1 Des Moines, IA | 2.0 | 1.0 | 1028 | $1,150 | $1.12 | 45d | 1 | 0.76mi |
| 2530 University Ave Des Moines, IA | 2.0 | 1.0 | 647 | $1,750 | $2.70 | 16d | 36 | 0.84mi |
| 1123 24th St Unit 1 Des Moines, IA | 3.0 | 1.0 | 850 | $1,185 | $1.39 | 45d | 1 | 0.87mi |
| 1438 9th St Des Moines, IA | 2.0 | 1.0 | 700 | $745 | $1.06 | 23d | 1 | 0.88mi |
| 1100 24th St Des Moines, IA | 2.0 | 1.0 | 748 | $1,050 | $1.40 | 16d | 1 | 0.90mi |
| 1100 24th St Unit DT 22 Des Moines, IA | 2.0 | 1.0 | 737 | $1,095 | $1.49 | 45d | 1 | 0.90mi |
| 3103 Forest Ave Des Moines, IA | 1.0–2.0 | 1.0–1.5 | 900 | $1,550 | $1.72 | 16d | 1 | 0.91mi |
| 1101 25th St Unit DP 11 Des Moines, IA | 2.0 | 2.0 | 850 | $1,315 | $1.55 | 45d | 1 | 0.92mi |
| 2411 Welbeck Rd #7 Des Moines, IA | 2.0 | 1.0 | 750 | $845 | $1.13 | 45d | 1 | 0.93mi |
| 2411 Welbeck Rd #11 Des Moines, IA | 2.0 | 1.0 | 750 | $745 | $0.99 | 45d | 1 | 0.93mi |
| 3201 Forest Ave Des Moines, IA | 3.0 | 1.0–2.0 | 717 | $1,600 | $2.23 | 16d | 16 | 0.96mi |
| 2002 34th St Des Moines, IA | 2.0 | 1.0 | 897 | $1,350 | $1.51 | 23d | 1 | 0.98mi |
| 2813 Cottage Grove Ave Unit 2 Des Moines, IA | 3.0 | 1.0 | 900 | $1,200 | $1.33 | 45d | 1 | 1.01mi |
| 2901 Boston Ave Des Moines, IA | 1.0–2.0 | 1.0–1.5 | 707 | $1,300 | $1.84 | 16d | 7 | 1.05mi |
| 2940 Brattleboro Ave Unit 2 Des Moines, IA | 3.0 | 2.0 | 1250 | $1,300 | $1.04 | 16d | 1 | 1.09mi |
| 1020 25th St Unit 3 Des Moines, IA | 2.0 | 1.0 | 845 | $1,150 | $1.36 | 21d | 1 | 1.09mi |
| 2403 36th St Des Moines, IA | 3.0 | 2.0 | 1324 | $1,600 | $1.21 | 25d | 1 | 1.11mi |
| 1219 34th St Unit 205 Des Moines, IA | 2.0 | 1.0 | 767 | $1,325 | $1.73 | 25d | 1 | 1.14mi |
| 1717 Olive Ave Unit B6 Des Moines, IA | 2.0 | 2.0 | 1092 | $1,700 | $1.56 | 45d | 1 | 1.15mi |
| 1260 34th St Unit 401 Des Moines, IA | 3.0 | 2.0 | 1088 | $1,335 | $1.23 | 45d | 1 | 1.17mi |
| 3517 University Ave Unit 008 Des Moines, IA | 2.0 | 1.0 | 750 | $799 | $1.07 | 25d | 1 | 1.21mi |
| 3436 University Ave Unit 3438-1 Des Moines, IA | 2.0 | 1.0 | 734 | $792 | $1.08 | 16d | 1 | 1.23mi |
Listing history 29 events
-
2026-06-21days on market $152,500 Active 208 DOM
-
2026-06-18days on market $152,500 Active 205 DOM
-
2026-06-17days on market $152,500 Active 204 DOM
-
2026-06-16days on market $152,500 Active 203 DOM
-
2026-06-15days on market $152,500 Active 202 DOM
-
2026-06-14days on market $152,500 Active 200 DOM
-
2026-06-13days on market $152,500 Active 199 DOM
-
2026-06-10days on market $152,500 Active 197 DOM
-
2026-06-09days on market $152,500 Active 196 DOM
-
2026-06-08days on market $152,500 Active 195 DOM
-
2026-06-07days on market $152,500 Active 194 DOM
-
2026-06-05days on market $152,500 Active 191 DOM
-
2026-06-03days on market $152,500 Active 190 DOM
-
2026-06-02days on market $152,500 Active 189 DOM
-
2026-06-01days on market $152,500 Active 188 DOM
-
2026-05-31days on market $152,500 Active 187 DOM
-
2026-05-31days on market $152,500 Active 186 DOM
-
2026-01-16price $152,500 1002-char remark
Show marketing remark (1002 chars)
Welcome to 1946 Franklin Ave, a home that’s been thoughtfully refreshed from top to bottom. Inside, you’ll find new flooring, new appliances, completely updated bathrooms and kitchen, accompanied by fresh paint, updated trim, and clean bright spaces throughout. The main level offers an open living area with new LVP flooring and natural light. The kitchen features brand-new appliances, fresh cabinetry, butcher-block counters, and plenty of room to cook and gather between the kitchen and dining area. A main-floor bedroom and new ¾ bath make daily living easy. Upstairs, two additional bedrooms sit next to a second renovated ¾ bath, each with new fixtures, vanities, showers, and flooring. The exterior has received its own attention: a modern paint refresh and a newly built front porch that gives the home instant curb appeal. A solid, cleanly updated home at this price point in Des Moines is tough to find—this one delivers value without the renovation headache.
-
2025-12-07price $155,000 1002-char remark
Show marketing remark (1002 chars)
Welcome to 1946 Franklin Ave, a home that’s been thoughtfully refreshed from top to bottom. Inside, you’ll find new flooring, new appliances, completely updated bathrooms and kitchen, accompanied by fresh paint, updated trim, and clean bright spaces throughout. The main level offers an open living area with new LVP flooring and natural light. The kitchen features brand-new appliances, fresh cabinetry, butcher-block counters, and plenty of room to cook and gather between the kitchen and dining area. A main-floor bedroom and new ¾ bath make daily living easy. Upstairs, two additional bedrooms sit next to a second renovated ¾ bath, each with new fixtures, vanities, showers, and flooring. The exterior has received its own attention: a modern paint refresh and a newly built front porch that gives the home instant curb appeal. A solid, cleanly updated home at this price point in Des Moines is tough to find—this one delivers value without the renovation headache.
-
2025-11-25$165,000 Active 1002-char remark
Show marketing remark (1002 chars)
Welcome to 1946 Franklin Ave, a home that’s been thoughtfully refreshed from top to bottom. Inside, you’ll find new flooring, new appliances, completely updated bathrooms and kitchen, accompanied by fresh paint, updated trim, and clean bright spaces throughout. The main level offers an open living area with new LVP flooring and natural light. The kitchen features brand-new appliances, fresh cabinetry, butcher-block counters, and plenty of room to cook and gather between the kitchen and dining area. A main-floor bedroom and new ¾ bath make daily living easy. Upstairs, two additional bedrooms sit next to a second renovated ¾ bath, each with new fixtures, vanities, showers, and flooring. The exterior has received its own attention: a modern paint refresh and a newly built front porch that gives the home instant curb appeal. A solid, cleanly updated home at this price point in Des Moines is tough to find—this one delivers value without the renovation headache.
-
2024-12-02soldstatus $83,000
-
2024-08-29status Pending
-
2024-08-29historical
-
2024-06-27price $89,900
-
2024-05-16price $94,900
-
2024-04-04$99,500 Active
-
2024-03-29soldstatus $63,500
-
2005-10-27soldstatus $39,500
-
2005-05-06$39,900
ⓘ Source: listings_history table (triggers on properties + properties_extension) + one-shot
backfill from property_details.listing_events for pre-trigger history.
Tax reassessment forecast IA · Partial reset (capped growth)
- Current annual tax
- $1,160 · $97/mo
- Projected year-2 tax
- $1,777 · $148/mo
- Expected delta
- +$617/yr (+$51/mo · 53.2%)
ⓘ Screening estimate from a state-policy table — verify with the county assessor before closing.
Climate risk First Street
- Flood 1/10 Low FEMA zone X (unshaded) · 0% chance over 30 yrs
- Wildfire 1/10 Low
- Heat 3/10 Moderate 7 d/yr ≥103°F today · 15 d/yr by 30 yrs out
- Wind 2/10 Low
- Air quality 2/10 Low 1 unhealthy d/yr today · 2 by 30 yrs out
Nearby sold comps map
Loading sold comps map…
Walkable amenities ~0.75 mi
Loading nearby amenities…
Taxation est. · year 1
- Rental income
- $13,345
- − Mortgage interest
- −$8,542
- − Property taxes
- −$1,160
- − Insurance
- −$762
- − Repairs & maintenance
- −$1,068
- − Management
- −$1,068
- − Depreciation
- −$4,436
- Taxable loss
- −$3,691
- Est. tax savings @ 24.0%
- +$886
- After-tax cash flow
- $-91/yr
For passive investors: Depreciation is non-cash, so a rental often shows a tax loss while cash-flowing — sheltering income. Rental losses are passive: they offset passive income freely, and up to $25,000/yr can offset ordinary (W-2) income if you actively participate and your MAGI is under $100k (phasing out to $0 by $150k); unused losses carry forward. On sale, claimed depreciation is recaptured at up to 25%, and gains may owe capital-gains tax (a 1031 exchange can defer both). Figures are a year-1 estimate at your 24.0% rate — not tax advice; consult a CPA.
Schools (NCES district)
- District
- Des Moines Independent Community School District
- NCES district ID
- 1908970
- Math proficiency
- 43% ▼ -6.00%
- Reading proficiency
- 46% ▼ -1.00%
- Median HH income
- $45,905
- Composite
- 37.83/100
- National rank
- #4331
- State rank
- #289 of 289 in IA
Livability — Des Moines
- Score
- 81/100
- State rank
- #63
- US rank
- #1432
Category grades
Schools grade is shown separately in the Schools card above.
Census & demographics
- Census place
- Des Moines, IA
- County
- Polk County · 453,298 people
- City population
- 203,612
- Metro
- Des Moines-West Des Moines, IA
- Population (ZIP)
- 10,438
- Household income
- $39,950
- Rent vs Own
- Severe rent burden
- 903.0
Population outlook (Polk County) Hauer SSP2
- Today (2025)
- 548,042 people
- By 2030
- 588,557 · +7.4%
- By 2040
- 670,629 · +22.4%
- By 2050
- 752,830 · +37.4%
- By 2075
- 955,069 · +74.3%
- By 2100
- 1,115,436 · +103.5%
Race, ethnicity, and origin ACS 2023
- Neighborhood character
- Highly diverse neighborhood (Simpson 0.73)
- Race & ethnicity
- Black 37% White 29% Hispanic / Latino 20% Asian 12% Two or more races 10%
- Hispanic origin (detail)
- Mexican 13%
- Common ancestry
- Ukrainian 6% Iranian 2% Swiss 1%
- Foreign-born
- 26% · Canada, Vietnam, Philippines
- Languages at home
- 60% English-only · Spanish 16% Vietnamese 6% Other Asian/Pacific 4%
Political lean MEDSL · Polk
- 2024 margin
- D (+10.9) · D 54.8% · R 43.9% · Other 1.3%
- 2008→2024 swing
- -3.7pp toward R · 2008: 14.6pp · 2024: 10.9pp
- All cycles
- 2024: D+10.9 2020: D+15.2 2016: D+11.5 2012: D+14.2 2008: D+14.6
Not yet ingested
- Civics
- —
Market trends
- HPI YoY
- ▲ 30.18%
- Current HPI
- 338.8301
- Rent YoY
- ▲ 8.17%
- Metro
- Des Moines-West Des Moines, IA
- State GDP YoY
- ▲ 2.48%
- F500 in state
- 4
Industry mix (Fortune 500 HQ in IA)
| Industry | F500 HQs | Revenue |
|---|---|---|
| Financial Services | 1 | $16B |
|
||
| Retail / Convenience | 1 | $15B |
|
||
Price history
+282.2% since first listed12 events — show timeline
- 2026-01-16 Price Changed $152,500 DMMLS
- 2025-12-07 Price Changed $155,000 DMMLS
- 2025-11-25 Listed $165,000 DMMLS
- 2024-12-02 Sold (Public Records) $83,000 Public Records
- 2024-08-29 Pending — DMMLS
- 2024-08-29 Listing Removed — DMMLS
- 2024-06-27 Price Changed $89,900 DMMLS
- 2024-05-16 Price Changed $94,900 DMMLS
- 2024-04-04 Listed $99,500 DMMLS
- 2024-03-29 Sold (Public Records) $63,500 Public Records
- 2005-10-27 Sold (Public Records) $39,500 Public Records
- 2005-05-06 Listed $39,900 DMMLS
Property tax history
+0.8%/yrLatest (2025): $1,160 · +1.9% YoY. Source: county tax records.
Cash-flow waterfall
monthlySold comps — $/sqft
last 12 mo · ≤1 miLoading sold comps…