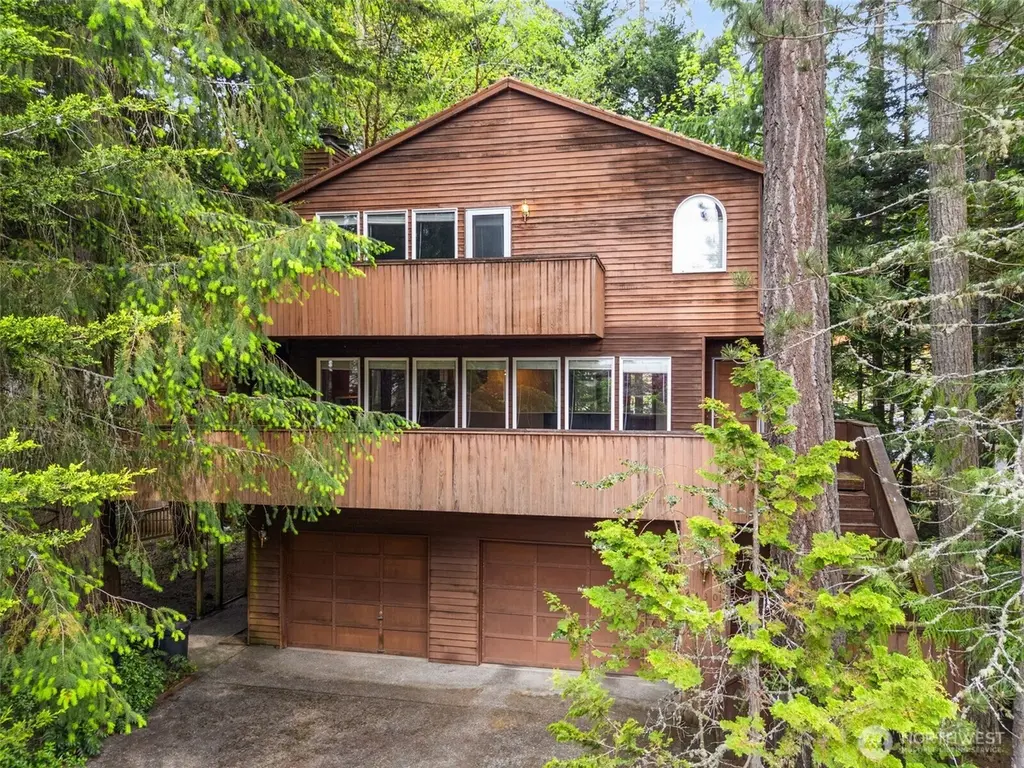
6430 NE Agate Beach Rd · Bainbridge Island, WA
Flood risk 1/10 · Minimal
- FEMA flood zone
- X (unshaded)
- Chance of flooding over 30 yrs
- 0.0%
- Est. flood insurance / yr
- $473 – $860
Fire risk 1/10 · Minimal
- Est. fire insurance / yr
- $604 – $1,122
Heat risk 2/10 · Minimal
- Hot days now (above 86°F)
- 7 days/yr
- Hot days in 30 yrs
- 14 days/yr
Wind risk 1/10 · Minimal
- Chance of severe wind over 30 yrs
- —
Air-quality risk 6/10 · Moderate
- Unhealthy air days now
- 9 days/yr
- Unhealthy air days in 30 yrs
- 9 days/yr
Risk factors via First Street. Map © Google.
Why this score? — see what drove the F grade
The composite is a weighted blend of 9 inputs, each scored 0–100. Each bar is that input's sub-score; the figure is the points it added to the 100-point composite (weight × sub-score).
- Schools +7.7/10.0
- ARV discount +7.5/15.0
- Cash flow +6.0/30.0
- Livability +4.0/5.0
- Rent growth +3.3/5.0
- Condition / age +2.5/5.0
- 1% rule +0.9/10.0
- DSCR +0.4/10.0
- Appreciation +0.0/10.0
$650,000
🖨 Deal sheet 📄 Offer letter ✓ Due diligence
Listing remarks
Located near Agate Beach on Bainbridge Island’s north end, this property offers a compelling opportunity for buyers seeking space, upside, and convenient access on and off the island. Positioned with easy proximity to the Agate Pass Bridge, the location allows for a direct connection to Poulsbo, Silverdale, and the greater Kitsap area while maintaining the quieter residential character that makes this part of the island so appealing. The home itself offers a generous footprint with substantial living space and flexibility for future vision and improvement. Whether approached as a renovation project, investment opportunity, or long-term hold, the scale of the home creates meaningful po
Key facts
- Agate beach access
- Large living areas
- 0.25 acre lot
Tags
Property features AI
Finance
- Other: Living area approximately 2,840 (public record); Lot approximately 0.25 acre; Offers review date: Friday, May 22, 2026
- Financial info: Accepts Cash, Conventional, FHA and VA financing
Exterior
- Parking: Attached garage with 2 covered spaces
- Utilities: Electric energy source; Public/community water; Septic sewer; Power: PSE; Cable: Xfinity; Internet: Xfinity
- Home design: Single family residence; Tri-level style; Main entry level; Residential property
- Construction: Wood construction; Composition roof; Poured concrete foundation; Built on lot
- Exterior features: Wood exterior; Has view
Interior
- Kitchen: Dishwasher; Microwave; Refrigerator; Stove/Range
- Bedrooms: 3 bedrooms (all on upper level)
- Flooring: Hardwood; Carpet
- Bathrooms: 2 full bathrooms; 1 half bathroom
- Heating & cooling: Forced air heating; No central cooling
- Interior features: Ceiling fans; Fireplaces (2) - gas; Vaulted ceilings; Walk-in closets
- Laundry & utility: Washer; Dryer
Neighborhood map
What this means for you Summary
Snapshot
- This is a 3-bed/2.5-bath single-family listed at $650k.
Deal economics
- At list price, monthly cash flow is $-1k ($-15k/yr) — negative.
- To cash-flow at today's rent, offer at most $431k (33.7% below list).
- To meet the 1% rule (rent ≥ 1% of price), the offer needs to be $384k (40.9% below list).
- Recommended offer: $384k (40.9% below list) — sets the bar for 1% rule.
- Cap rate 4.0% vs local median 1.2% in Bainbridge Island — top-decile yield for the area; either an underpriced asset or a hidden risk that comps aren't pricing in. Stress-test before assuming the spread holds.
Location & tenants
- Location reads 79/100 on livability (#111 in WA, #2,257 nationally) — a middle-class / working-renter tenant base. Strengths: crime A+, employment A+, health & safety A; Watch: amenities F, cost of living F.
- Bainbridge Island School District (suburban): math 81% / reading 88% proficiency, ranked #2 of 291 in WA (top 1%) — strong family-tenant draw, lease renewals of 3-5y typical; only 6% free/reduced lunch — higher-income household profile.
- Zoned schools: Bainbridge High School (1,232 students, 11% FRL) — zoned schools at 11% FRL track the district average.
- Market conditions: Rents rising (+3.1%/yr); 219 active listings in the ZIP; 1 comparable units currently listed for rent nearby; high-income renter base; 1,294 units permitted in Kitsap County in 2024 (302 in 5+ unit buildings).
Forward outlook
- Local home prices are declining (-3.0%/yr); year-one equity from $4k of loan paydown is wiped out by about $20k of value loss. Plan a longer hold.
- Kitsap County population projected at +8% by 2050 — modest demand growth; plan on rents tracking national, not racing it.
Negotiation context
- Only 11 days on market — expect competitive offers; lowballing is unlikely to land.
- Current owner paid $27k; list at $650k implies a 2307% gain — meaningful room to come down on a strong offer.
Questions for the listing agent
- What do current leases actually rent for vs. the listed asking? Can we see a recent rent roll and the last 12 months of T-12 income?
- Is there a deadline driving the sale (1031 exchange, divorce, estate, relocation)? That informs how much negotiation room exists.
- Schools are A-rated — typically a magnet for longer-tenancy family renters. What's the average tenant stay here, and is there a school-zone premium baked into asking?
- The area grade is low — what's the realistic commute time and amenity access for the typical tenant pool here? Any planned neighborhood developments (good or bad) we should know about?
- What's the average days-on-market for RENTAL listings here right now (not sales)? A rising rental-DOM trend means longer vacancies and softer asking-rent achievability than the comps imply.
- What's the recent tenant-quality profile in this submarket — average credit score on applications, eviction rate, late-payment / NSF rate, and stable-employment percentage? A property-management company in the area should have these aggregated.
- How much new for-sale + rental construction is in the pipeline within 1–3 miles? Heavy new supply typically softens prices + rents 12–24 months out; constrained supply supports both.
Investment metrics
- 1% rule
- 0.59% ✗
- Cap rate
- 4.01%
- Cash-on-cash
- -8.16%
- DSCR
- 0.64
- GRM
- 14.1
CMA / ARV
- ARV (median comp)
- $1,377,790
- List price
- $650,000
- Delta
- -52.82%
- Verdict
- UNDERPRICED
- Comps
- 20 within 1.0 mi
Show comp detail 6 sales within ~0.75 mi
| Address | Dist | Beds/Ba | Sqft | Sold | Price | $/sf | Match |
|---|---|---|---|---|---|---|---|
| 16053 Surf Scoter Ln NE | 0.12mi | 3/2.5 | 1,945 (-15%) | 22mo | $1,500,000 | $771 | 52 |
| 7020 NE Dolphin Dr | 0.40mi | 3/2.5 | 2,464 (+8%) | 23mo | $977,000 | $397 | 49 |
| 14735 Henderson Rd NE | 0.62mi | 3/3.5 | 2,568 (+13%) | 2mo | $1,900,000 | $740 | 44 |
| 16290 Reitan Rd NE | 0.33mi | 3/3.0 | 2,592 (+14%) | 23mo | $748,000 | $289 | 41 |
| 6341 NE Balzow Rd | 0.72mi | 3/2.0 | 2,560 (+12%) | 8mo | $960,000 | $375 | 38 |
| 7500 NE Dolphin Dr | 0.59mi | 3/2.5 | 2,513 (+10%) | 22mo | $2,000,000 | $796 | 37 |
Match score weights: distance 35% · size 25% · config 20% · recency 20%. Top-matched comps best support the ARV.
Projected returns pro-forma
-3.0% appreciation · 3.09% rent growth · sell at horizon
- IRR
- -30.6%
- Equity multiple
- -0.01×
- Total profit
- $-183,923
- Equity at exit
- $96,917
- IRR
- -32.6%
- Equity multiple
- -0.43×
- Total profit
- $-260,588
- Equity at exit
- $56,200
Cash invested: $182,000 (down + closing). Projections, not guarantees.
Landlord ↔ Tenant lean methodology
- Overall (STATE)
- 28 Tenant-Leaning
- State Washington
- 28 Tenant-Leaning · D+8
- County
- — inherits STATE
- City
- — inherits STATE
ZIP-level market 98110
- Rents YoY
- 3.1%
- Active inventory
- 219
- Price-to-rent
- 14.1×
Monthly cashflow live
- Estimated rent
- $3,843 medium interval (Pro) →
- Mortgage (P&I)
- −$3,409
- Tax from tax record
- −$594 /mo · $7,134/yr
- Insurance
- −$271
- HOA
- −$0
- Vacancy / Maint / Mgmt
- −$807
- Net cashflow
- $-1,238
Break-even live
UW: 25.0% down · 7.5% · 30yr · 1.5% tax · 5.0% vac · 8.0% maint · 8.0% mgmt
Financing live
Cash to close
- Down payment
- $162,500
- Closing costs
- $19,500
- Reserves months
- —
- Total cash needed
- —
Loan-product check · same deal, 3 products live
Conventional
25% down · 7.5% · 30yr
- Down + closing
- —
- Monthly P&I
- —
- Monthly cashflow
- —
- DSCR
- —
- Eligible?
- —
Personal DTI + credit; lowest rate.
DSCR
20% down · 8.5% · 30yr
- Down + closing
- —
- Monthly P&I
- —
- Monthly cashflow
- —
- DSCR
- —
- Eligible?
- —
No personal income docs; deal must DSCR.
Hard money
10% down · 12.0% · 12mo
- Down + closing
- —
- Monthly P&I
- —
- Monthly cashflow
- —
- DSCR
- —
- Eligible?
- —
Short-term bridge; refi at stabilization.
Rent comps 1 comps
| Address | Beds | Baths | Sqft | Rent | $/sqft | DOM | Units | Dist |
|---|---|---|---|---|---|---|---|---|
| 15122 Annavera Ln Bainbridge Island, WA | 4.0 | 3.0 | 2300 | $5,700 | $2.48 | 13d | 1 | 1.13mi |
Listing history 2 events
-
2026-05-12$650,000 Active
-
1990-02-06soldstatus $27,000
ⓘ Source: listings_history table (triggers on properties + properties_extension) + one-shot
backfill from property_details.listing_events for pre-trigger history.
Tax reassessment forecast WA · Resets to sale price
- Current annual tax
- $7,134 · $594/mo
- Projected year-2 tax
- $7,134 · $594/mo
- Expected delta
- $0/yr ($0/mo · 0.0%)
ⓘ Screening estimate from a state-policy table — verify with the county assessor before closing.
Climate risk First Street
- Flood 1/10 Low FEMA zone X (unshaded) · 0% chance over 30 yrs
- Wildfire 1/10 Low
- Heat 2/10 Low 7 d/yr ≥86°F today · 14 d/yr by 30 yrs out
- Wind 1/10 Low
- Air quality 6/10 Major 9 unhealthy d/yr today · 9 by 30 yrs out
Nearby sold comps map
Loading sold comps map…
Walkable amenities ~0.75 mi
Loading nearby amenities…
Taxation est. · year 1
- Rental income
- $46,112
- − Mortgage interest
- −$36,410
- − Property taxes
- −$7,134
- − Insurance
- −$3,250
- − Repairs & maintenance
- −$3,689
- − Management
- −$3,689
- − Depreciation
- −$18,909
- Taxable loss
- −$26,969
- Est. tax savings @ 24.0%
- +$6,473
- After-tax cash flow
- $-8,387/yr
For passive investors: Depreciation is non-cash, so a rental often shows a tax loss while cash-flowing — sheltering income. Rental losses are passive: they offset passive income freely, and up to $25,000/yr can offset ordinary (W-2) income if you actively participate and your MAGI is under $100k (phasing out to $0 by $150k); unused losses carry forward. On sale, claimed depreciation is recaptured at up to 25%, and gains may owe capital-gains tax (a 1031 exchange can defer both). Figures are a year-1 estimate at your 24.0% rate — not tax advice; consult a CPA.
Schools (NCES district)
- District
- Bainbridge Island School District
- NCES district ID
- 5300330
- Math proficiency
- 81% ▲ 2.00%
- Reading proficiency
- 88% ▲ 2.00%
- Median HH income
- $97,391
- Composite
- 76.51/100
- National rank
- #204
- State rank
- #2 of 291 in WA
Livability — Bainbridge Island
- Score
- 79/100
- State rank
- #111
- US rank
- #2257
Category grades
Schools grade is shown separately in the Schools card above.
Census & demographics
- Census place
- Bainbridge Island, WA
- County
- Kitsap County · 243,099 people
- City population
- 24,631
- Metro
- Bremerton-Silverdale-Port Orchard, WA
- Population (ZIP)
- 24,631
- Household income
- $172,188
- Rent vs Own
- Severe rent burden
- 356.0
Population outlook (Kitsap County) Hauer SSP2
- Today (2025)
- 277,525 people
- By 2030
- 285,040 · +2.7%
- By 2040
- 294,957 · +6.3%
- By 2050
- 300,622 · +8.3%
- By 2075
- 315,580 · +13.7%
- By 2100
- 304,340 · +9.7%
Race, ethnicity, and origin ACS 2023
- Neighborhood character
- Predominantly White (83%)
- Race & ethnicity
- White 83% Two or more races 8% Hispanic / Latino 4% Asian 4%
- Common ancestry
- Italian 6% Portuguese 5% Slovak 4%
- Foreign-born
- 8% · Canada, China
- Languages at home
- 94% English-only · Spanish 2% Other Indo-European 1% German/W. Germanic 1%
Political lean MEDSL · Kitsap
- 2024 margin
- Strong D (+20.9) · D 58.8% · R 37.9% · Other 3.3%
- 2008→2024 swing
- +8.6pp toward D · 2008: 12.3pp · 2024: 20.9pp
- All cycles
- 2024: D+20.9 2020: D+18.1 2016: D+11.6 2012: D+11.1 2008: D+12.3
Not yet ingested
- Civics
- —
Market trends
- HPI YoY
- ▼ -565.44%
- Current HPI
- 351.8728
- Rent YoY
- ▲ 3.09%
- Metro
- Bremerton-Silverdale-Port Orchard, WA
- State GDP YoY
- ▲ 4.65%
- F500 in state
- 22
Industry mix (Fortune 500 HQ in WA)
| Industry | F500 HQs | Revenue |
|---|---|---|
| Retail | 2 | $269B |
|
||
| Technology / Retail | 1 | $638B |
|
||
| Technology | 1 | $245B |
|
||
| Telecommunications | 1 | $38B |
|
||
| Food / Beverage | 1 | $36B |
|
||
| Automotive / Trucks | 1 | $34B |
|
||
Price history
+2307.4% since first listed3 events — show timeline
- 2026-05-23 Pending — NWMLS as Distributed by MLS Grid
- 2026-05-12 Listed $650,000 NWMLS as Distributed by MLS Grid
- 1990-02-06 Sold (Public Records) $27,000 Public Records
Property tax history
+2.9%/yrLatest (2026): $7,134 · -8.8% YoY. Source: county tax records.
Cash-flow waterfall
monthlySold comps — $/sqft
last 12 mo · ≤1 miLoading sold comps…