168 Wisdom Quest Rd · Bonners Ferry, ID
Flood risk 3/10 · Minor
- FEMA flood zone
- X
- Chance of flooding over 30 yrs
- 0.2%
- Est. flood insurance / yr
- $507 – $1,088
Fire risk 6/10 · Moderate
- Est. fire insurance / yr
- $584 – $1,086
Heat risk 2/10 · Minimal
- Hot days now (above 91°F)
- 8 days/yr
- Hot days in 30 yrs
- 18 days/yr
Wind risk 1/10 · Minimal
- Chance of severe wind over 30 yrs
- —
Air-quality risk 9/10 · Severe
- Unhealthy air days now
- 16 days/yr
- Unhealthy air days in 30 yrs
- 20 days/yr
Risk factors via First Street. Map © Google.
Why this score? — see what drove the C grade
The composite is a weighted blend of 9 inputs, each scored 0–100. Each bar is that input's sub-score; the figure is the points it added to the 100-point composite (weight × sub-score).
- Cash flow +23.7/30.0
- DSCR +7.6/10.0
- ARV discount +7.5/15.0
- 1% rule +6.1/10.0
- Schools +4.1/10.0
- Condition / age +3.8/5.0
- Livability +3.2/5.0
- Rent growth +2.5/5.0
- Appreciation +0.0/10.0
$74,900
🖨 Deal sheet 📄 Offer letter ✓ Due diligence
Listing remarks
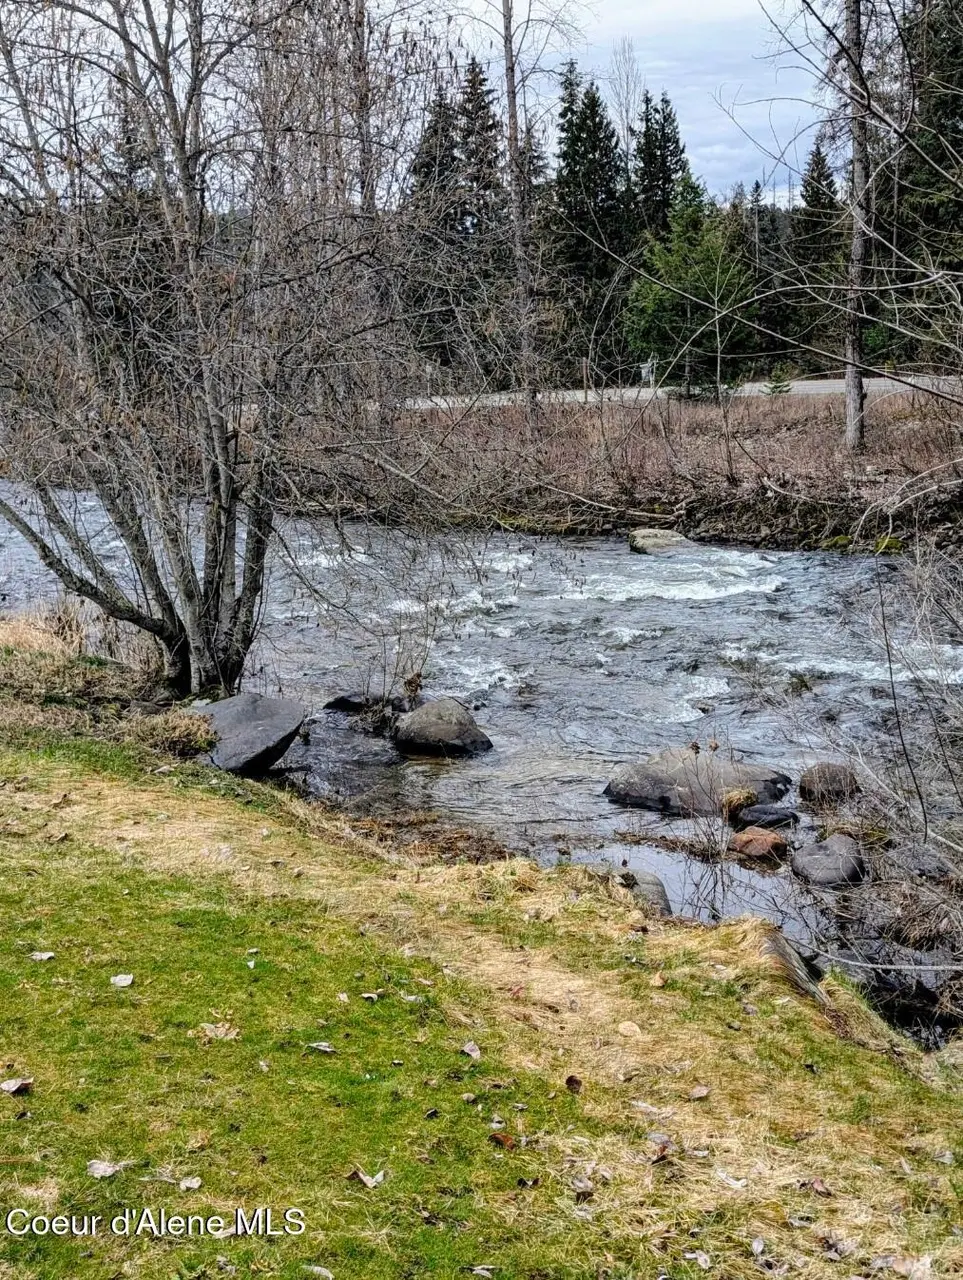
* * Price reduced * * !!) SNOWBIRDS, INVESTORS and 1ST Time buyers take note! (SELLER Paying a portion of the lot rent through the END of 2027!!) This is the PERFECT Creekside home ready to enjoy living in year round, to purchase it and have it as a rental investment property or button it up when the temp drops below 50 for 7 days straight and head South! Want fresh fish? Step 20 feet out the back and drop a line in Deep Creek which flows year round! 90 Degrees out in the summer? Walk out back and have a seat in the creek and cool off! Lot rent is currently $317.00 per month. Located in a very nicely run establishment, the combination of multiple uses, location and the creek on this one a
Key facts
- Built 1968
- Listed 84 days
Property features AI
Exterior
- Utilities: Private sewer; Community water system; Electric service
- Home design: Mobile Home
- Construction: T1-11 siding; Metal roof; Pillar/post/pier foundation; Built as a single-story structure
- Exterior features: Open, level lot with southern exposure; Private maintained road
Interior
- Kitchen: Refrigerator
- Bedrooms: 2 main-level bedrooms
- Flooring: LVP flooring
- Bathrooms: 1 main-level bathroom
- Heating & cooling: Electric forced-air furnace
- Interior features: Electric water heater; No basement
- Laundry & utility: Electric dryer hookup
Neighborhood map
What this means for you Summary
Snapshot
- This is a 2-bed/1.0-bath single-family listed at $75k. Condition is rated good.
Deal economics
- At list price, monthly cash flow is $142 ($2k/yr) — positive.
- The deal already cash-flows at list — no discount required.
- Meets the 1% rule at list price ($835 rent vs $75k).
- Recommended offer: $70k (6.0% below list) — sets the bar for market timing.
- Cap rate 8.6% vs local median 0.8% in Bonners Ferry — top-decile yield for the area; either an underpriced asset or a hidden risk that comps aren't pricing in. Stress-test before assuming the spread holds.
Location & tenants
- Location reads 63/100 on livability (#154 in ID) — a middle-class / working-renter tenant base. Strengths: cost of living A+, crime A-, housing B+; Watch: schools D+, amenities F, commute F.
- Boundary County District (town): math 40% / reading 58% proficiency, ranked #42 of 92 in ID (top 46%) — families likely to look elsewhere, expect single-tenant / working-renter base with shorter leases.
- Market conditions: 181 active listings in the ZIP; 69 units permitted in Boundary County in 2024 (0 in 5+ unit buildings).
Forward outlook
- Local home prices are declining (-3.0%/yr); year-one equity from $518 of loan paydown is wiped out by about $2k of value loss. Plan a longer hold.
Negotiation context
- It's been on market 85 days — a 6% lower offer ($70k) is reasonable based on typical stale-listing flexibility.
Risks & watch-outs
- Climate carrying-cost: major wildfire risk — expect insurance premiums to compound above CPI over the hold.
Questions for the listing agent
- It's been on market 85 days. Have you received any prior offers? Is the seller open to a 6% concession, seller financing, or rate buy-down credit?
- Built in 1968 — when were the roof, HVAC, electrical panel, plumbing, and water heater last replaced?
- Why hasn't it sold? Are there any deal-killer items the seller is aware of (foundation, flood, title, zoning, code violations)?
- Is there a deadline driving the sale (1031 exchange, divorce, estate, relocation)? That informs how much negotiation room exists.
- Schools are D-rated, which usually means shorter tenancies and higher turnover. Who's the typical renter profile here, and what's been the actual vacancy rate?
- What's the average days-on-market for RENTAL listings here right now (not sales)? A rising rental-DOM trend means longer vacancies and softer asking-rent achievability than the comps imply.
- What's the recent tenant-quality profile in this submarket — average credit score on applications, eviction rate, late-payment / NSF rate, and stable-employment percentage? A property-management company in the area should have these aggregated.
- How much new for-sale + rental construction is in the pipeline within 1–3 miles? Heavy new supply typically softens prices + rents 12–24 months out; constrained supply supports both.
Investment metrics
- 1% rule
- 1.11% ✓
- Cap rate
- 8.57%
- Cash-on-cash
- 8.13%
- DSCR
- 1.36
- GRM
- 7.5
CMA / ARV
No comps found within radius.
Projected returns pro-forma
-3.0% appreciation · 3.0% rent growth · sell at horizon
- IRR
- -3.9%
- Equity multiple
- 0.85×
- Total profit
- $-3,074
- Equity at exit
- $11,168
- IRR
- 5.8%
- Equity multiple
- 1.43×
- Total profit
- $9,028
- Equity at exit
- $6,476
Cash invested: $20,972 (down + closing). Projections, not guarantees.
Landlord ↔ Tenant lean methodology
- Overall (STATE)
- 91 Strongly Landlord-Friendly
- State Idaho
- 91 Strongly Landlord-Friendly · R+18
- County
- — inherits STATE
- City
- — inherits STATE
ZIP-level market 83805
- Home prices YoY
- -17.4%
- Active inventory
- 181
- Price-to-rent
- 7.5×
Monthly cashflow live
- Estimated rent
- $835 medium interval (Pro) →
- Mortgage (P&I)
- −$393
- Tax est. 1.5%
- −$94 /mo · $1,124/yr
- Insurance
- −$31
- HOA
- −$0
- Vacancy / Maint / Mgmt
- −$175
- Net cashflow
- $142
Break-even live
UW: 25.0% down · 7.5% · 30yr · 1.5% tax · 5.0% vac · 8.0% maint · 8.0% mgmt
Financing live
Cash to close
- Down payment
- $18,725
- Closing costs
- $2,247
- Reserves months
- —
- Total cash needed
- —
Loan-product check · same deal, 3 products live
Conventional
25% down · 7.5% · 30yr
- Down + closing
- —
- Monthly P&I
- —
- Monthly cashflow
- —
- DSCR
- —
- Eligible?
- —
Personal DTI + credit; lowest rate.
DSCR
20% down · 8.5% · 30yr
- Down + closing
- —
- Monthly P&I
- —
- Monthly cashflow
- —
- DSCR
- —
- Eligible?
- —
No personal income docs; deal must DSCR.
Hard money
10% down · 12.0% · 12mo
- Down + closing
- —
- Monthly P&I
- —
- Monthly cashflow
- —
- DSCR
- —
- Eligible?
- —
Short-term bridge; refi at stabilization.
Listing history 20 events
-
2026-06-19days on market $74,900 Active 85 DOM
-
2026-06-18days on market $74,900 Active 84 DOM
-
2026-06-17days on market $74,900 Active 83 DOM
-
2026-06-16days on market $74,900 Active 82 DOM
-
2026-06-15days on market $74,900 Active 81 DOM
-
2026-06-14days on market $74,900 Active 79 DOM
-
2026-06-12days on market $74,900 Active 78 DOM
-
2026-06-09days on market $74,900 Active 75 DOM
-
2026-06-08days on market $74,900 Active 74 DOM
-
2026-06-07days on market $74,900 Active 73 DOM
-
2026-06-07pricedays on market $74,900 Active 72 DOM
-
2026-06-04days on market $79,500 Active 69 DOM
-
2026-06-02days on market $79,500 Active 68 DOM
-
2026-06-01days on market $79,500 Active 67 DOM
-
2026-05-31days on market $79,500 Active 66 DOM
-
2026-05-31days on market $79,500 Active 65 DOM
-
2026-05-14price $79,500
-
2026-04-30price $82,500
-
2026-04-13price $84,500
-
2026-03-26$89,000 Active
ⓘ Source: listings_history table (triggers on properties + properties_extension) + one-shot
backfill from property_details.listing_events for pre-trigger history.
Climate risk First Street
- Flood 3/10 Moderate FEMA zone X · 20% chance over 30 yrs
- Wildfire 6/10 Major
- Heat 2/10 Low 8 d/yr ≥91°F today · 18 d/yr by 30 yrs out
- Wind 1/10 Low
- Air quality 9/10 Extreme 16 unhealthy d/yr today · 20 by 30 yrs out
Nearby sold comps map
Loading sold comps map…
Walkable amenities ~0.75 mi
Loading nearby amenities…
Taxation est. · year 1
- Rental income
- $10,021
- − Mortgage interest
- −$4,196
- − Property taxes
- −$1,124
- − Insurance
- −$374
- − Repairs & maintenance
- −$802
- − Management
- −$802
- − Depreciation
- −$2,179
- Taxable income
- $545
- Est. tax owed @ 24.0%
- −$131
- After-tax cash flow
- $1,574/yr
For passive investors: Depreciation is non-cash, so a rental often shows a tax loss while cash-flowing — sheltering income. Rental losses are passive: they offset passive income freely, and up to $25,000/yr can offset ordinary (W-2) income if you actively participate and your MAGI is under $100k (phasing out to $0 by $150k); unused losses carry forward. On sale, claimed depreciation is recaptured at up to 25%, and gains may owe capital-gains tax (a 1031 exchange can defer both). Figures are a year-1 estimate at your 24.0% rate — not tax advice; consult a CPA.
Condition & rehab AI · 13 photos
This single-family home is in good condition with a good condition score of 75. It has a good kitchen, bathrooms, and exterior. The home is ready to enjoy living in year-round and can be used as a rental investment property. The home has a good curb appeal with a small creek and trees in the background. The home has a good foundation and structure and the HVAC system appears to be in good condition. The home has a good roof and the flooring is hardwood and in good condition. The home has good interior walls and paint and the windows are intact and in good condition. The home has good maintenance needs and the home is ready to enjoy living in year-round and can be used as a rental investment property.
Value-add opportunities
- Resale Paint the exterior siding — Painting the exterior siding can enhance the curb appeal and make the home look more inviting to potential buyers.
- Resale Replace any damaged windows — Replacing damaged windows can improve the home's energy efficiency and make it more attractive to potential buyers.
- Both Upgrade the HVAC system — Upgrading the HVAC system can improve the home's comfort and energy efficiency, making it more attractive to both buyers and renters.
Renovation cost estimate screening
Value-add ROI direction
- Resale Paint the exterior siding — Painting the exterior siding can enhance the curb appeal and make the home look more inviting to potential buyers. ↑
- Resale Replace any damaged windows — Replacing damaged windows can improve the home's energy efficiency and make it more attractive to potential buyers. ↑
- Both Upgrade the HVAC system — Upgrading the HVAC system can improve the home's comfort and energy efficiency, making it more attractive to both buyers and renters. ↑
ⓘ Cost ranges are severity-bucket heuristics (US national rule-of-thumb). Get contractor quotes + a written scope before underwriting a rehab budget.
Schools (NCES district)
- District
- Boundary County District
- NCES district ID
- 1600420
- Math proficiency
- 40% ▼ -2.00%
- Reading proficiency
- 58% ▲ 1.00%
- Median HH income
- $38,598
- Composite
- 40.8/100
- National rank
- #3638
- State rank
- #42 of 92 in ID
Livability — Bonners Ferry
- Score
- 63/100
- State rank
- #154
- US rank
- #14914
Category grades
Schools grade is shown separately in the Schools card above.
Census & demographics
- Population (ZIP)
- 8,909
Population outlook (Boundary County) Hauer SSP2
- Today (2025)
- 11,888 people
- By 2030
- 12,068 · +1.5%
- By 2040
- 12,132 · +2.1%
- By 2050
- 11,952 · +0.5%
- By 2075
- 11,265 · -5.2%
- By 2100
- 9,878 · -16.9%
Race, ethnicity, and origin ACS 2023
- Neighborhood character
- Predominantly White (89%)
- Race & ethnicity
- White 89% Hispanic / Latino 6% Two or more races 3% Native American 1% Black 1%
- Hispanic origin (detail)
- Mexican 5%
- Common ancestry
- Portuguese 4% Scottish 4% Slovak 3%
- Foreign-born
- 5% · Canada
- Languages at home
- 93% English-only · Spanish 3% French/Haitian/Cajun 1% German/W. Germanic 1%
Political lean MEDSL · Boundary
- 2024 margin
- Solid R (+65.4) · D 16.1% · R 81.5% · Other 2.4%
- 2008→2024 swing
- -31.7pp toward R · 2008: -33.7pp · 2024: -65.4pp
- All cycles
- 2024: R+65.4 2020: R+58.9 2016: R+55.5 2012: R+42.1 2008: R+33.7
Not yet ingested
- Civics
- —
Market trends
- HPI YoY
- ▼ -55.72%
- Current HPI
- 264.1753
- Rent YoY
- —
- Metro
- —
- State GDP YoY
- ▲ 4.51%
- F500 in state
- 6
Industry mix (Fortune 500 HQ in ID)
| Industry | F500 HQs | Revenue |
|---|---|---|
| Retail | 1 | $79B |
|
||
| Technology | 1 | $25B |
|
||
| Food / Agriculture | 1 | $6B |
|
||
Price history
-10.7% since first listed4 events — show timeline
- 2026-05-14 Price Changed $79,500 CDAMLS
- 2026-04-30 Price Changed $82,500 CDAMLS
- 2026-04-13 Price Changed $84,500 CDAMLS
- 2026-03-26 Listed $89,000 CDAMLS
Cash-flow waterfall
monthlySold comps — $/sqft
last 12 mo · ≤1 miLoading sold comps…