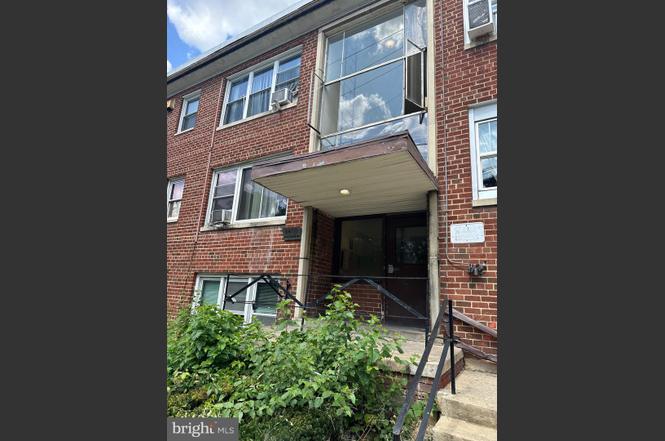
2400 Good Hope Rd SE #3 · Washington, DC
Flood risk 7/10 · Major
- FEMA flood zone
- X (unshaded)
- Chance of flooding over 30 yrs
- 0.78%
- Est. flood insurance / yr
- $507 – $1,088
Fire risk 1/10 · Minimal
- Est. fire insurance / yr
- $631 – $1,173
Heat risk 7/10 · Major
- Hot days now (above 104°F)
- 7 days/yr
- Hot days in 30 yrs
- 14 days/yr
Wind risk 4/10 · Minor
- Chance of severe wind over 30 yrs
- 18.0%
Air-quality risk 4/10 · Minor
- Unhealthy air days now
- 4 days/yr
- Unhealthy air days in 30 yrs
- 5 days/yr
Risk factors via First Street. Map © Google.
Why this score? — see what drove the B grade
The composite is a weighted blend of 9 inputs, each scored 0–100. Each bar is that input's sub-score; the figure is the points it added to the 100-point composite (weight × sub-score).
- Cash flow +30.0/30.0
- 1% rule +10.0/10.0
- DSCR +10.0/10.0
- ARV discount +7.5/15.0
- Livability +3.7/5.0
- Schools +3.6/10.0
- Rent growth +3.5/5.0
- Condition / age +2.5/5.0
- Appreciation +0.0/10.0
$115,000
🖨 Deal sheet 📄 Offer letter ✓ Due diligence
Key facts
- $529 HOA
- Built 1940
- Listed 153 days
Property features AI
Finance
- Other: Ownership interest: Condominium; Improvement and land assessed values available
- HOA & community: Condo fee $529 per month; Condo fee includes common area maintenance and water
Exterior
- Parking: Parking lot
- Utilities: Public water; Public sewer; Natural gas heating and hot water
- Home design: Condominium unit (Unit/Flat); Garden-style building (1–4 floors); Entry on level 1
- Construction: Brick construction; Above-grade and below-grade structures; Year built estimated
- Exterior features: Not in a federal flood zone; Tidal water not present; Pets allowed with breed restrictions
Interior
- Bedrooms: Two bedrooms on the main level
- Bathrooms: One full bathroom on the main level
- Heating & cooling: Radiator heating; Natural gas hot water
- Interior features: Estimated living area; No basement
- Laundry & utility: No in-unit washer/dryer or hookups
Neighborhood map
What this means for you Summary
Snapshot
- This is a 3-bed/1.0-bath condo listed at $115k.
Deal economics
- At list price, monthly cash flow is $412 ($5k/yr) — positive.
- The deal already cash-flows at list — no discount required.
- Meets the 1% rule at list price ($2k rent vs $115k).
- Recommended offer: $101k (12.0% below list) — sets the bar for market timing.
- Cap rate 11.3% vs local median 2.5% in Washington — top-decile yield for the area; either an underpriced asset or a hidden risk that comps aren't pricing in. Stress-test before assuming the spread holds.
Location & tenants
- Location reads 73/100 on livability (#1 in DC) — a middle-class / working-renter tenant base. Strengths: amenities A+, commute A+, employment A+; Watch: crime F, cost of living F.
- District Of Columbia Public Schools (urban): math 33% / reading 40% proficiency, ranked #8 of 32 in DC (top 25%) — families likely to look elsewhere, expect single-tenant / working-renter base with shorter leases; 65% free/reduced lunch — lower-income household profile, screen leases tightly.
- Market conditions: Rents rising (+3.9%/yr); 296 active listings in the ZIP; 40 comparable units currently listed for rent nearby; rentals at typical pace (median 24d on market — plan ~3-4 weeks tenant-placement turnaround); 1,737 units permitted in District of Columbia in 2024 (1,506 in 5+ unit buildings).
- At $2,177/mo this rent would consume 48% of the median local household income ($54k/yr) (locally 5148% of renters already pay >50% of income on rent) — very limited rent-growth headroom before tenants either downsize or default.
Forward outlook
- Local home prices are declining (-3.0%/yr); year-one equity from $795 of loan paydown is wiped out by about $3k of value loss. Plan a longer hold.
- District of Columbia County population projected at +50% by 2050 — long-run rental-demand tailwind backs the buy-and-hold thesis.
- At projected returns (-3.0% appreciation + 3.9% rent growth), your $32k cash investment doubles in ~7 years — after that, you're playing with house money.
Negotiation context
- It's been on market 154 days — a 12% lower offer ($101k) is reasonable based on typical stale-listing flexibility.
- 7 sale attempts since 12y ago with the ask held roughly flat each time — persistent listings suggest the price (not the market) is what's stuck; bring a comps-based counter.
- Current owner paid $20k; list at $115k implies a 476% gain — meaningful room to come down on a strong offer.
Risks & watch-outs
- Watch-outs: flood insurance adds $66/mo; HOA is 24% of rent; built in 1940 — expect roof / HVAC / electrical / plumbing capex.
- Climate carrying-cost: major flood risk; extreme-heat days projected 7→14/yr by 2055 (HVAC capex compounding) — expect insurance premiums to compound above CPI over the hold.
Questions for the listing agent
- It's been on market 154 days. Have you received any prior offers? Is the seller open to a 12% concession, seller financing, or rate buy-down credit?
- Built in 1940 — when were the roof, HVAC, electrical panel, plumbing, and water heater last replaced?
- What's the actual annual flood-insurance premium (NFIP or private), and is the property in a SFHA with mandatory coverage?
- What does the HOA fee cover, when was the last increase, and are there any pending special assessments or reserve-fund shortfalls?
- Any open or pending special assessments — roof, HVAC, plumbing, elevator, façade? What's the per-unit balance and payoff schedule, and is the seller paying it off at close or rolling it to the buyer?
- Why hasn't it sold? Are there any deal-killer items the seller is aware of (foundation, flood, title, zoning, code violations)?
- Is there a deadline driving the sale (1031 exchange, divorce, estate, relocation)? That informs how much negotiation room exists.
- Crime grade is F in this area — have there been break-ins, vandalism, or insurance claims at this property in the last 3 years? What carrier currently insures it and at what premium?
- What's the average days-on-market for RENTAL listings here right now (not sales)? A rising rental-DOM trend means longer vacancies and softer asking-rent achievability than the comps imply.
- What's the recent tenant-quality profile in this submarket — average credit score on applications, eviction rate, late-payment / NSF rate, and stable-employment percentage? A property-management company in the area should have these aggregated.
- How much new apartment / multifamily construction is in the pipeline within 1–3 miles? Heavy new supply (>2% of stock underway) typically softens rents 12–24 months out; light construction supports rent growth.
Investment metrics
- 1% rule
- 1.89% ✓
- Cap rate
- 11.29%
- Cash-on-cash
- 17.84%
- DSCR
- 1.79
- GRM
- 4.4
CMA / ARV
No comps found within radius.
Projected returns pro-forma
-3.0% appreciation · 3.86% rent growth · sell at horizon
- IRR
- 7.7%
- Equity multiple
- 1.31×
- Total profit
- $9,876
- Equity at exit
- $17,147
- IRR
- 18.2%
- Equity multiple
- 2.61×
- Total profit
- $51,766
- Equity at exit
- $9,943
Cash invested: $32,200 (down + closing). Projections, not guarantees.
Landlord ↔ Tenant lean methodology
- Overall (CITY)
- 0 Strongly Tenant-Friendly
- State District of Columbia
- 12 Strongly Tenant-Friendly · D+43
- County
- — inherits STATE
- City Washington
- 0 Strongly Tenant-Friendly · D+43
ZIP-level market 20020
- Rents YoY
- 3.9%
- Active inventory
- 296
- Price-to-rent
- 4.4×
Monthly cashflow live
- Estimated rent
- $2,177 high interval (Pro) →
- Mortgage (P&I)
- −$603
- Tax from tax record
- −$61 /mo · $736/yr
- Insurance
- −$48
- Flood insurance flood zone
- −$66 /mo · $798/yr
- HOA
- −$529
- Vacancy / Maint / Mgmt
- −$457
- Net cashflow
- $412
Break-even live
UW: 25.0% down · 7.5% · 30yr · 1.5% tax · 5.0% vac · 8.0% maint · 8.0% mgmt
Financing live
Cash to close
- Down payment
- $28,750
- Closing costs
- $3,450
- Reserves months
- —
- Total cash needed
- —
Loan-product check · same deal, 3 products live
Conventional
25% down · 7.5% · 30yr
- Down + closing
- —
- Monthly P&I
- —
- Monthly cashflow
- —
- DSCR
- —
- Eligible?
- —
Personal DTI + credit; lowest rate.
DSCR
20% down · 8.5% · 30yr
- Down + closing
- —
- Monthly P&I
- —
- Monthly cashflow
- —
- DSCR
- —
- Eligible?
- —
No personal income docs; deal must DSCR.
Hard money
10% down · 12.0% · 12mo
- Down + closing
- —
- Monthly P&I
- —
- Monthly cashflow
- —
- DSCR
- —
- Eligible?
- —
Short-term bridge; refi at stabilization.
Rent comps 40 comps
| Address | Beds | Baths | Sqft | Rent | $/sqft | DOM | Units | Dist |
|---|---|---|---|---|---|---|---|---|
| 2300 Good Hope Rd SE Washington, DC | 2.0 | 1.0–2.0 | 1020 | $1,913 | $1.88 | 24d | 6 | 0.16mi |
| 2562 Naylor Rd SE Washington, DC | 1.0–2.0 | 1.0 | 790 | $2,075 | $2.63 | 2d | 21 | 0.19mi |
| 1907 Marion Barry Ave SE Washington, DC | 2.0 | 1.0 | 900 | $1,495 | $1.66 | 24d | 1 | 0.28mi |
| 1907 Good Hope Ct SE #309 Washington, DC | 2.0 | 1.0 | 670 | $1,595 | $2.38 | 24d | 1 | 0.28mi |
| 1953 19th Pl SE Apt 104 Washington, DC | 3.0 | 1.0 | 980 | $2,800 | $2.86 | 5d | 1 | 0.33mi |
| 1953 19th Pl SE Apt 301 Washington, DC | 3.0 | 1.0 | 980 | $5,301 | $5.41 | 24d | 1 | 0.34mi |
| 1847 Marion Barry Ave SE Washington, DC | 1.0–2.0 | 1.0 | 725 | $1,525 | $2.10 | 24d | 1 | 0.38mi |
| 2440 S St SE Unit 4 Washington, DC | 3.0 | 1.0 | 800 | $2,450 | $3.06 | 7d | 1 | 0.38mi |
| 2515 R St SE Washington, DC | 1.0–2.0 | 1.0 | 812 | $1,755 | $2.16 | 5d | 2 | 0.42mi |
| 2495 Alabama Ave SE Unit 302 Washington, DC | 3.0 | 1.0 | 825 | $2,600 | $3.15 | 22d | 1 | 0.46mi |
| 2621 30th St SE Unit 1 Washington, DC | 2.0 | 1.0 | 800 | $1,750 | $2.19 | 24d | 1 | 0.49mi |
| 2805 28th St SE Unit 1 Washington, DC | 2.0 | 1.0 | 800 | $1,690 | $2.11 | 24d | 1 | 0.49mi |
| 1737 T St SE Washington, DC | 2.0 | 1.0 | 800 | $2,500 | $3.12 | 4d | 1 | 0.49mi |
| 2801 R St SE Unit 2 Washington, DC | 2.0 | 1.0 | 700 | $1,569 | $2.24 | 24d | 1 | 0.50mi |
| 2341 Green St SE Washington, DC | 2.0 | 1.0 | 741 | $1,225 | $1.65 | 24d | 1 | 0.51mi |
| 2833 28th St SE Unit 4 Washington, DC | 3.0 | 1.0 | 820 | $2,200 | $2.68 | 24d | 1 | 0.51mi |
| 1721 T St SE Washington, DC | 1.0–2.0 | 1.0 | 785 | $1,980 | $2.52 | 22d | 6 | 0.52mi |
| 1616 27th St SE Unit 6 Washington, DC | 3.0 | 1.0 | 1100 | $2,850 | $2.59 | 24d | 1 | 0.52mi |
| 2821 R St SE Washington, DC | 2.0 | 1.0 | 853 | $1,650 | $1.93 | 24d | 1 | 0.52mi |
| 2716 29th St SE Washington, DC | 2.0 | 1.0 | 850 | $2,000 | $2.35 | 24d | 1 | 0.58mi |
| 1721 Minnesota Ave SE Washington, DC | 3.0 | 1.0 | 680 | $1,450 | $2.13 | 24d | 1 | 0.58mi |
| 1526 V St SE Unit 2 Washington, DC | 2.0 | 1.0 | 800 | $1,700 | $2.12 | 24d | 1 | 0.59mi |
| 1525 28th St SE Unit 302 Washington, DC | 3.0 | 1.0 | 900 | $2,100 | $2.33 | 24d | 1 | 0.60mi |
| 2816 Hartford St SE Washington, DC | 3.0 | 1.0 | 760 | $9,000 | $11.84 | 4d | 1 | 0.60mi |
| 2215 Minnesota Ave SE Unit 18 Washington, DC | 4.0 | 2.0 | 990 | $4,500 | $4.55 | 24d | 1 | 0.60mi |
| 2215 Minnesota Ave SE Unit 3 Washington, DC | 3.0 | 1.0 | 750 | $2,500 | $3.33 | 24d | 1 | 0.60mi |
| 1550 27th St SE Washington, DC | 2.0 | 1.0 | 660 | $1,250 | $1.89 | 4d | 1 | 0.60mi |
| 1618 18th St SE Unit 1 Washington, DC | 2.0 | 1.0 | 800 | $1,850 | $2.31 | 24d | 1 | 0.61mi |
| 2841 Gainesville St SE #201 Washington, DC | 2.0 | 1.0 | 784 | $1,900 | $2.42 | 2d | 1 | 0.62mi |
| 2847 Gainesville St SE Unit B2 Washington, DC | 2.0 | 1.0 | 710 | $1,700 | $2.39 | 24d | 1 | 0.63mi |
| 2847 Gainesville St SE Unit 303 Washington, DC | 3.0 | 1.0 | 902 | $2,400 | $2.66 | 24d | 1 | 0.63mi |
| 2838 Hartford St SE #304 Washington, DC | 2.0 | 1.0 | 775 | $1,500 | $1.94 | 2d | 1 | 0.63mi |
| 2838 Hartford St SE Washington, DC | 2.0 | 1.0 | 785 | $1,538 | $1.96 | 18d | 2 | 0.63mi |
| 1720 R St SE Washington, DC | 3.0 | 1.0 | 750 | $2,500 | $3.33 | 24d | 1 | 0.63mi |
| 1516 Marion Barry Ave SE Unit 301 Washington, DC | 3.0 | 2.0 | 1100 | $1,795 | $1.63 | 7d | 1 | 0.66mi |
| 2925-2929 Pennsylvania Ave SE Unit 106 Washington, DC | 4.0 | 1.0 | 988 | $4,200 | $4.25 | 24d | 1 | 0.66mi |
| 2925-2929 Pennsylvania Ave SE Unit 204 Washington, DC | 3.0 | 1.0 | 980 | $3,000 | $3.06 | 4d | 1 | 0.66mi |
| 2925-2929 Pennsylvania Ave SE Unit 106 Washington, DC | 4.0 | 1.0 | 980 | $4,200 | $4.29 | 4d | 1 | 0.66mi |
| 2472 Alabama Ave SE Unit B2 Washington, DC | 3.0 | 1.0 | 827 | $2,500 | $3.02 | 24d | 1 | 0.66mi |
| 1622 17th St SE Unit 2001 Washington, DC | 2.0 | 1.0 | 535 | $1,850 | $3.46 | 24d | 1 | 0.67mi |
HOA detail condo
- Monthly dues
- $529 · $6,348/yr
- Assessments
- None detected in remarks — confirm with the listing agent.
Listing history 13 events
-
2026-06-18days on market $115,000 Active 154 DOM
-
2026-06-17days on market $115,000 Active 153 DOM
-
2026-06-16days on market $115,000 Active 152 DOM
-
2026-06-15days on market $115,000 Active 151 DOM
-
2026-06-13days on market $115,000 Active 149 DOM
-
2026-06-09days on market $115,000 Active 145 DOM
-
2026-06-08days on market $115,000 Active 144 DOM
-
2026-06-07days on market $115,000 Active 143 DOM
-
2026-06-04days on market $115,000 Active 140 DOM
-
2026-06-03days on market $115,000 Active 139 DOM
-
2026-06-02days on market $115,000 Active 138 DOM
-
2026-06-01days on market $115,000 Active 137 DOM
-
2026-05-31$115,000 Active 136 DOM
ⓘ Source: listings_history table (triggers on properties + properties_extension) + one-shot
backfill from property_details.listing_events for pre-trigger history.
Tax reassessment forecast DC · Partial reset (capped growth)
- Current annual tax
- $736 · $61/mo
- Projected year-2 tax
- $736 · $61/mo
- Expected delta
- $0/yr ($0/mo · 0.0%)
ⓘ Screening estimate from a state-policy table — verify with the county assessor before closing.
Climate risk First Street
- Flood 7/10 Severe FEMA zone X (unshaded) · 78% chance over 30 yrs
- Wildfire 1/10 Low
- Heat 7/10 Severe 7 d/yr ≥104°F today · 14 d/yr by 30 yrs out
- Wind 4/10 Moderate 18% chance of damaging wind over 30 yrs
- Air quality 4/10 Moderate 4 unhealthy d/yr today · 5 by 30 yrs out
Nearby sold comps map
Loading sold comps map…
Walkable amenities ~0.75 mi
Loading nearby amenities…
Taxation est. · year 1
- Rental income
- $26,129
- − Mortgage interest
- −$6,442
- − Property taxes
- −$736
- − Insurance
- −$1,372
- − Repairs & maintenance
- −$2,090
- − Management
- −$2,090
- − HOA
- −$6,348
- − Depreciation
- −$3,345
- Taxable income
- $3,704
- Est. tax owed @ 24.0%
- −$889
- After-tax cash flow
- $4,059/yr
For passive investors: Depreciation is non-cash, so a rental often shows a tax loss while cash-flowing — sheltering income. Rental losses are passive: they offset passive income freely, and up to $25,000/yr can offset ordinary (W-2) income if you actively participate and your MAGI is under $100k (phasing out to $0 by $150k); unused losses carry forward. On sale, claimed depreciation is recaptured at up to 25%, and gains may owe capital-gains tax (a 1031 exchange can defer both). Figures are a year-1 estimate at your 24.0% rate — not tax advice; consult a CPA.
Schools (NCES district)
- District
- District Of Columbia Public Schools
- NCES district ID
- 1100030
- Math proficiency
- 33% ▲ 3.00%
- Reading proficiency
- 40% ▲ 5.00%
- Median HH income
- $67,671
- Composite
- 35.84/100
- National rank
- #9606
- State rank
- #8 of 32 in DC
Livability — Washington
- Score
- 73/100
- State rank
- #1
- US rank
- #5327
Category grades
Schools grade is shown separately in the Schools card above.
Census & demographics
- Census place
- Washington, DC
- County
- District of Columbia · 671,873 people
- City population
- 671,873
- Metro
- Washington-Arlington-Alexandria, DC-VA-MD-WV
- Population (ZIP)
- 53,005
- Household income
- $54,032
- Rent vs Own
- Severe rent burden
- 5148.0
Population outlook (District of Columbia County) Hauer SSP2
- Today (2025)
- 821,926 people
- By 2030
- 899,517 · +9.4%
- By 2040
- 1,061,162 · +29.1%
- By 2050
- 1,231,493 · +49.8%
- By 2075
- 1,603,312 · +95.1%
- By 2100
- 1,847,141 · +124.7%
Race, ethnicity, and origin ACS 2023
- Neighborhood character
- Predominantly Black (90%)
- Race & ethnicity
- Black 90% Two or more races 3% Hispanic / Latino 3% White 3%
- Common ancestry
- Lithuanian 1%
- Foreign-born
- 3% · Canada
- Languages at home
- 95% English-only · Spanish 2% French/Haitian/Cajun 1%
Political lean MEDSL · District of Columbia
- 2024 margin
- Solid D (+86.1) · D 91.2% · R 5.1% · Other 3.8%
- 2008→2024 swing
- +0.1pp no change · 2008: 85.9pp · 2024: 86.1pp
- All cycles
- 2024: D+86.1 2020: D+86.8 2016: D+88.7 2012: D+84.2 2008: D+85.9
Not yet ingested
- Civics
- —
Market trends
- HPI YoY
- ▼ -415.44%
- Current HPI
- 306.5068
- Rent YoY
- ▲ 3.86%
- Metro
- Washington-Arlington-Alexandria, DC-VA-MD-WV
- State GDP YoY
- ▲ 1.33%
- F500 in state
- 6
Industry mix (Fortune 500 HQ in DC)
| Industry | F500 HQs | Revenue |
|---|---|---|
| Financial Services | 1 | $153B |
|
||
| Life Sciences / Industrials | 1 | $25B |
|
||
| Industrial Machinery | 1 | $8B |
|
||
Price history
+476.4% since first listed15 events — show timeline
- 2026-01-16 Listed $115,000 BRIGHT MLS
- 2026-01-12 Coming Soon $115,000 BRIGHT MLS
- 2019-02-01 Listing Removed — BRIGHT MLS
- 2019-01-31 Relisted — BRIGHT MLS
- 2019-01-28 Listing Removed — BRIGHT MLS
- 2019-01-28 Listed $30,000 BRIGHT MLS
- 2014-10-29 Delisted — MRIS
- 2014-10-29 Listing Removed — BRIGHT MLS
- 2014-05-23 Listed — MRIS
- 2014-05-23 Listed $80,000 BRIGHT MLS
- 2014-01-30 Delisted — MRIS
- 2014-01-30 Listing Removed — BRIGHT MLS
- 2014-01-23 Listed — MRIS
- 2014-01-23 Listed $80,000 BRIGHT MLS
- 1976-01-09 Sold (Public Records) $19,950 Public Records
Property tax history
-2.0%/yrLatest (2025): $736 · +1.9% YoY. Source: county tax records.
Cash-flow waterfall
monthlySold comps — $/sqft
last 12 mo · ≤1 miLoading sold comps…