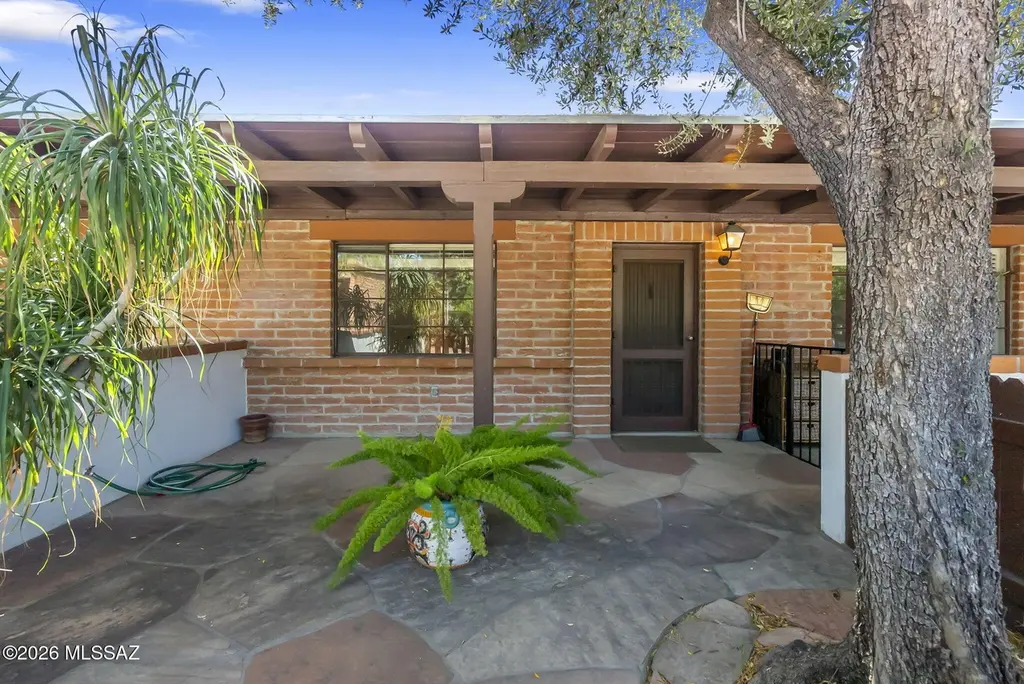
119 S Paseo Tierra · Green Valley, AZ
Flood risk 1/10 · Minimal
- FEMA flood zone
- X (unshaded)
- Chance of flooding over 30 yrs
- 0.0%
- Est. flood insurance / yr
- $507 – $1,088
Fire risk 6/10 · Moderate
- Est. fire insurance / yr
- $610 – $1,132
Heat risk 7/10 · Major
- Hot days now (above 106°F)
- 7 days/yr
- Hot days in 30 yrs
- 19 days/yr
Wind risk 1/10 · Minimal
- Chance of severe wind over 30 yrs
- —
Air-quality risk 1/10 · Minimal
- Unhealthy air days now
- 0 days/yr
- Unhealthy air days in 30 yrs
- 0 days/yr
Risk factors via First Street. Map © Google.
Why this score? — see what drove the B- grade
The composite is a weighted blend of 9 inputs, each scored 0–100. Each bar is that input's sub-score; the figure is the points it added to the 100-point composite (weight × sub-score).
- Cash flow +30.0/30.0
- DSCR +10.0/10.0
- 1% rule +9.4/10.0
- ARV discount +7.5/15.0
- Rent growth +3.9/5.0
- Schools +3.3/10.0
- Livability +3.1/5.0
- Condition / age +2.5/5.0
- Appreciation +0.0/10.0
$97,500
🖨 Deal sheet (PDF) 📄 Offer letter ✓ Due diligence
Listing remarks MLS
SET BACK LOCATION CLOSE TO POOL.
Key facts
- Desert landscape
- Walking paths
- Built 1964
Tags
Neighborhood map
What this means for you Summary
Snapshot
- This is a 1-bed/1.0-bath condo listed at $98k.
Deal economics
- At list price, monthly cash flow is $512 ($6k/yr) — positive.
- The deal already cash-flows at list — no discount required.
- Meets the 1% rule at list price ($1k rent vs $98k).
- Recommended offer: $95k (3.0% below list) — sets the bar for market timing.
- Cap rate 12.6% vs local median 4.5% in Green Valley — top-decile yield for the area; either an underpriced asset or a hidden risk that comps aren't pricing in. Stress-test before assuming the spread holds.
Location & tenants
- Location reads 61/100 on livability (#165 in AZ) — a middle-class / working-renter tenant base. Strengths: cost of living A+, housing A+; Watch: amenities F, commute F, health & safety F.
- Continental Elementary District (4416) (rural): math 35% / reading 42% proficiency, ranked #72 of 249 in AZ (top 29%) — families likely to look elsewhere, expect single-tenant / working-renter base with shorter leases; only 19% free/reduced lunch — higher-income household profile.
- Zoned schools: Continental Elementary School (math 35% / reading 42%, grade F, #418 of 1,109 statewide, top 38%, 639 students, 31% FRL).
- Market conditions: Rents rising fast (+5.6%/yr); 414 active listings in the ZIP; 12 comparable units currently listed for rent nearby; rentals at typical pace (median 19d on market — plan ~3-4 weeks tenant-placement turnaround); 5,268 units permitted in Pima County in 2024 (996 in 5+ unit buildings).
Forward outlook
- Local home prices are declining (-3.0%/yr); year-one equity from $674 of loan paydown is wiped out by about $3k of value loss. Plan a longer hold.
- Pima County population projected at +8% by 2050 — modest demand growth; plan on rents tracking national, not racing it.
- At projected returns (-3.0% appreciation + 5.6% rent growth), your $27k cash investment doubles in ~5 years — after that, you're playing with house money.
Negotiation context
- It's been on market 44 days — a 3% lower offer ($95k) is reasonable based on typical stale-listing flexibility.
Risks & watch-outs
- Climate carrying-cost: major wildfire risk; extreme-heat days projected 7→19/yr by 2055 (HVAC capex compounding) — expect insurance premiums to compound above CPI over the hold.
Questions for the listing agent
- It's been on market 44 days. Have you received any prior offers? Is the seller open to a 3% concession, seller financing, or rate buy-down credit?
- Built in 1964 — when were the roof, HVAC, electrical panel, plumbing, and water heater last replaced?
- Any open or pending special assessments — roof, HVAC, plumbing, elevator, façade? What's the per-unit balance and payoff schedule, and is the seller paying it off at close or rolling it to the buyer?
- Is there a deadline driving the sale (1031 exchange, divorce, estate, relocation)? That informs how much negotiation room exists.
- What's the average days-on-market for RENTAL listings here right now (not sales)? A rising rental-DOM trend means longer vacancies and softer asking-rent achievability than the comps imply.
- What's the recent tenant-quality profile in this submarket — average credit score on applications, eviction rate, late-payment / NSF rate, and stable-employment percentage? A property-management company in the area should have these aggregated.
- How much new apartment / multifamily construction is in the pipeline within 1–3 miles? Heavy new supply (>2% of stock underway) typically softens rents 12–24 months out; light construction supports rent growth.
Investment metrics
- 1% rule
- 1.44% ✓
- Cap rate
- 12.59%
- Cash-on-cash
- 22.50%
- DSCR
- 2.00
- GRM
- 5.8
CMA / ARV
No comps found within radius.
Projected returns pro-forma
-3.0% appreciation · 5.6% rent growth · sell at horizon
- IRR
- 18.0%
- Equity multiple
- 1.75×
- Total profit
- $20,539
- Equity at exit
- $14,538
- IRR
- 28.1%
- Equity multiple
- 3.79×
- Total profit
- $76,044
- Equity at exit
- $8,430
Cash invested: $27,300 (down + closing). Projections, not guarantees.
Landlord ↔ Tenant lean methodology
- Overall (STATE)
- 87 Strongly Landlord-Friendly
- State Arizona
- 87 Strongly Landlord-Friendly · R+3
- County
- — inherits STATE
- City
- — inherits STATE
ZIP-level market 85614
- Rents YoY
- 5.6%
- Active inventory
- 414
- Price-to-rent
- 5.8×
Monthly cashflow live
- Estimated rent
- $1,402 high interval (Pro) →
- Mortgage (P&I)
- −$511
- Tax from tax record
- −$44 /mo · $526/yr
- Insurance
- −$41
- HOA
- −$0
- Lot rent
- −$0
- Vacancy / Maint / Mgmt
- −$294
- Net cashflow
- $512
Break-even live
Sensitivity live
| Price | -10% $567 | -5% $539 | +0% $512 | +5% $484 | +10% $457 |
|---|---|---|---|---|---|
| Rent | -10% $401 | -5% $456 | +0% $512 | +5% $567 | +10% $623 |
| Rate | -1.0pp $561 | -0.5pp $537 | base $512 | +0.5pp $487 | +1.0pp $461 |
UW: 25.0% down · 7.5% · 30yr · 1.5% tax · 5.0% vac · 8.0% maint · 8.0% mgmt
Financing live
Cash to close
- Down payment
- $24,375
- Closing costs
- $2,925
- Reserves months
- —
- Total cash needed
- —
Loan-product check · same deal, 3 products live
Conventional
25% down · 7.5% · 30yr
- Down + closing
- —
- Monthly P&I
- —
- Monthly cashflow
- —
- DSCR
- —
- Eligible?
- —
Personal DTI + credit; lowest rate.
DSCR
20% down · 8.5% · 30yr
- Down + closing
- —
- Monthly P&I
- —
- Monthly cashflow
- —
- DSCR
- —
- Eligible?
- —
No personal income docs; deal must DSCR.
Hard money
10% down · 12.0% · 12mo
- Down + closing
- —
- Monthly P&I
- —
- Monthly cashflow
- —
- DSCR
- —
- Eligible?
- —
Short-term bridge; refi at stabilization.
Rent comps 12 comps
| Address | Beds | Baths | Sqft | Rent | $/sqft | DOM | Units | Dist |
|---|---|---|---|---|---|---|---|---|
| 132 S Paseo Sarta Green Valley, AZ | 1.0 | 1.0 | 588 | $2,000 | $3.40 | 0d | 1 | 0.04mi |
| 174 S Paseo Tierra Green Valley, AZ | 1.0 | 1.0 | 588 | $1,100 | $1.87 | 0d | 1 | 0.09mi |
| 133 S Paseo Pena Green Valley, AZ | 1.0 | 1.0 | 588 | $1,095 | $1.86 | 4d | 1 | 0.16mi |
| 430 S Paseo Pena Green Valley, AZ | 2.0 | 1.0 | 696 | $1,025 | $1.47 | 16d | 1 | 0.35mi |
| 321 S Paseo Madera Unit A Green Valley, AZ | 2.0 | 1.0 | 696 | $1,250 | $1.80 | 26d | 1 | 0.38mi |
| 303 S Paseo Lobo Green Valley, AZ | 2.0 | 1.0 | 696 | $1,000 | $1.44 | 26d | 1 | 0.40mi |
| 262 S Paseo Cerro Green Valley, AZ | 1.0 | 1.0 | 588 | $1,200 | $2.04 | 4d | 1 | 0.42mi |
| 262 S Paseo Cerro Unit B Green Valley, AZ | 1.0 | 1.0 | 588 | $1,200 | $2.04 | 26d | 1 | 0.42mi |
| 466 S Paseo Madera Green Valley, AZ | 2.0 | 1.0 | 696 | $2,300 | $3.30 | 19d | 1 | 0.45mi |
| 466 Paseo Madera Unit A Green Valley, AZ | 2.0 | 1.0 | 696 | $1,100 | $1.58 | 19d | 1 | 0.45mi |
| 478 Paseo Madera Unit B Green Valley, AZ | 1.0 | 1.0 | 588 | $1,250 | $2.13 | 26d | 1 | 0.45mi |
| 90 W Camino Manzana Green Valley, AZ | 1.0 | 1.0 | 588 | $2,000 | $3.40 | 26d | 1 | 0.54mi |
HOA detail condo
- Monthly dues
- $0 · $0/yr
- Likely covers
- pool
- Assessments
- None detected in remarks — confirm with the listing agent.
Listing history 19 events
-
2026-06-13statusdays on market $97,500 Pending 44 DOM
-
2026-06-10days on market $97,500 Active Contingent 41 DOM
-
2026-06-09days on market $97,500 Active Contingent 40 DOM
-
2026-06-08days on market $97,500 Active Contingent 39 DOM
-
2026-06-07days on market $97,500 Active Contingent 38 DOM
-
2026-06-03days on market $97,500 Active Contingent 34 DOM
-
2026-06-02statusdays on market $97,500 Active Contingent 33 DOM
-
2026-06-01days on market $97,500 Active 32 DOM
-
2026-05-31days on market $97,500 Active 31 DOM
-
2026-04-30$102,900 Active
-
2023-04-25soldstatus $100,000
-
2012-03-30soldstatus $33,600 Closed 32-char remark
Show marketing remark (32 chars)
SET BACK LOCATION CLOSE TO POOL.
-
2004-08-25soldstatus $44,500
-
2004-04-13soldstatus $30,000
-
1992-04-27soldstatus $24,500
-
1990-03-01soldstatus $22,000
-
1985-06-01soldstatus $22,900
-
1979-08-01soldstatus $30,500
-
1978-09-01soldstatus $22,650
ⓘ Source: listings_history table (triggers on properties + properties_extension) + one-shot
backfill from property_details.listing_events for pre-trigger history.
Tax reassessment forecast AZ · Resets to sale price
- Current annual tax
- $526 · $44/mo
- Projected year-2 tax
- $644 · $54/mo
- Expected delta
- +$117/yr (+$10/mo · 22.3%)
ⓘ Screening estimate from a state-policy table — verify with the county assessor before closing.
Climate risk First Street
- Flood 1/10 Low FEMA zone X (unshaded) · 0% chance over 30 yrs
- Wildfire 6/10 Major
- Heat 7/10 Severe 7 d/yr ≥106°F today · 19 d/yr by 30 yrs out
- Wind 1/10 Low
- Air quality 1/10 Low 0 unhealthy d/yr today · 0 by 30 yrs out
Nearby sold comps map
Loading sold comps map…
Walkable amenities ~0.75 mi
Loading nearby amenities…
Taxation est. · year 1
- Rental income
- $16,825
- − Mortgage interest
- −$5,462
- − Property taxes
- −$526
- − Insurance
- −$488
- − Repairs & maintenance
- −$1,346
- − Management
- −$1,346
- − Depreciation
- −$2,836
- Taxable income
- $4,822
- Est. tax owed @ 24.0%
- −$1,157
- After-tax cash flow
- $4,985/yr
For passive investors: Depreciation is non-cash, so a rental often shows a tax loss while cash-flowing — sheltering income. Rental losses are passive: they offset passive income freely, and up to $25,000/yr can offset ordinary (W-2) income if you actively participate and your MAGI is under $100k (phasing out to $0 by $150k); unused losses carry forward. On sale, claimed depreciation is recaptured at up to 25%, and gains may owe capital-gains tax (a 1031 exchange can defer both). Figures are a year-1 estimate at your 24.0% rate — not tax advice; consult a CPA.
Schools (NCES district)
- District
- Continental Elementary District (4416)
- NCES district ID
- 0402250
- Math proficiency
- 35% ▼ -11.00%
- Reading proficiency
- 42% ▬ 0.00%
- Median HH income
- $48,475
- Composite
- 33.08/100
- National rank
- #5565
- State rank
- #72 of 249 in AZ
Livability — Green Valley
- Score
- 61/100
- State rank
- #165
- US rank
- #18276
Category grades
Schools grade is shown separately in the Schools card above.
Census & demographics
- Census place
- Green Valley, AZ
- County
- Pima County · 1,012,107 people
- City population
- 25,381
- Metro
- Tucson, AZ
- Population (ZIP)
- 25,381
- Household income
- $64,879
- Rent vs Own
- Severe rent burden
- 860.0
Population outlook (Pima County) Hauer SSP2
- Today (2025)
- 1,066,056 people
- By 2030
- 1,086,684 · +1.9%
- By 2040
- 1,117,160 · +4.8%
- By 2050
- 1,149,778 · +7.9%
- By 2075
- 1,271,480 · +19.3%
- By 2100
- 1,321,160 · +23.9%
Race, ethnicity, and origin ACS 2023
- Neighborhood character
- Predominantly White (80%)
- Race & ethnicity
- White 80% Hispanic / Latino 15% Two or more races 7% Black 2%
- Hispanic origin (detail)
- Mexican 14%
- Common ancestry
- Portuguese 4% Slovak 4% Italian 3%
- Foreign-born
- 8% · Canada, China
- Languages at home
- 87% English-only · Spanish 9% French/Haitian/Cajun 1% German/W. Germanic 0%
Political lean MEDSL · Pima
- 2024 margin
- D (+15.2) · D 57.0% · R 41.8% · Other 1.2%
- 2008→2024 swing
- +9.1pp toward D · 2008: 6.1pp · 2024: 15.2pp
- All cycles
- 2024: D+15.2 2020: D+18.7 2016: D+13.5 2012: D+5.8 2008: D+6.1
Not yet ingested
- Civics
- —
Market trends
- HPI YoY
- ▼ -231.05%
- Current HPI
- 250.5933
- Rent YoY
- ▲ 5.60%
- Metro
- Tucson, AZ
- State GDP YoY
- ▲ 4.54%
- F500 in state
- 20
Industry mix (Fortune 500 HQ in AZ)
| Industry | F500 HQs | Revenue |
|---|---|---|
| Technology | 2 | $13B |
|
||
| Mining / Metals | 1 | $23B |
|
||
| Environmental Services | 1 | $16B |
|
||
| Metals / Steel | 1 | $14B |
|
||
| Technology Distribution | 1 | $9B |
|
||
| Homebuilding | 1 | $8B |
|
||
Price history
+354.3% since first listed10 events — show timeline
- 2026-04-30 Listed $102,900 MLSSAZ
- 2023-04-25 Sold (Public Records) $100,000 Public Records
- 2012-03-30 Sold (MLS) $33,600 MLSSAZ
- 2004-08-25 Sold (Public Records) $44,500 Public Records
- 2004-04-13 Sold (Public Records) $30,000 Public Records
- 1992-04-27 Sold (Public Records) $24,500 Public Records
- 1990-03-01 Sold (Public Records) $22,000 Public Records
- 1985-06-01 Sold (Public Records) $22,900 Public Records
- 1979-08-01 Sold (Public Records) $30,500 Public Records
- 1978-09-01 Sold (Public Records) $22,650 Public Records
Property tax history
+2.2%/yrLatest (2025): $526 · +9.0% YoY. Source: county tax records.
Cash-flow waterfall
monthlySold comps — $/sqft
last 12 mo · ≤1 miLoading sold comps…