10610 Ashville Pike #6 · Lockbourne, OH
Flood risk 1/10 · Minimal
- FEMA flood zone
- X (unshaded)
- Chance of flooding over 30 yrs
- 0.0%
- Est. flood insurance / yr
- $507 – $1,088
Fire risk 1/10 · Minimal
- Est. fire insurance / yr
- $713 – $1,323
Heat risk 4/10 · Minor
- Hot days now (above 100°F)
- 7 days/yr
- Hot days in 30 yrs
- 18 days/yr
Wind risk 2/10 · Minimal
- Chance of severe wind over 30 yrs
- 1.0%
Air-quality risk 3/10 · Minor
- Unhealthy air days now
- 2 days/yr
- Unhealthy air days in 30 yrs
- 4 days/yr
Risk factors via First Street. Map © Google.
Why this score? — see what drove the D+ grade
The composite is a weighted blend of 9 inputs, each scored 0–100. Each bar is that input's sub-score; the figure is the points it added to the 100-point composite (weight × sub-score).
- Cash flow +15.0/30.0
- ARV discount +7.5/15.0
- Schools +5.8/10.0
- 1% rule +5.0/10.0
- DSCR +5.0/10.0
- Livability +2.8/5.0
- Rent growth +2.5/5.0
- Condition / age +2.2/5.0
- Appreciation +0.0/10.0
$34,000
🖨 Deal sheet 📄 Offer letter ✓ Due diligence
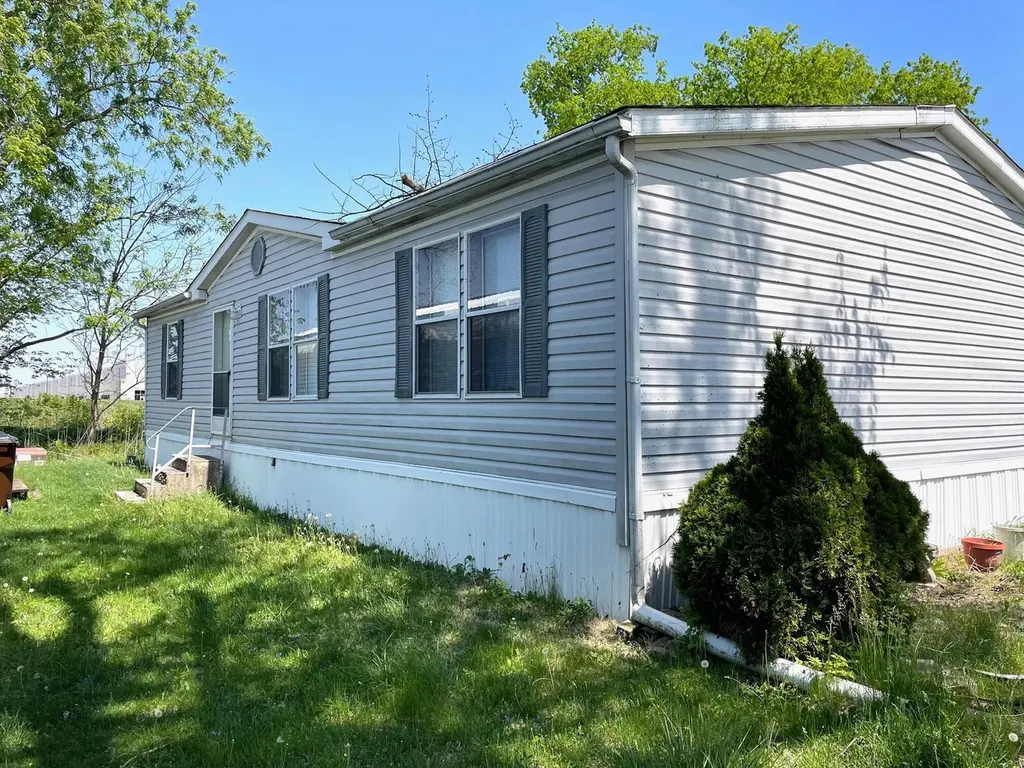
Listing remarks
Home offers 3 bedroom, 2 full baths, Living Room, eat-in Kitchen, laundry room and Master Bedroom with Large walk in closet and full bath. Outside has a covered patio area, small shed and a concrete area for parking. AS IS, home is furnished and cash buyers only. see agent to agent remarks for more details.
Key facts
- Small shed
- Covered patio area
- Built 1999
Tags
Property features AI
Finance
- Other: Located in Buckeye Trails subdivision; Probate listing
Exterior
- Utilities: Public water; Public sewer
- Home design: Single family residence; One story; Built in 1999; No shared/common walls
- Construction: Block foundation; Mobile home dimensions approximately 48' x 28'
- Exterior features: Patio; Shed(s) and outbuilding
Interior
- Bedrooms: Three bedrooms on the main level
- Flooring: Laminate flooring; Carpet; Vinyl flooring
- Bathrooms: Two full bathrooms
- Heating & cooling: Central air conditioning; Forced air heating with propane
- Interior features: Open living area (reported 1344); No fireplaces
Neighborhood map
What this means for you Summary
Snapshot
- This is a 3-bed/2.0-bath single-family listed at $34k. Condition is rated fair.
Deal economics
- At list price, monthly cash flow is $1k ($13k/yr) — positive.
- The deal already cash-flows at list — no discount required.
- Meets the 1% rule at list price ($2k rent vs $34k).
- Recommended offer: $33k (1.5% below list) — sets the bar for market timing.
Location & tenants
- Location reads 55/100 on livability (#1,132 in OH) — a working-class tenant base; expect higher turnover. Strengths: cost of living A+, housing B+; Watch: crime D+, employment D, schools F.
- Teays Valley Local (town): math 66% / reading 68% proficiency, ranked #166 of 656 in OH (top 25%) — acceptable for families but not a draw, mixed tenant base, ~2y average lease.
- Market conditions: 34 active listings in the ZIP; 4 comparable units currently listed for rent nearby; rentals at typical pace (median 20d on market — plan ~3-4 weeks tenant-placement turnaround); 312 units permitted in Pickaway County in 2024 (0 in 5+ unit buildings).
- This rent runs 40% of the median local income ($49k/yr) — at the standard rent-burdened threshold; future hikes will face affordability resistance.
Forward outlook
- Local home prices are declining (-3.0%/yr); year-one equity from $235 of loan paydown is wiped out by about $1k of value loss. Plan a longer hold.
- Pickaway County population projected at +3% by 2050 — modest demand growth; plan on rents tracking national, not racing it.
- At projected returns (-3.0% appreciation + 3.0% rent growth), your $10k cash investment doubles in ~1 year — after that, you're playing with house money.
Negotiation context
- It's been on market 27 days — a 2% lower offer ($33k) is reasonable based on typical stale-listing flexibility.
Questions for the listing agent
- Have any recent inspections been done? Can we get a copy of the seller's disclosures and any deferred-maintenance estimates?
- Is there a deadline driving the sale (1031 exchange, divorce, estate, relocation)? That informs how much negotiation room exists.
- Schools are F-rated, which usually means shorter tenancies and higher turnover. Who's the typical renter profile here, and what's been the actual vacancy rate?
- Crime grade is D in this area — have there been break-ins, vandalism, or insurance claims at this property in the last 3 years? What carrier currently insures it and at what premium?
- The area grade is low — what's the realistic commute time and amenity access for the typical tenant pool here? Any planned neighborhood developments (good or bad) we should know about?
- What's the average days-on-market for RENTAL listings here right now (not sales)? A rising rental-DOM trend means longer vacancies and softer asking-rent achievability than the comps imply.
- What's the recent tenant-quality profile in this submarket — average credit score on applications, eviction rate, late-payment / NSF rate, and stable-employment percentage? A property-management company in the area should have these aggregated.
- How much new for-sale + rental construction is in the pipeline within 1–3 miles? Heavy new supply typically softens prices + rents 12–24 months out; constrained supply supports both.
Investment metrics
- 1% rule
- 4.83% ✓
- Cap rate
- 43.78%
- Cash-on-cash
- 133.86%
- DSCR
- 6.96
- GRM
- 1.7
CMA / ARV
- ARV (median comp)
- $198,591
- List price
- $34,000
- Delta
- -82.88%
- Verdict
- UNDERPRICED
- Comps
- 14 within 1.0 mi
Show comp detail 3 sales within ~0.75 mi
| Address | Dist | Beds/Ba | Sqft | Sold | Price | $/sf | Match |
|---|---|---|---|---|---|---|---|
| 10610 E St Rt 762 Lot 82B | 0.06mi | 3/2.0 | 1,352 (+1%) | 4mo | $75,000 | $55 | 93 |
| 10610 E State Route 762 Lot 72 | 0.23mi | 3/2.0 | 1,470 (+9%) | 4mo | $60,000 | $41 | 70 |
| 10694 East State Route 762 #94 | 0.10mi | 3/2.0 | 1,526 (+14%) | 22mo | $80,000 | $52 | 54 |
Match score weights: distance 35% · size 25% · config 20% · recency 20%. Top-matched comps best support the ARV.
Projected returns pro-forma
-3.0% appreciation · 3.0% rent growth · sell at horizon
- IRR
- —
- Equity multiple
- 7.53×
- Total profit
- $62,154
- Equity at exit
- $5,070
- IRR
- —
- Equity multiple
- 15.84×
- Total profit
- $141,319
- Equity at exit
- $2,940
Cash invested: $9,520 (down + closing). Projections, not guarantees.
Landlord ↔ Tenant lean methodology
- Overall (STATE)
- 73 Landlord-Friendly
- State Ohio
- 73 Landlord-Friendly · R+6
- County
- — inherits STATE
- City
- — inherits STATE
ZIP-level market 43137
- Home prices YoY
- -23.2%
- Active inventory
- 34
- Price-to-rent
- 1.7×
Monthly cashflow live
- Estimated rent
- $1,642 medium interval (Pro) →
- Mortgage (P&I)
- −$178
- Tax est. 1.5%
- −$42 /mo · $510/yr
- Insurance
- −$14
- HOA
- −$0
- Vacancy / Maint / Mgmt
- −$345
- Net cashflow
- $1,062
Break-even live
UW: 25.0% down · 7.5% · 30yr · 1.5% tax · 5.0% vac · 8.0% maint · 8.0% mgmt
Financing live
Cash to close
- Down payment
- $8,500
- Closing costs
- $1,020
- Reserves months
- —
- Total cash needed
- —
Loan-product check · same deal, 3 products live
Conventional
25% down · 7.5% · 30yr
- Down + closing
- —
- Monthly P&I
- —
- Monthly cashflow
- —
- DSCR
- —
- Eligible?
- —
Personal DTI + credit; lowest rate.
DSCR
20% down · 8.5% · 30yr
- Down + closing
- —
- Monthly P&I
- —
- Monthly cashflow
- —
- DSCR
- —
- Eligible?
- —
No personal income docs; deal must DSCR.
Hard money
10% down · 12.0% · 12mo
- Down + closing
- —
- Monthly P&I
- —
- Monthly cashflow
- —
- DSCR
- —
- Eligible?
- —
Short-term bridge; refi at stabilization.
Rent comps 4 comps
| Address | Beds | Baths | Sqft | Rent | $/sqft | DOM | Units | Dist |
|---|---|---|---|---|---|---|---|---|
| 10610 State Route 762 Unit 109B Lockbourne, OH | 3.0 | 2.0 | 1056 | $1,399 | $1.32 | 10d | 1 | 0.08mi |
| 10610 State Route 762 Unit 165B Lockbourne, OH | 3.0 | 2.0 | 1152 | $1,399 | $1.21 | 43d | 1 | 0.08mi |
| 10694 State Route 762 Unit 24M Lockbourne, OH | 2.0 | 2.0 | 960 | $1,299 | $1.35 | 20d | 1 | 0.14mi |
| 2802 W Old Duvall Ct Lockbourne, OH | 3.0 | 1.5 | 1600 | $1,650 | $1.03 | 1d | 1 | 1.03mi |
Listing history 1 events
-
2026-04-24$34,000 Active 308-char remark
ⓘ Source: listings_history table (triggers on properties + properties_extension) + one-shot
backfill from property_details.listing_events for pre-trigger history.
Climate risk First Street
- Flood 1/10 Low FEMA zone X (unshaded) · 0% chance over 30 yrs
- Wildfire 1/10 Low
- Heat 4/10 Moderate 7 d/yr ≥100°F today · 18 d/yr by 30 yrs out
- Wind 2/10 Low 100% chance of damaging wind over 30 yrs
- Air quality 3/10 Moderate 2 unhealthy d/yr today · 4 by 30 yrs out
Nearby sold comps map
Loading sold comps map…
Walkable amenities ~0.75 mi
Loading nearby amenities…
Taxation est. · year 1
- Rental income
- $19,701
- − Mortgage interest
- −$1,905
- − Property taxes
- −$510
- − Insurance
- −$170
- − Repairs & maintenance
- −$1,576
- − Management
- −$1,576
- − Depreciation
- −$989
- Taxable income
- $12,975
- Est. tax owed @ 24.0%
- −$3,114
- After-tax cash flow
- $9,630/yr
For passive investors: Depreciation is non-cash, so a rental often shows a tax loss while cash-flowing — sheltering income. Rental losses are passive: they offset passive income freely, and up to $25,000/yr can offset ordinary (W-2) income if you actively participate and your MAGI is under $100k (phasing out to $0 by $150k); unused losses carry forward. On sale, claimed depreciation is recaptured at up to 25%, and gains may owe capital-gains tax (a 1031 exchange can defer both). Figures are a year-1 estimate at your 24.0% rate — not tax advice; consult a CPA.
Condition & rehab AI · 12 photos
This home requires significant repairs and updates to improve its condition and increase its resale or rental value.
Repairs flagged
- Major siding — Significant wear and tear
- Major exterior walls — Overgrown vegetation
- Major interior walls — Worn wallpaper
- Major flooring — Worn carpet, outdated tile
- Major kitchen cabinets — Outdated cabinets
- Major kitchen appliances — Appliances in need of replacement
- Major bathroom fixtures — Outdated fixtures
- Major bathroom tile — Need for tile replacement
Value-add opportunities
- Resale Paint exterior walls — Enhances curb appeal
- Resale Replace worn carpet — Improves living space aesthetics
- Resale Upgrade kitchen cabinets — Modernizes kitchen space
- Resale Replace outdated kitchen appliances — Modernizes kitchen space
- Resale Upgrade bathroom fixtures — Modernizes bathroom space
- Resale Replace outdated bathroom tile — Modernizes bathroom space
- Resale Paint interior walls — Enhances living space aesthetics
- Resale Replace worn wallpaper — Modernizes interior space
- Resale Trim overgrown vegetation — Enhances curb appeal
Renovation cost estimate screening
| Repair item | Severity | Est. cost |
|---|---|---|
| siding · Significant wear and tear | Major | $15,000–50,000 |
| exterior walls · Overgrown vegetation | Major | $15,000–50,000 |
| interior walls · Worn wallpaper | Major | $15,000–50,000 |
| flooring · Worn carpet, outdated tile | Major | $15,000–50,000 |
| kitchen cabinets · Outdated cabinets | Major | $15,000–50,000 |
| kitchen appliances · Appliances in need of replacement | Major | $15,000–50,000 |
| bathroom fixtures · Outdated fixtures | Major | $15,000–50,000 |
| bathroom tile · Need for tile replacement | Major | $15,000–50,000 |
| Total estimated repair cost · 8 items | $120,000–400,000 |
Value-add ROI direction
- Resale Paint exterior walls — Enhances curb appeal ↑
- Resale Replace worn carpet — Improves living space aesthetics ↑
- Resale Upgrade kitchen cabinets — Modernizes kitchen space ↑
- Resale Replace outdated kitchen appliances — Modernizes kitchen space ↑
- Resale Upgrade bathroom fixtures — Modernizes bathroom space ↑
- Resale Replace outdated bathroom tile — Modernizes bathroom space ↑
- Resale Paint interior walls — Enhances living space aesthetics ↑
- Resale Replace worn wallpaper — Modernizes interior space ↑
- Resale Trim overgrown vegetation — Enhances curb appeal ↑
ⓘ Cost ranges are severity-bucket heuristics (US national rule-of-thumb). Get contractor quotes + a written scope before underwriting a rehab budget.
Schools (NCES district)
- District
- Teays Valley Local
- NCES district ID
- 3904909
- Math proficiency
- 66% ▼ -12.00%
- Reading proficiency
- 68% ▼ -10.00%
- Median HH income
- $64,637
- Composite
- 58.28/100
- National rank
- #1019
- State rank
- #166 of 656 in OH
Livability — Lockbourne
- Score
- 55/100
- State rank
- #1132
- US rank
- #23482
Category grades
Schools grade is shown separately in the Schools card above.
Census & demographics
- County
- Franklin County · 1,351,780 people
- City population
- 2,415
- Metro
- Columbus, OH
- Population (ZIP)
- 2,415
- Household income
- $49,145
- Rent vs Own
- Severe rent burden
- 13.0
Population outlook (Pickaway County) Hauer SSP2
- Today (2025)
- 59,488 people
- By 2030
- 60,400 · +1.5%
- By 2040
- 61,498 · +3.4%
- By 2050
- 61,478 · +3.3%
- By 2075
- 59,696 · +0.3%
- By 2100
- 51,458 · -13.5%
Race, ethnicity, and origin ACS 2023
- Neighborhood character
- Predominantly White (80%)
- Race & ethnicity
- White 80% Two or more races 9% Black 8% Hispanic / Latino 5%
- Hispanic origin (detail)
- Mexican 3% Puerto Rican 2%
- Common ancestry
- Iranian 6% Slovak 2% Romanian 2%
- Foreign-born
- 0%
- Languages at home
- 97% English-only · Spanish 3%
Political lean MEDSL · Pickaway
- 2024 margin
- Solid R (+48.5) · D 25.3% · R 73.8%
- 2008→2024 swing
- -26.8pp toward R · 2008: -21.7pp · 2024: -48.5pp
- All cycles
- 2024: R+48.5 2020: R+47.0 2016: R+42.6 2012: R+18.7 2008: R+21.7
Not yet ingested
- Civics
- —
Market trends
- HPI YoY
- ▼ -67.80%
- Current HPI
- 224.2066
- Rent YoY
- —
- Metro
- Columbus, OH
- State GDP YoY
- ▲ 1.98%
- F500 in state
- 48
Industry mix (Fortune 500 HQ in OH)
| Industry | F500 HQs | Revenue |
|---|---|---|
| Insurance | 3 | $145B |
|
||
| Industrial Machinery | 3 | $49B |
|
||
| Financial Services | 3 | $24B |
|
||
| Consumer Goods | 2 | $93B |
|
||
| Aerospace / Defense | 2 | $47B |
|
||
| Utilities | 2 | $33B |
|
||
Price history
2 events — show timeline
- 2026-05-21 Pending — CBRMLS
- 2026-04-24 Listed $34,000 CBRMLS
Cash-flow waterfall
monthlySold comps — $/sqft
last 12 mo · ≤1 miLoading sold comps…