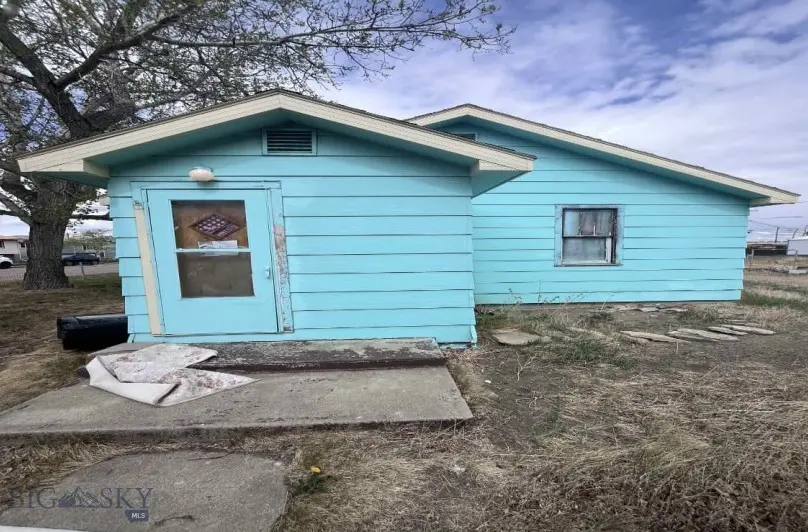
213 5th Ave NE · Cut Bank, MT
Flood risk 1/10 · Minimal
- FEMA flood zone
- —
- Chance of flooding over 30 yrs
- 0.0%
- Est. flood insurance / yr
- —
Fire risk 6/10 · Moderate
- Est. fire insurance / yr
- $918 – $1,706
Heat risk 1/10 · Minimal
- Hot days now (above 88°F)
- 6 days/yr
- Hot days in 30 yrs
- 12 days/yr
Wind risk 1/10 · Minimal
- Chance of severe wind over 30 yrs
- —
Air-quality risk 6/10 · Moderate
- Unhealthy air days now
- 12 days/yr
- Unhealthy air days in 30 yrs
- 12 days/yr
Risk factors via First Street. Map © Google.
Why this score? — see what drove the B- grade
The composite is a weighted blend of 9 inputs, each scored 0–100. Each bar is that input's sub-score; the figure is the points it added to the 100-point composite (weight × sub-score).
- Cash flow +30.0/30.0
- 1% rule +10.0/10.0
- DSCR +10.0/10.0
- ARV discount +7.5/15.0
- Livability +3.5/5.0
- Rent growth +2.5/5.0
- Condition / age +2.5/5.0
- Schools +1.7/10.0
- Appreciation +0.0/10.0
$49,500
🖨 Deal sheet (PDF) 📄 Offer letter ✓ Due diligence
Key facts
- 0.32 acre lot
- 2 garage spots
- Built 1930
Property features AI
Exterior
- Parking: Attached garage with 2 spaces
- Utilities: No utilities listed
- Home design: Single-family residence; One-story home
- Exterior features: Lot in an R1 zoned subdivision (Minor Subdivision); Lot approximately 0.321 acres
Interior
- Bathrooms: 1 full bathroom
- Interior features: Central air conditioning; Forced air heating
Neighborhood map
What this means for you Summary
Snapshot
- This is a 3-bed/1.0-bath single-family listed at $50k.
Deal economics
- At list price, monthly cash flow is $500 ($6k/yr) — positive.
- The deal already cash-flows at list — no discount required.
- Meets the 1% rule at list price ($1k rent vs $50k).
- Recommended offer: $49k (1.5% below list) — sets the bar for market timing.
- Cap rate 18.4% vs local median 5.0% in Cut Bank — top-decile yield for the area; either an underpriced asset or a hidden risk that comps aren't pricing in. Stress-test before assuming the spread holds.
Location & tenants
- Location reads 70/100 on livability (#81 in MT) — a middle-class / working-renter tenant base. Strengths: cost of living A+, health & safety A+, housing B; Watch: commute C-, employment D+, crime F.
- Cut Bank H S (town): math 11% / reading 20% proficiency, ranked #268 of 339 in MT (top 79%) — low school quality limits family demand, transient renter base, plan for 1-2y turnover.
- Zoned schools: Cut Bank Middle School (math 17% / reading 27%, grade F, #124 of 146 statewide, top 86%, 173 students, 0% FRL); Cut Bank High School (math 15% / reading 24%, grade F, #117 of 132 statewide, top 89%, 227 students, 0% FRL).
- Market conditions: 36 active listings in the ZIP.
Forward outlook
- Local home prices are declining (-3.0%/yr); year-one equity from $342 of loan paydown is wiped out by about $1k of value loss. Plan a longer hold.
- At projected returns (-3.0% appreciation + 3.0% rent growth), your $14k cash investment doubles in ~3 years — after that, you're playing with house money.
Negotiation context
- It's been on market 18 days — a 2% lower offer ($49k) is reasonable based on typical stale-listing flexibility.
Risks & watch-outs
- Watch-outs: built in 1930 — expect roof / HVAC / electrical / plumbing capex.
- Climate carrying-cost: major wildfire risk — expect insurance premiums to compound above CPI over the hold.
Questions for the listing agent
- Built in 1930 — when were the roof, HVAC, electrical panel, plumbing, and water heater last replaced?
- Is there a deadline driving the sale (1031 exchange, divorce, estate, relocation)? That informs how much negotiation room exists.
- Crime grade is F in this area — have there been break-ins, vandalism, or insurance claims at this property in the last 3 years? What carrier currently insures it and at what premium?
- What's the average days-on-market for RENTAL listings here right now (not sales)? A rising rental-DOM trend means longer vacancies and softer asking-rent achievability than the comps imply.
- What's the recent tenant-quality profile in this submarket — average credit score on applications, eviction rate, late-payment / NSF rate, and stable-employment percentage? A property-management company in the area should have these aggregated.
- How much new for-sale + rental construction is in the pipeline within 1–3 miles? Heavy new supply typically softens prices + rents 12–24 months out; constrained supply supports both.
Investment metrics
- 1% rule
- 2.18% ✓
- Cap rate
- 18.43%
- Cash-on-cash
- 43.33%
- DSCR
- 2.93
- GRM
- 3.8
CMA / ARV
- ARV (on-the-fly)
- $116,736
- Comps found
- 3
Show comp detail 3 sales within ~0.75 mi
| Address | Dist | Beds/Ba | Sqft | Sold | Price | $/sf | Match |
|---|---|---|---|---|---|---|---|
| 121 8th Ave SE | 0.51mi | 3/1.5 | 1,008 (+10%) | 11mo | $128,500 | $127 | 48 |
| 302 3rd St SE | 0.65mi | 2/1.0 (-1) | 960 (+5%) | 12mo | $122,750 | $128 | 46 |
| 109 10th Ave SE | 0.55mi | 2/1.0 (-1) | 856 (-6%) | 16mo | $119,000 | $139 | 46 |
Match score weights: distance 35% · size 25% · config 20% · recency 20%. Top-matched comps best support the ARV.
Projected returns pro-forma
-3.0% appreciation · 3.0% rent growth · sell at horizon
- IRR
- 40.2%
- Equity multiple
- 2.72×
- Total profit
- $23,876
- Equity at exit
- $7,381
- IRR
- 46.5%
- Equity multiple
- 5.47×
- Total profit
- $61,923
- Equity at exit
- $4,280
Cash invested: $13,860 (down + closing). Projections, not guarantees.
Landlord ↔ Tenant lean methodology
- Overall (STATE)
- 82 Strongly Landlord-Friendly
- State Montana
- 82 Strongly Landlord-Friendly · R+11
- County
- — inherits STATE
- City
- — inherits STATE
ZIP-level market 59427
- Home prices YoY
- -35.0%
- Active inventory
- 36
- Price-to-rent
- 3.8×
Monthly cashflow live
- Estimated rent
- $1,078 medium interval (Pro) →
- Mortgage (P&I)
- −$260
- Tax from tax record
- −$71 /mo · $849/yr
- Insurance
- −$21
- HOA
- −$0
- Lot rent
- −$0
- Vacancy / Maint / Mgmt
- −$226
- Net cashflow
- $500
Break-even live
Sensitivity live
| Price | -10% $528 | -5% $514 | +0% $500 | +5% $486 | +10% $472 |
|---|---|---|---|---|---|
| Rent | -10% $415 | -5% $458 | +0% $500 | +5% $543 | +10% $586 |
| Rate | -1.0pp $525 | -0.5pp $513 | base $500 | +0.5pp $488 | +1.0pp $475 |
UW: 25.0% down · 7.5% · 30yr · 1.5% tax · 5.0% vac · 8.0% maint · 8.0% mgmt
Financing live
Cash to close
- Down payment
- $12,375
- Closing costs
- $1,485
- Reserves months
- —
- Total cash needed
- —
Loan-product check · same deal, 3 products live
Conventional
25% down · 7.5% · 30yr
- Down + closing
- —
- Monthly P&I
- —
- Monthly cashflow
- —
- DSCR
- —
- Eligible?
- —
Personal DTI + credit; lowest rate.
DSCR
20% down · 8.5% · 30yr
- Down + closing
- —
- Monthly P&I
- —
- Monthly cashflow
- —
- DSCR
- —
- Eligible?
- —
No personal income docs; deal must DSCR.
Hard money
10% down · 12.0% · 12mo
- Down + closing
- —
- Monthly P&I
- —
- Monthly cashflow
- —
- DSCR
- —
- Eligible?
- —
Short-term bridge; refi at stabilization.
Listing history 13 events
-
2026-06-22days on market $49,500 Active 18 DOM
-
2026-06-21days on market $49,500 Active 17 DOM
-
2026-06-21days on market $49,500 Active 16 DOM
-
2026-06-18days on market $49,500 Active 14 DOM
-
2026-06-17days on market $49,500 Active 13 DOM
-
2026-06-16days on market $49,500 Active 12 DOM
-
2026-06-15days on market $49,500 Active 11 DOM
-
2026-06-13days on market $49,500 Active 9 DOM
-
2026-06-12days on market $49,500 Active 8 DOM
-
2026-06-09days on market $49,500 Active 5 DOM
-
2026-06-08days on market $49,500 Active 4 DOM
-
2026-06-07days on market $49,500 Active 3 DOM
-
2026-06-05$49,500 Active 1 DOM
ⓘ Source: listings_history table (triggers on properties + properties_extension) + one-shot
backfill from property_details.listing_events for pre-trigger history.
Tax reassessment forecast MT · Resets to sale price
- Current annual tax
- $849 · $71/mo
- Projected year-2 tax
- $849 · $71/mo
- Expected delta
- $0/yr ($0/mo · 0.0%)
ⓘ Screening estimate from a state-policy table — verify with the county assessor before closing.
Climate risk First Street
- Flood 1/10 Low 0% chance over 30 yrs
- Wildfire 6/10 Major
- Heat 1/10 Low 6 d/yr ≥88°F today · 12 d/yr by 30 yrs out
- Wind 1/10 Low
- Air quality 6/10 Major 12 unhealthy d/yr today · 12 by 30 yrs out
Nearby sold comps map
Loading sold comps map…
Walkable amenities ~0.75 mi
Loading nearby amenities…
Taxation est. · year 1
- Rental income
- $12,933
- − Mortgage interest
- −$2,773
- − Property taxes
- −$849
- − Insurance
- −$248
- − Repairs & maintenance
- −$1,035
- − Management
- −$1,035
- − Depreciation
- −$1,440
- Taxable income
- $5,555
- Est. tax owed @ 24.0%
- −$1,333
- After-tax cash flow
- $4,673/yr
For passive investors: Depreciation is non-cash, so a rental often shows a tax loss while cash-flowing — sheltering income. Rental losses are passive: they offset passive income freely, and up to $25,000/yr can offset ordinary (W-2) income if you actively participate and your MAGI is under $100k (phasing out to $0 by $150k); unused losses carry forward. On sale, claimed depreciation is recaptured at up to 25%, and gains may owe capital-gains tax (a 1031 exchange can defer both). Figures are a year-1 estimate at your 24.0% rate — not tax advice; consult a CPA.
Schools (NCES district)
- District
- Cut Bank H S
- NCES district ID
- 3008190
- Math proficiency
- 11% ▼ -19.00%
- Reading proficiency
- 20% ▼ -10.00%
- Median HH income
- $41,470
- Composite
- 16.78/100
- National rank
- #14223
- State rank
- #268 of 339 in MT
Livability — Cut Bank
- Score
- 70/100
- State rank
- #81
- US rank
- #8053
Category grades
Schools grade is shown separately in the Schools card above.
Census & demographics
- Census place
- Cut Bank, MT
- Population (ZIP)
- 4,955
Population outlook (Glacier County) Hauer SSP2
- Today (2025)
- 13,805 people
- By 2030
- 13,789 · -0.1%
- By 2040
- 13,635 · -1.2%
- By 2050
- 13,417 · -2.8%
- By 2075
- 13,107 · -5.1%
- By 2100
- 12,567 · -9.0%
Race, ethnicity, and origin ACS 2023
- Neighborhood character
- Diverse neighborhood (Simpson 0.57)
- Race & ethnicity
- White 65% Native American 23% Two or more races 7% Hispanic / Latino 4%
- Common ancestry
- Portuguese 10% Serbian 2% Scotch-Irish 2%
- Foreign-born
- 1% · Canada
- Languages at home
- 88% English-only · German/W. Germanic 7% Spanish 1% French/Haitian/Cajun 1%
Political lean MEDSL · Glacier
- 2024 margin
- D (+19.6) · D 57.8% · R 38.2% · Other 4.1%
- 2008→2024 swing
- -20.1pp toward R · 2008: 39.7pp · 2024: 19.6pp
- All cycles
- 2024: D+19.6 2020: D+30.6 2016: D+29.7 2012: D+32.5 2008: D+39.7
Not yet ingested
- Civics
- —
Market trends
- HPI YoY
- ▼ -87.39%
- Current HPI
- 162.3013
- Rent YoY
- —
- Metro
- —
- State GDP YoY
- ▲ 3.41%
- F500 in state
- 2
Industry mix (Fortune 500 HQ in MT)
| Industry | F500 HQs | Revenue |
|---|---|---|
| Technology / Analytics | 1 | $2B |
|
||
Price history
3 events — show timeline
- 2026-06-04 Listed $49,500 BSCMLS
- 2003-08-05 Sold (Public Records) — Public Records
- 1996-11-29 Sold (Public Records) — Public Records
Property tax history
+2.1%/yrLatest (2024): $849 · -0.2% YoY. Source: county tax records.
Cash-flow waterfall
monthlySold comps — $/sqft
last 12 mo · ≤1 miLoading sold comps…