 🌊 Lakefront
None · Hallandale Beach, FL
Flood risk 9/10 · Severe
- FEMA flood zone
- AE
- Chance of flooding over 30 yrs
- 0.99%
- Est. flood insurance / yr
- $1,737 – $8,500
Fire risk 1/10 · Minimal
- Est. fire insurance / yr
- $947 – $1,759
Heat risk 10/10 · Severe
- Hot days now (above 104°F)
- 6 days/yr
- Hot days in 30 yrs
- 20 days/yr
Wind risk 10/10 · Severe
- Chance of severe wind over 30 yrs
- 99.0%
Air-quality risk 2/10 · Minimal
- Unhealthy air days now
- 1 days/yr
- Unhealthy air days in 30 yrs
- 2 days/yr
Risk factors via First Street. Map © Google.
Why this score? — see what drove the B- grade
The composite is a weighted blend of 9 inputs, each scored 0–100. Each bar is that input's sub-score; the figure is the points it added to the 100-point composite (weight × sub-score).
- Cash flow +30.0/30.0
- DSCR +10.0/10.0
- 1% rule +7.8/10.0
- ARV discount +7.5/15.0
- Schools +4.1/10.0
- Livability +4.0/5.0
- Rent growth +2.6/5.0
- Condition / age +2.5/5.0
- Appreciation +0.0/10.0
$215,000
🖨 Deal sheet (PDF) 📄 Offer letter ✓ Due diligence
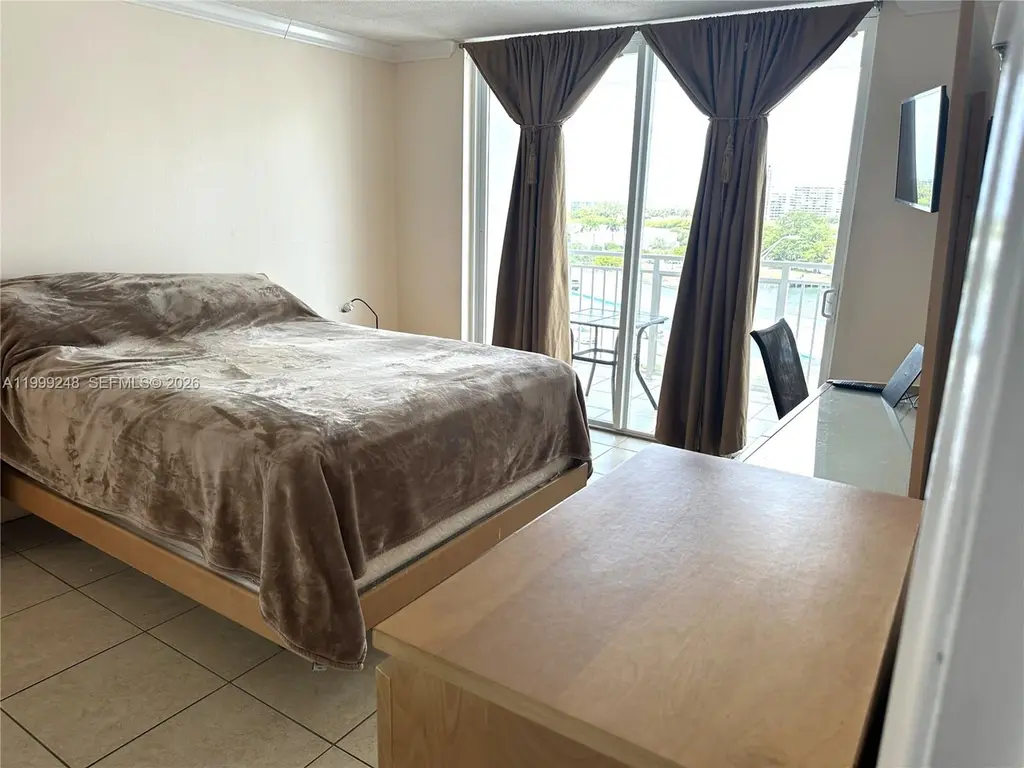
Listing remarks
Large 1 bedroom. 1.5 bathroom. Condo is situated across the street from the ocean on the Intercoastal waterway. Large Balcony with Intercoastal view. New panoramic impact windows. The condo fee includes fiber optic internet, pool, sauna, gym, clubhouse, billiard, barbecue area, salon, retail stores and bicycle storage for your convenience. NO Assessments! Building passed 40 yr recertification. Assigned parking. Walking distance to the ocean, stores and restaurants
Key facts
- Bicycle storage
- Intercoastal view
- $1 HOA
Tags
Property features AI
Finance
- Other: Heated pool; Waterfront with Intracoastal access
- Financial info: Pets allowed with restrictions
- HOA & community: Monthly association fee (includes laundry, parking, pest control, pool(s), recreation facilities); Association amenities: billiard room, bike storage, clubhouse, community kitchen, fitness center, laundry, pool, sauna, storage, vehicle wash area, elevators
Exterior
- Parking: Guest parking; One assigned parking space
- Security: Closed-circuit cameras; Complex fenced; Intercom; Key card entry; Fire sprinkler system; Smoke detectors
- Utilities: Cable available
- Home design: Condominium (attached property); 11-story building; Entry on level 8; Effective year built
- Construction: Block construction
- Exterior features: Balcony; Open balcony/patio
Interior
- Kitchen: Dishwasher; Electric range; Refrigerator
- Flooring: Ceramic tile
- Bathrooms: 1 full bathroom; 1 half bathroom
- Heating & cooling: Central heating; Central air conditioning
- Interior features: Accessible elevator installed; Elevator; Walk-in closet(s); Other interior features
- Laundry & utility: Common area laundry; Electric water heater; Utility room; Laundry room
Neighborhood map
What this means for you Summary
Snapshot
- This is a 1-bed/2.0-bath condo listed at $215k.
Deal economics
- At list price, monthly cash flow is $468 ($6k/yr) — positive.
- The deal already cash-flows at list — no discount required.
- Meets the 1% rule at list price ($3k rent vs $215k).
- Recommended offer: $202k (6.0% below list) — sets the bar for market timing.
- Cap rate 11.3% vs local median 5.2% in Hallandale Beach — top-decile yield for the area; either an underpriced asset or a hidden risk that comps aren't pricing in. Stress-test before assuming the spread holds.
Location & tenants
- Location reads 81/100 on livability (#86 in FL, #1,400 nationally) — a professional / high-income tenant draw. Strengths: commute A+, health & safety A+, crime B+; Watch: employment D-.
- Broward (suburban): math 42% / reading 53% proficiency, ranked #46 of 73 in FL (top 63%) — families likely to look elsewhere, expect single-tenant / working-renter base with shorter leases.
- Zoned schools: Gulfstream Academy of Hallandale Beach (math 32% / reading 40%, grade F, #1,670 of 2,144 statewide, top 78%, 1,317 students, 73% FRL); Nova Middle School (math 44% / reading 53%, grade C-, #274 of 571 statewide, top 50%, 1,284 students, 68% FRL); Nova High School (math 22% / reading 56%, grade F, #312 of 667 statewide, top 48%, 2,227 students, 59% FRL) — zoned schools average 67% FRL vs 51% district-wide (16 pts higher); higher-poverty schools than district average — tighter screening recommended.
- Market conditions: Rents flat; 1380 active listings in the ZIP; 8 comparable units currently listed for rent nearby; rentals leasing fast (median 12d on market — plan ~1-2 weeks tenant-placement turnaround); 2,111 units permitted in Broward County in 2024 (1,265 in 5+ unit buildings).
- At $2,761/mo this rent would consume 64% of the median local household income ($52k/yr) (locally 3293% of renters already pay >50% of income on rent) — very limited rent-growth headroom before tenants either downsize or default.
Forward outlook
- Local home prices are declining (-3.0%/yr); year-one equity from $1k of loan paydown is wiped out by about $6k of value loss. Plan a longer hold.
- Broward County population projected at +34% by 2050 — long-run rental-demand tailwind backs the buy-and-hold thesis.
Negotiation context
- It's been on market 71 days — a 6% lower offer ($202k) is reasonable based on typical stale-listing flexibility.
- 4 sale attempts; this cycle's ask has dropped $14k (6%) from the opening price — seller is motivated, your offer sets the floor, not the list.
- Current owner paid $65k; list at $215k implies a 231% gain — meaningful room to come down on a strong offer.
Risks & watch-outs
- Watch-outs: flood insurance adds $427/mo.
- Climate carrying-cost: in FEMA flood zone AE (mandatory federal flood insurance); severe wind risk, 99% chance of damaging wind over 30y; extreme-heat days projected 6→20/yr by 2055 (HVAC capex compounding) — expect insurance premiums to compound above CPI over the hold.
Questions for the listing agent
- It's been on market 71 days. Have you received any prior offers? Is the seller open to a 6% concession, seller financing, or rate buy-down credit?
- Built in 1970 — when were the roof, HVAC, electrical panel, plumbing, and water heater last replaced?
- What's the actual annual flood-insurance premium (NFIP or private), and is the property in a SFHA with mandatory coverage?
- What does the HOA fee cover, when was the last increase, and are there any pending special assessments or reserve-fund shortfalls?
- Any open or pending special assessments — roof, HVAC, plumbing, elevator, façade? What's the per-unit balance and payoff schedule, and is the seller paying it off at close or rolling it to the buyer?
- Why hasn't it sold? Are there any deal-killer items the seller is aware of (foundation, flood, title, zoning, code violations)?
- Is there a deadline driving the sale (1031 exchange, divorce, estate, relocation)? That informs how much negotiation room exists.
- This sits on a lake — are riparian / water-frontage rights deeded with the parcel? Any dock permits, shoreline easements, or HOA water-use restrictions?
- What's the documented flood / surge / shoreline-erosion history here (FEMA AND non-FEMA — e.g., storm surge, creek backup, septic-field saturation)?
- Any water-quality or seasonal algae-bloom issues that affect tenant satisfaction or short-term-rental demand?
- What's the average days-on-market for RENTAL listings here right now (not sales)? A rising rental-DOM trend means longer vacancies and softer asking-rent achievability than the comps imply.
- What's the recent tenant-quality profile in this submarket — average credit score on applications, eviction rate, late-payment / NSF rate, and stable-employment percentage? A property-management company in the area should have these aggregated.
- How much new apartment / multifamily construction is in the pipeline within 1–3 miles? Heavy new supply (>2% of stock underway) typically softens rents 12–24 months out; light construction supports rent growth.
Investment metrics
- 1% rule
- 1.28% ✓
- Cap rate
- 11.29%
- Cash-on-cash
- 17.84%
- DSCR
- 1.79
- GRM
- 6.5
CMA / ARV
No comps found within radius.
Projected returns pro-forma
-3.0% appreciation · 0.43% rent growth · sell at horizon
- IRR
- -5.4%
- Equity multiple
- 0.80×
- Total profit
- $-11,799
- Equity at exit
- $32,057
- IRR
- 0.5%
- Equity multiple
- 1.03×
- Total profit
- $1,727
- Equity at exit
- $18,589
Cash invested: $60,200 (down + closing). Projections, not guarantees.
Landlord ↔ Tenant lean methodology
- Overall (STATE)
- 87 Strongly Landlord-Friendly
- State Florida
- 87 Strongly Landlord-Friendly · R+3
- County
- — inherits STATE
- City
- — inherits STATE
ZIP-level market 33009
- Rents YoY
- 0.4%
- Active inventory
- 1380
- Price-to-rent
- 6.5×
Monthly cashflow live
- Estimated rent
- $2,761 high interval (Pro) →
- Mortgage (P&I)
- −$1,127
- Tax from tax record
- −$69 /mo · $825/yr
- Insurance
- −$90
- Flood insurance flood zone
- −$427 /mo · $5,118/yr
- HOA
- −$1
- Vacancy / Maint / Mgmt
- −$580
- Net cashflow
- $468
Break-even live
Sensitivity live
| Price | -10% $590 | -5% $529 | +0% $468 | +5% $407 | +10% $347 |
|---|---|---|---|---|---|
| Rent | -10% $250 | -5% $359 | +0% $468 | +5% $577 | +10% $686 |
| Rate | -1.0pp $576 | -0.5pp $523 | base $468 | +0.5pp $413 | +1.0pp $356 |
UW: 25.0% down · 7.5% · 30yr · 1.5% tax · 5.0% vac · 8.0% maint · 8.0% mgmt
Financing live
Cash to close
- Down payment
- $53,750
- Closing costs
- $6,450
- Reserves months
- —
- Total cash needed
- —
Loan-product check · same deal, 3 products live
Conventional
25% down · 7.5% · 30yr
- Down + closing
- —
- Monthly P&I
- —
- Monthly cashflow
- —
- DSCR
- —
- Eligible?
- —
Personal DTI + credit; lowest rate.
DSCR
20% down · 8.5% · 30yr
- Down + closing
- —
- Monthly P&I
- —
- Monthly cashflow
- —
- DSCR
- —
- Eligible?
- —
No personal income docs; deal must DSCR.
Hard money
10% down · 12.0% · 12mo
- Down + closing
- —
- Monthly P&I
- —
- Monthly cashflow
- —
- DSCR
- —
- Eligible?
- —
Short-term bridge; refi at stabilization.
Rent comps 8 comps
| Address | Beds | Baths | Sqft | Rent | $/sqft | DOM | Units | Dist |
|---|---|---|---|---|---|---|---|---|
| 2601 E Hallandale Beach Blvd Unit 1227344P Hallandale Beach, FL | 1.0–2.0 | 1.0–2.0 | 844 | $2,465 | $2.92 | 3d | 2 | 0.12mi |
| 2602 E Hallandale Beach Blvd Unit 1227270P Hallandale Beach, FL | 2.0 | 1.0–2.0 | 640 | $3,224 | $5.04 | 0d | 3 | 0.13mi |
| 2501 S Ocean Dr Hollywood, FL | 1.0–2.0 | 1.0–2.0 | 971 | $4,200 | $4.32 | 15d | 7 | 0.80mi |
| 2501 S Ocean Dr Hollywood, FL | 1.0–2.0 | 1.0–2.0 | 971 | $3,800 | $3.91 | 21d | 8 | 0.80mi |
| 2501 S Ocean Dr Hollywood, FL | 1.0–2.0 | 1.0–2.0 | 971 | $4,400 | $4.53 | 12d | 6 | 0.80mi |
| 2501 S Ocean Dr Hollywood, FL | 1.0–2.0 | 1.0–2.0 | 971 | $4,000 | $4.12 | 9d | 7 | 0.80mi |
| 1180 E Hallandale Beach Blvd Unit 1241877P Hallandale Beach, FL | 1.0–2.0 | 1.0–2.0 | 844 | $2,465 | $2.92 | 5d | 2 | 0.96mi |
| 401 N Federal Hwy Hallandale Beach, FL | 1.0–3.0 | 1.0–2.0 | 973 | $1,892 | $1.94 | 16d | 48 | 1.42mi |
HOA detail condo
- Monthly dues
- $1 · $12/yr
- Likely covers
- waterinternetpoolgymparking
- Assessments
- None detected in remarks — confirm with the listing agent.
Listing history 22 events
-
2026-06-21days on market $215,000 Active 71 DOM
-
2026-06-18days on market $215,000 Active 68 DOM
-
2026-06-17days on market $215,000 Active 67 DOM
-
2026-06-16days on market $215,000 Active 66 DOM
-
2026-06-15days on market $215,000 Active 65 DOM
-
2026-06-13days on market $215,000 Active 63 DOM
-
2026-06-09days on market $215,000 Active 59 DOM
-
2026-06-08days on market $215,000 Active 58 DOM
-
2026-06-07days on market $215,000 Active 57 DOM
-
2026-06-04days on market $215,000 Active 54 DOM
-
2026-06-03days on market $215,000 Active 53 DOM
-
2026-06-02days on market $215,000 Active 52 DOM
-
2026-06-01days on market $215,000 Active 51 DOM
-
2026-05-31days on market $215,000 Active 50 DOM
-
2026-05-21price $215,000
-
2026-04-11$229,000 Active
-
2025-12-30historical
-
2025-11-01status Active
-
2025-05-05status Active
-
2025-04-19$229,000 Active
-
2003-12-17soldstatus $65,000
-
1973-01-01soldstatus $27,500
ⓘ Source: listings_history table (triggers on properties + properties_extension) + one-shot
backfill from property_details.listing_events for pre-trigger history.
Tax reassessment forecast FL · Resets to sale price
- Current annual tax
- $825 · $69/mo
- Projected year-2 tax
- $1,784 · $149/mo
- Expected delta
- +$960/yr (+$80/mo · 116.4%)
ⓘ Screening estimate from a state-policy table — verify with the county assessor before closing.
Climate risk First Street
- Flood 9/10 Extreme FEMA zone AE · 99% chance over 30 yrs
- Wildfire 1/10 Low
- Heat 10/10 Extreme 6 d/yr ≥104°F today · 20 d/yr by 30 yrs out
- Wind 10/10 Extreme 99% chance of damaging wind over 30 yrs
- Air quality 2/10 Low 1 unhealthy d/yr today · 2 by 30 yrs out
Nearby sold comps map
Loading sold comps map…
Walkable amenities ~0.75 mi
Loading nearby amenities…
Taxation est. · year 1
- Rental income
- $33,138
- − Mortgage interest
- −$12,043
- − Property taxes
- −$825
- − Insurance
- −$6,194
- − Repairs & maintenance
- −$2,651
- − Management
- −$2,651
- − HOA
- −$12
- − Depreciation
- −$6,255
- Taxable income
- $2,507
- Est. tax owed @ 24.0%
- −$602
- After-tax cash flow
- $5,017/yr
For passive investors: Depreciation is non-cash, so a rental often shows a tax loss while cash-flowing — sheltering income. Rental losses are passive: they offset passive income freely, and up to $25,000/yr can offset ordinary (W-2) income if you actively participate and your MAGI is under $100k (phasing out to $0 by $150k); unused losses carry forward. On sale, claimed depreciation is recaptured at up to 25%, and gains may owe capital-gains tax (a 1031 exchange can defer both). Figures are a year-1 estimate at your 24.0% rate — not tax advice; consult a CPA.
Schools (NCES district)
- District
- Broward
- NCES district ID
- 1200180
- Math proficiency
- 42% ▼ -18.00%
- Reading proficiency
- 53% ▼ -5.00%
- Median HH income
- $52,139
- Composite
- 40.88/100
- National rank
- #3621
- State rank
- #46 of 73 in FL
Livability — Hallandale Beach
- Score
- 81/100
- State rank
- #86
- US rank
- #1400
Category grades
Schools grade is shown separately in the Schools card above.
Census & demographics
- Census place
- Hallandale Beach, FL
- County
- Broward County · 1,963,430 people
- City population
- 44,021
- Metro
- Miami-Fort Lauderdale-Pompano Beach, FL
- Population (ZIP)
- 44,502
- Household income
- $52,079
- Rent vs Own
- Severe rent burden
- 3293.0
Population outlook (Broward County) Hauer SSP2
- Today (2025)
- 2,207,033 people
- By 2030
- 2,360,704 · +7.0%
- By 2040
- 2,661,208 · +20.6%
- By 2050
- 2,946,698 · +33.5%
- By 2075
- 3,602,273 · +63.2%
- By 2100
- 3,970,984 · +79.9%
Race, ethnicity, and origin ACS 2023
- Neighborhood character
- Diverse neighborhood (Simpson 0.67)
- Race & ethnicity
- Hispanic / Latino 39% White 39% Two or more races 24% Black 17% Asian 1%
- Hispanic origin (detail)
- Mexican 2% Puerto Rican 3% Cuban 9% Dominican 3% Salvadoran 2%
- Common ancestry
- Scotch-Irish 5% Hispanic 5% Subsaharan African 3%
- Foreign-born
- 51% · Canada, Jamaica, Dominican Republic
- Languages at home
- 38% English-only · Spanish 36% Russian/Polish/Slavic 12% French/Haitian/Cajun 7%
Political lean MEDSL · Broward
- 2024 margin
- D (+17.0) · D 58.0% · R 41.0%
- 2008→2024 swing
- -17.8pp toward R · 2008: 34.7pp · 2024: 17.0pp
- All cycles
- 2024: D+17.0 2020: D+29.8 2016: D+35.0 2012: D+34.9 2008: D+34.7
Not yet ingested
- Civics
- —
Market trends
- HPI YoY
- ▼ -299.13%
- Current HPI
- 329.9081
- Rent YoY
- ▲ 0.43%
- Metro
- Miami-Fort Lauderdale-Pompano Beach, FL
- State GDP YoY
- ▲ 3.28%
- F500 in state
- 36
Industry mix (Fortune 500 HQ in FL)
| Industry | F500 HQs | Revenue |
|---|---|---|
| Industrial Technology | 2 | $29B |
|
||
| Insurance | 2 | $17B |
|
||
| Retail | 1 | $60B |
|
||
| Technology Distribution | 1 | $58B |
|
||
| Homebuilding | 1 | $35B |
|
||
| Technology Manufacturing | 1 | $35B |
|
||
Price history
+681.8% since first listed8 events — show timeline
- 2026-05-21 Price Changed $215,000 MARMLS
- 2026-04-11 Listed $229,000 MARMLS
- 2025-12-30 Listing Removed — MARMLS
- 2025-11-01 Relisted — MARMLS
- 2025-05-05 Relisted — MARMLS
- 2025-04-19 Listed $229,000 MARMLS
- 2003-12-17 Sold (Public Records) $65,000 Public Records
- 1973-01-01 Sold (Public Records) $27,500 Public Records
Property tax history
+0.3%/yrLatest (2025): $825 · +2.4% YoY. Source: county tax records.
Cash-flow waterfall
monthlySold comps — $/sqft
last 12 mo · ≤1 miLoading sold comps…