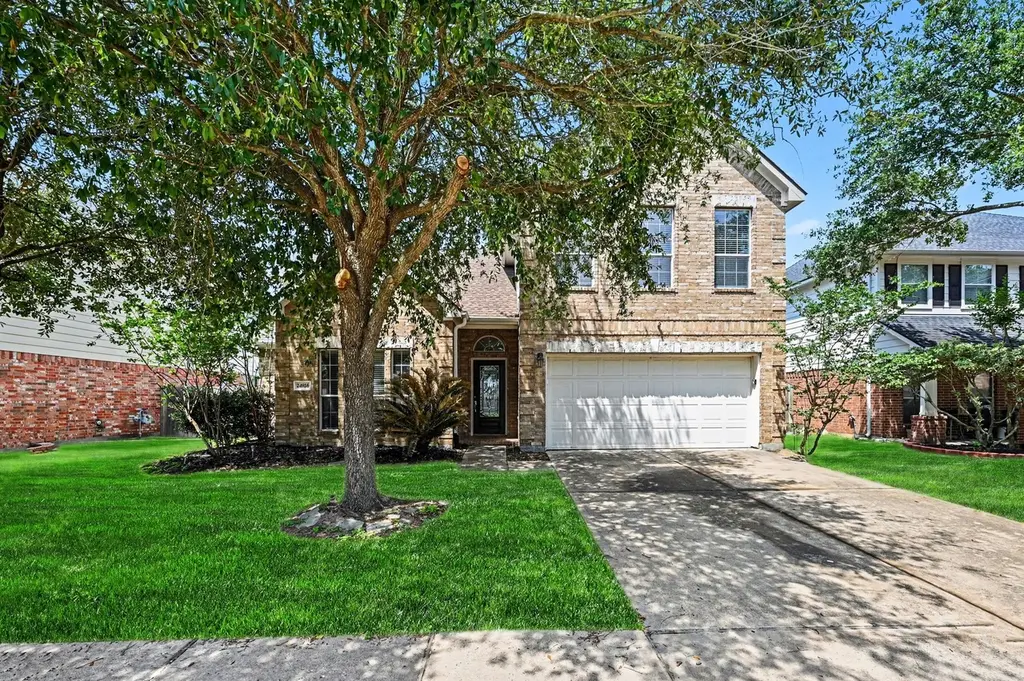
24926 Mason Creek Path · Houston, TX
Flood risk 1/10 · Minimal
- FEMA flood zone
- X (unshaded)
- Chance of flooding over 30 yrs
- 0.0%
- Est. flood insurance / yr
- $507 – $1,088
Fire risk 3/10 · Minor
- Est. fire insurance / yr
- $1,222 – $2,270
Heat risk 9/10 · Severe
- Hot days now (above 111°F)
- 7 days/yr
- Hot days in 30 yrs
- 24 days/yr
Wind risk 8/10 · Major
- Chance of severe wind over 30 yrs
- 99.0%
Air-quality risk 2/10 · Minimal
- Unhealthy air days now
- 1 days/yr
- Unhealthy air days in 30 yrs
- 2 days/yr
Risk factors via First Street. Map © Google.
Why this score? — see what drove the D grade
The composite is a weighted blend of 9 inputs, each scored 0–100. Each bar is that input's sub-score; the figure is the points it added to the 100-point composite (weight × sub-score).
- Cash flow +10.7/30.0
- ARV discount +9.6/15.0
- Schools +5.7/10.0
- 1% rule +4.4/10.0
- Livability +3.7/5.0
- DSCR +3.1/10.0
- Condition / age +2.5/5.0
- Rent growth +2.3/5.0
- Appreciation +0.0/10.0
$324,900
🖨 Deal sheet (PDF) 📄 Offer letter ✓ Due diligence
Listing remarks
This move-in ready four-bedroom, 2.5-bathroom home is perfectly situated in the desirable Lakecrest neighborhood. The interior features a sought after floorplan with a formal dining room plus a spacious living area as the heart of the home highlighted a cozy fireplace centerpiece and soaring tall ceilings in the great room, creating a bright and airy atmosphere. The updated, island kitchen boasts elegant granite countertops, modern stainless steel appliances, ample storage space and a breakfast room, seamlessly connecting to the living areas for easy entertaining. The private primary suite located on the first floor provides a comfortable retreat, complete with a large walk-in and ensuite w
Key facts
- Formal dining room
- Tall ceilings
- Island kitchen
Tags
Property features AI
Finance
- HOA & community: Member of Lakecrest Community Association; Annual association fee: $625
Exterior
- Parking: Attached 2-car garage
- Security: Security gate
- Utilities: Public water; Public sewer; Asphalt road access
- Home design: Residential property; Faces south; Built in 2007; Slab foundation; Composition roof
- Construction: Brick and vinyl siding construction
- Exterior features: Deck; Patio; Fence (back yard); Storage shed(s); Tennis court(s)
Interior
- Kitchen: Dishwasher; Electric oven; Electric range; Garbage disposal; Microwave; Refrigerator
- Bedrooms: Primary bedroom (First floor) — 19x15; Bedroom (Second floor) — 12x12; Bedroom (Second floor) — 14x11; Bedroom (Second floor) — 13x11; Library (First floor) — 12x10; Living room (First floor) — 25x16; Total rooms: 6
- Flooring: Carpet; Plank; Tile; Vinyl
- Bathrooms: 2 full bathrooms; 1 half bathroom
- Heating & cooling: Central heating (Gas); Central air (Electric)
- Interior features: Crown molding; Double vanity; Granite counters; High ceilings; Kitchen island; Pantry; Soaking tub; Separate shower; Tub/shower; Vaulted ceiling(s); Window treatments; Ceiling fan(s); Loft; Gas fireplace (1)
- Laundry & utility: Washer hookup; Gas dryer hookup
Neighborhood map
What this means for you Summary
Snapshot
- This is a 4-bed/2.5-bath single-family listed at $325k.
Deal economics
- At list price, monthly cash flow is $-154 ($-2k/yr) — negative.
- To cash-flow at today's rent, offer at most $298k (8.4% below list).
- To meet the 1% rule (rent ≥ 1% of price), the offer needs to be $304k (6.4% below list).
- Recommended offer: $298k (8.4% below list) — sets the bar for cash-flow.
- Cap rate 5.7% vs local median 3.1% in Houston — top-decile yield for the area; either an underpriced asset or a hidden risk that comps aren't pricing in. Stress-test before assuming the spread holds.
Location & tenants
- Location reads 74/100 on livability (#184 in TX, #4,771 nationally) — a middle-class / working-renter tenant base. Strengths: amenities A+, cost of living A+, housing A+; Watch: crime F.
- Katy ISD (suburban): math 61% / reading 63% proficiency, ranked #29 of 826 in TX (top 4%) — acceptable for families but not a draw, mixed tenant base, ~2y average lease.
- Zoned schools: Robert King El (math 41% / reading 44%, grade F, #1,313 of 4,322 statewide, top 31%, 981 students, 68% FRL); Katy J H (math 52% / reading 51%, grade C, #318 of 1,662 statewide, top 20%, 1,094 students, 53% FRL); Katy H S (math 62% / reading 74%, grade B, #150 of 1,632 statewide, top 10%, 3,330 students, 38% FRL) — zoned schools average 53% FRL vs 27% district-wide (25 pts higher); higher-poverty schools than district average — tighter screening recommended.
- Market conditions: Rents soft (-0.8%/yr); 2729 active listings in the ZIP; 4 comparable units currently listed for rent nearby; rentals at typical pace (median 19d on market — plan ~3-4 weeks tenant-placement turnaround); high-income renter base; 29,883 units permitted in Harris County in 2024 (8,621 in 5+ unit buildings).
- This rent runs 31% of the median local income ($118k/yr) — at the standard rent-burdened threshold; future hikes will face affordability resistance.
Forward outlook
- Local home prices are declining (-3.0%/yr); year-one equity from $2k of loan paydown is wiped out by about $10k of value loss. Plan a longer hold.
- Harris County population projected at +47% by 2050 — long-run rental-demand tailwind backs the buy-and-hold thesis.
Negotiation context
- It's been on market 53 days — a 3% lower offer ($315k) is reasonable based on typical stale-listing flexibility.
- 2 sale attempts since 2y ago with the ask held roughly flat each time — persistent listings suggest the price (not the market) is what's stuck; bring a comps-based counter.
Risks & watch-outs
- Climate carrying-cost: severe wind risk, 99% chance of damaging wind over 30y; extreme-heat days projected 7→24/yr by 2055 (HVAC capex compounding) — expect insurance premiums to compound above CPI over the hold.
Questions for the listing agent
- What do current leases actually rent for vs. the listed asking? Can we see a recent rent roll and the last 12 months of T-12 income?
- It's been on market 53 days. Have you received any prior offers? Is the seller open to a 8% concession, seller financing, or rate buy-down credit?
- What does the HOA fee cover, when was the last increase, and are there any pending special assessments or reserve-fund shortfalls?
- Is there a deadline driving the sale (1031 exchange, divorce, estate, relocation)? That informs how much negotiation room exists.
- Schools are D-rated, which usually means shorter tenancies and higher turnover. Who's the typical renter profile here, and what's been the actual vacancy rate?
- Crime grade is F in this area — have there been break-ins, vandalism, or insurance claims at this property in the last 3 years? What carrier currently insures it and at what premium?
- The area grade is low — what's the realistic commute time and amenity access for the typical tenant pool here? Any planned neighborhood developments (good or bad) we should know about?
- What's the average days-on-market for RENTAL listings here right now (not sales)? A rising rental-DOM trend means longer vacancies and softer asking-rent achievability than the comps imply.
- What's the recent tenant-quality profile in this submarket — average credit score on applications, eviction rate, late-payment / NSF rate, and stable-employment percentage? A property-management company in the area should have these aggregated.
- How much new for-sale + rental construction is in the pipeline within 1–3 miles? Heavy new supply typically softens prices + rents 12–24 months out; constrained supply supports both.
Investment metrics
- 1% rule
- 0.94% ✗
- Cap rate
- 5.72%
- Cash-on-cash
- -2.04%
- DSCR
- 0.91
- GRM
- 8.9
CMA / ARV
- ARV (median comp)
- $341,101
- List price
- $324,900
- Delta
- -4.75%
- Verdict
- FAIR
- Comps
- 20 within 1.0 mi
Show comp detail 12 sales within ~0.75 mi
| Address | Dist | Beds/Ba | Sqft | Sold | Price | $/sf | Match |
|---|---|---|---|---|---|---|---|
| 24802 Colonial Maple Dr | 0.33mi | 4/2.5 | 2,637 (-1%) | 3mo | $334,999 | $127 | 80 |
| 25043 Lenora Dr | 0.11mi | 4/2.5 | 2,873 (+8%) | 5mo | $334,990 | $117 | 78 |
| 25007 Lenora Dr | 0.08mi | 4/2.5 | 2,443 (-8%) | 6mo | $324,990 | $133 | 77 |
| 24306 Lanning Dr | 0.50mi | 4/2.5 | 2,629 (-1%) | 4mo | $338,000 | $129 | 71 |
| 24514 Lake Path Cir | 0.26mi | 4/2.5 | 2,921 (+10%) | 3mo | $364,900 | $125 | 70 |
| 24735 Colonial Maple Dr | 0.36mi | 4/3.5 | 2,802 (+5%) | 7mo | $333,000 | $119 | 65 |
| 24202 Dan River Dr | 0.66mi | 4/2.5 | 2,702 (+1%) | 2mo | $285,000 | $105 | 65 |
| 24311 Lanning Dr | 0.49mi | 4/3.5 | 2,820 (+6%) | 1mo | $405,000 | $144 | 63 |
| 5084 Morrison Blvd | 0.45mi | 3/2.5 (-1) | 2,406 (-10%) | 1mo | $365,000 | $152 | 57 |
| 1247 S Maple Dr | 0.52mi | 4/3.5 | 2,932 (+10%) | 1mo | $375,000 | $128 | 54 |
| 1719 Charlton House Ln | 0.73mi | 4/2.5 | 2,476 (-7%) | 0mo | $339,990 | $137 | 54 |
| 1610 Mason Knights Dr | 0.36mi | 5/3.5 (+1) | 3,050 (+14%) | 1mo | $345,000 | $113 | 50 |
Match score weights: distance 35% · size 25% · config 20% · recency 20%. Top-matched comps best support the ARV.
Projected returns pro-forma
-3.0% appreciation · 0.0% rent growth · sell at horizon
- IRR
- -23.5%
- Equity multiple
- 0.22×
- Total profit
- $-71,159
- Equity at exit
- $48,444
- IRR
- -31.9%
- Equity multiple
- -0.19×
- Total profit
- $-108,111
- Equity at exit
- $28,091
Cash invested: $90,972 (down + closing). Projections, not guarantees.
Landlord ↔ Tenant lean methodology
- Overall (STATE)
- 87 Strongly Landlord-Friendly
- State Texas
- 87 Strongly Landlord-Friendly · R+5
- County
- — inherits STATE
- City
- — inherits STATE
ZIP-level market 77493
- Rents YoY
- -0.8%
- Active inventory
- 2729
- Price-to-rent
- 8.9×
Monthly cashflow live
- Estimated rent
- $3,042 medium interval (Pro) →
- Mortgage (P&I)
- −$1,704
- Tax from tax record
- −$666 /mo · $7,994/yr
- Insurance
- −$135
- HOA
- −$52
- Vacancy / Maint / Mgmt
- −$639
- Net cashflow
- $-154
Break-even live
Sensitivity live
| Price | -10% $30 | -5% $-62 | +0% $-154 | +5% $-246 | +10% $-338 |
|---|---|---|---|---|---|
| Rent | -10% $-395 | -5% $-275 | +0% $-154 | +5% $-34 | +10% $86 |
| Rate | -1.0pp $9 | -0.5pp $-72 | base $-154 | +0.5pp $-239 | +1.0pp $-324 |
UW: 25.0% down · 7.5% · 30yr · 1.5% tax · 5.0% vac · 8.0% maint · 8.0% mgmt
Financing live
Cash to close
- Down payment
- $81,225
- Closing costs
- $9,747
- Reserves months
- —
- Total cash needed
- —
Loan-product check · same deal, 3 products live
Conventional
25% down · 7.5% · 30yr
- Down + closing
- —
- Monthly P&I
- —
- Monthly cashflow
- —
- DSCR
- —
- Eligible?
- —
Personal DTI + credit; lowest rate.
DSCR
20% down · 8.5% · 30yr
- Down + closing
- —
- Monthly P&I
- —
- Monthly cashflow
- —
- DSCR
- —
- Eligible?
- —
No personal income docs; deal must DSCR.
Hard money
10% down · 12.0% · 12mo
- Down + closing
- —
- Monthly P&I
- —
- Monthly cashflow
- —
- DSCR
- —
- Eligible?
- —
Short-term bridge; refi at stabilization.
Rent comps 4 comps
| Address | Beds | Baths | Sqft | Rent | $/sqft | DOM | Units | Dist |
|---|---|---|---|---|---|---|---|---|
| 1739 Palmetto Park Dr Katy, TX | 4.0 | 3.5 | 2998 | $3,100 | $1.03 | 46d | 1 | 0.24mi |
| 1508 Colonial Gorge Dr Katy, TX | 4.0 | 2.5 | 1904 | $2,650 | $1.39 | 19d | 1 | 0.52mi |
| 2222 Princess Snow Cir Katy, TX | 4.0 | 2.5 | 2958 | $2,425 | $0.82 | 15d | 1 | 1.17mi |
| 1724 Partnership Way Katy, TX | 3.0 | 1.0–3.5 | 1536 | $3,340 | $2.17 | 0d | 86 | 1.42mi |
HOA detail
- Monthly dues
- $52 · $624/yr
Listing history 24 events
-
2026-06-21days on market $324,900 Active 53 DOM
-
2026-06-18price $324,900 Active 50 DOM
-
2026-06-18days on market $329,900 Active 50 DOM
-
2026-06-17days on market $329,900 Active 49 DOM
-
2026-06-16days on market $329,900 Active 48 DOM
-
2026-06-15days on market $329,900 Active 47 DOM
-
2026-06-13days on market $329,900 Active 45 DOM
-
2026-06-09days on market $329,900 Active 41 DOM
-
2026-06-08days on market $329,900 Active 40 DOM
-
2026-06-07days on market $329,900 Active 39 DOM
-
2026-06-04days on market $329,900 Active 36 DOM
-
2026-06-03days on market $329,900 Active 35 DOM
-
2026-06-02days on market $329,900 Active 34 DOM
-
2026-06-01days on market $329,900 Active 33 DOM
-
2026-05-31days on market $329,900 Active 32 DOM
-
2026-04-29$334,900 Active 992-char remark
-
2024-03-24historical $2,450
-
2024-03-02price $2,450
-
2024-02-07price $2,550
-
2024-01-24price $2,595
-
2024-01-20price $2,635
-
2024-01-13$2,695
-
2022-06-19price $2,460
-
2021-11-09soldstatus
ⓘ Source: listings_history table (triggers on properties + properties_extension) + one-shot
backfill from property_details.listing_events for pre-trigger history.
Tax reassessment forecast TX · Resets to sale price
- Current annual tax
- $7,994 · $666/mo
- Projected year-2 tax
- $7,994 · $666/mo
- Expected delta
- $0/yr ($0/mo · 0.0%)
ⓘ Screening estimate from a state-policy table — verify with the county assessor before closing.
Climate risk First Street
- Flood 1/10 Low FEMA zone X (unshaded) · 0% chance over 30 yrs
- Wildfire 3/10 Moderate
- Heat 9/10 Extreme 7 d/yr ≥111°F today · 24 d/yr by 30 yrs out
- Wind 8/10 Severe 99% chance of damaging wind over 30 yrs
- Air quality 2/10 Low 1 unhealthy d/yr today · 2 by 30 yrs out
Nearby sold comps map
Loading sold comps map…
Walkable amenities ~0.75 mi
Loading nearby amenities…
Taxation est. · year 1
- Rental income
- $36,500
- − Mortgage interest
- −$18,199
- − Property taxes
- −$7,994
- − Insurance
- −$1,624
- − Repairs & maintenance
- −$2,920
- − Management
- −$2,920
- − HOA
- −$624
- − Depreciation
- −$9,452
- Taxable loss
- −$7,233
- Est. tax savings @ 24.0%
- +$1,736
- After-tax cash flow
- $-117/yr
For passive investors: Depreciation is non-cash, so a rental often shows a tax loss while cash-flowing — sheltering income. Rental losses are passive: they offset passive income freely, and up to $25,000/yr can offset ordinary (W-2) income if you actively participate and your MAGI is under $100k (phasing out to $0 by $150k); unused losses carry forward. On sale, claimed depreciation is recaptured at up to 25%, and gains may owe capital-gains tax (a 1031 exchange can defer both). Figures are a year-1 estimate at your 24.0% rate — not tax advice; consult a CPA.
Schools (NCES district)
- District
- Katy ISD
- NCES district ID
- 4825170
- Math proficiency
- 61% ▼ -7.00%
- Reading proficiency
- 63% ▼ -3.00%
- Median HH income
- $90,312
- Composite
- 56.59/100
- National rank
- #1146
- State rank
- #29 of 826 in TX
Livability — Houston
- Score
- 74/100
- State rank
- #184
- US rank
- #4771
Category grades
Schools grade is shown separately in the Schools card above.
Census & demographics
- County
- Harris County · 4,702,590 people
- City population
- 3,226,434
- Metro
- Houston-The Woodlands-Sugar Land, TX
- Population (ZIP)
- 71,484
- Household income
- $118,464
- Rent vs Own
- Severe rent burden
- 913.0
Population outlook (Harris County) Hauer SSP2
- Today (2025)
- 5,571,493 people
- By 2030
- 6,089,821 · +9.3%
- By 2040
- 7,142,806 · +28.2%
- By 2050
- 8,185,864 · +46.9%
- By 2075
- 10,574,329 · +89.8%
- By 2100
- 12,109,958 · +117.4%
Race, ethnicity, and origin ACS 2023
- Neighborhood character
- Highly diverse neighborhood (Simpson 0.73)
- Race & ethnicity
- White 36% Hispanic / Latino 33% Two or more races 16% Black 15% Asian 12%
- Hispanic origin (detail)
- Mexican 20%
- Common ancestry
- Lithuanian 2% Slovak 1% Italian 1%
- Foreign-born
- 21% · Canada, Vietnam, Jamaica
- Languages at home
- 64% English-only · Spanish 22% Vietnamese 5% French/Haitian/Cajun 4%
Political lean MEDSL · Harris
- 2024 margin
- Lean D (+5.5) · D 52.0% · R 46.4% · Other 1.6%
- 2008→2024 swing
- +3.9pp toward D · 2008: 1.6pp · 2024: 5.5pp
- All cycles
- 2024: D+5.5 2020: D+13.3 2016: D+12.4 2012: D+0.1 2008: D+1.6
Not yet ingested
- Civics
- —
Market trends
- HPI YoY
- ▼ -140.65%
- Current HPI
- 233.1683
- Rent YoY
- ▼ -0.80%
- Metro
- Houston-The Woodlands-Sugar Land, TX
- State GDP YoY
- ▲ 3.95%
- F500 in state
- 110
Industry mix (Fortune 500 HQ in TX)
| Industry | F500 HQs | Revenue |
|---|---|---|
| Energy | 16 | $1,198B |
|
||
| Technology | 5 | $198B |
|
||
| Engineering / Construction | 4 | $72B |
|
||
| Energy Services | 3 | $60B |
|
||
| Utilities | 3 | $41B |
|
||
| Healthcare | 2 | $330B |
|
||
Price history
+13107.3% since first listed11 events — show timeline
- 2026-06-18 Price Changed $324,900 HARMLS
- 2026-05-29 Price Changed $329,900 HARMLS
- 2026-04-29 Listed $334,900 HARMLS
- 2024-03-24 Rental Removed $2,450 RENTLY
- 2024-03-02 Price Changed $2,450 RENTLY
- 2024-02-07 Price Changed $2,550 RENTLY
- 2024-01-24 Price Changed $2,595 RENTLY
- 2024-01-20 Price Changed $2,635 RENTLY
- 2024-01-13 Listed for Rent $2,695 RENTLY
- 2022-06-19 Price Changed $2,460 RENT.
- 2021-11-09 Sold (Public Records) — Public Records
Property tax history
+2.0%/yrLatest (2025): $7,994 · -0.0% YoY. Source: county tax records.
Cash-flow waterfall
monthlySold comps — $/sqft
last 12 mo · ≤1 miLoading sold comps…