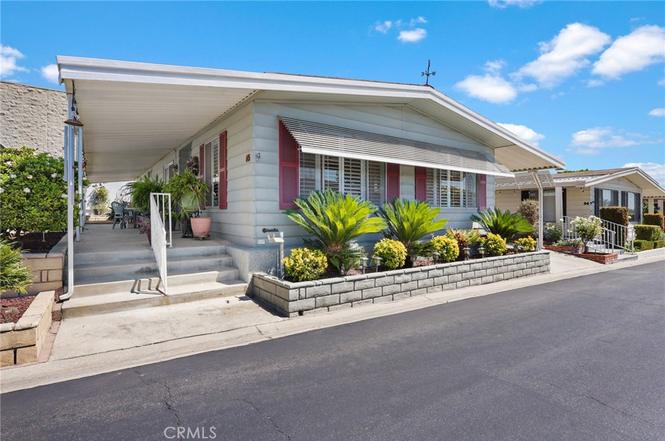
11730 Whittier #65 · West Whittier-Los Nietos, CA
Flood risk 1/10 · Minimal
- FEMA flood zone
- X (unshaded)
- Chance of flooding over 30 yrs
- 0.0%
- Est. flood insurance / yr
- $507 – $1,088
Fire risk 5/10 · Moderate
- Est. fire insurance / yr
- $659 – $1,223
Heat risk 6/10 · Moderate
- Hot days now (above 95°F)
- 7 days/yr
- Hot days in 30 yrs
- 21 days/yr
Wind risk 1/10 · Minimal
- Chance of severe wind over 30 yrs
- —
Air-quality risk 6/10 · Moderate
- Unhealthy air days now
- 9 days/yr
- Unhealthy air days in 30 yrs
- 10 days/yr
Risk factors via First Street. Map © Google.
Why this score? — see what drove the B- grade
The composite is a weighted blend of 9 inputs, each scored 0–100. Each bar is that input's sub-score; the figure is the points it added to the 100-point composite (weight × sub-score).
- Cash flow +30.0/30.0
- 1% rule +10.0/10.0
- DSCR +10.0/10.0
- ARV discount +5.8/15.0
- Schools +4.7/10.0
- Rent growth +3.3/5.0
- Livability +2.5/5.0
- Condition / age +2.5/5.0
- Appreciation +0.0/10.0
$130,000
🖨 Deal sheet 📄 Offer letter ✓ Due diligence
Listing remarks
Discover Whittier Downs, a welcoming 55+ gated community where connection, creativity, and comfort come together in a close-knit neighborhood of just 75 homes. This charming 2-bedroom, 2-bath home offers a unique floor plan, solid construction, and easy-care living with no carpet throughout. The spacious living room features a dramatic 9-foot beamed ceiling and flows seamlessly into the formal dining area, creating an inviting open-concept space accented by soft sand-tan and white tones. A separate den adds flexibility and character with a decorative cutout accent wall, built-in storage, and cheerful robin's egg blue and turquoise accents. Numerous built-ins throughout the home maximize sto
Key facts
- Gated community
- Unique floor plan
- No carpet
Tags
Property features AI
Finance
- Other: Rent includes trash and sewer
- Financial info: Land lease amount charged monthly
- HOA & community: Senior community; Whittier Downs Mobile Home Park; Community features include gutters, curbs, street lighting, storm drains, suburban setting; Land lease (park) monthly
Exterior
- Parking: Concrete driveway; Driveway slopes up from street; Carport; Guest and private parking available
- Security: Carbon monoxide detector(s); Fire and smoke detection system; Security lights; Automatic gate with gated community; Resident manager on site; Manager approval required
- Utilities: District/public water; Sewer paid; public sewer connected; Natural gas connected; Electricity and cable connected; 220V in kitchen
- Home design: Single-story/mobile home (one level); Entry at street level; Turnkey condition; Mobile home remains (12' x 60'); Rectangular, lot-level/flat setting; Zero lot line; Near public transit and close to clubhouse; Private road frontage
- Construction: Vinyl exterior; Synthetic/composition roof with ridge vents; Permanent, pillar/post/pier, concrete perimeter raised foundation; Year built per assessor
- Exterior features: Covered concrete patio and open patio on slab; Awning; Exterior lighting; Shed; Block wall fencing; In-ground, heated, gunite community pool; In-ground community spa
Interior
- Kitchen: Remodeled kitchen with stone/granite counters; Double oven; Gas cooktop; Range/stove hood; Refrigerator; Dishwasher; Microwave; Vented exhaust fan; Pots & pan drawers; Water heater unit
- Bedrooms: Main floor primary bedroom; All bedrooms on one level; Primary suite with walk-in closet
- Flooring: Tile; Wood; Laminate
- Bathrooms: Two full bathrooms; Upgraded finishes; Soaking tub and bathtub; Shower and shower-in-tub; Double sinks in primary bath; Exhaust fans and linen/storage closet; Granite counters
- Heating & cooling: Central gas cooling; Forced air heating; Central furnace
- Interior features: Beamed ceilings; Built-in shelving/cabinetry; High (9'+) ceilings; Ceiling fan; Granite counters; Wood product walls; Panel doors; Sliding glass door(s); Mirrored closet doors; Shutters and plantation shutters; Skylights; Blinds and screens; Unfurnished
- Laundry & utility: Inside laundry in a separate room; Washer included; Dryer included
Neighborhood map
What this means for you Summary
Snapshot
- This is a 2-bed/2.0-bath manufactured listed at $130k.
Deal economics
- At list price, monthly cash flow is $1k ($17k/yr) — positive.
- The deal already cash-flows at list — no discount required.
- Meets the 1% rule at list price ($3k rent vs $130k).
- Cap rate 19.7% vs local median 2.8% in West Whittier-Los Nietos — top-decile yield for the area; either an underpriced asset or a hidden risk that comps aren't pricing in. Stress-test before assuming the spread holds.
Location & tenants
- Location reads: area grade B — affects rentability + tenant quality, not the cash-flow math above.
- Whittier Union High (suburban): math 42% / reading 65% proficiency, ranked #111 of 517 in CA (top 22%) — acceptable for families but not a draw, mixed tenant base, ~2y average lease.
- Market conditions: Rents rising (+3.4%/yr); 77 active listings in the ZIP; 27 comparable units currently listed for rent nearby; rentals leasing fast (median 12d on market — plan ~1-2 weeks tenant-placement turnaround); solid renter incomes; 19,697 units permitted in Los Angeles County in 2024 (9,426 in 5+ unit buildings).
- This rent runs 32% of the median local income ($104k/yr) — at the standard rent-burdened threshold; future hikes will face affordability resistance.
Forward outlook
- Local home prices are declining (-3.0%/yr); year-one equity from $899 of loan paydown is wiped out by about $4k of value loss. Plan a longer hold.
- Los Angeles County population projected at +9% by 2050 — modest demand growth; plan on rents tracking national, not racing it.
- At projected returns (-3.0% appreciation + 3.4% rent growth), your $36k cash investment doubles in ~3 years — after that, you're playing with house money.
Negotiation context
- Only 2 days on market — expect competitive offers; lowballing is unlikely to land.
- 5 sale attempts since 20y ago with the ask held roughly flat each time — persistent listings suggest the price (not the market) is what's stuck; bring a comps-based counter.
- Current owner paid $55k; list at $130k implies a 136% gain — meaningful room to come down on a strong offer.
Risks & watch-outs
- Climate carrying-cost: moderate wildfire risk; extreme-heat days projected 7→21/yr by 2055 (HVAC capex compounding) — expect insurance premiums to compound above CPI over the hold.
Questions for the listing agent
- Built in 1978 — when were the roof, HVAC, electrical panel, plumbing, and water heater last replaced?
- Is there a deadline driving the sale (1031 exchange, divorce, estate, relocation)? That informs how much negotiation room exists.
- What's the average days-on-market for RENTAL listings here right now (not sales)? A rising rental-DOM trend means longer vacancies and softer asking-rent achievability than the comps imply.
- What's the recent tenant-quality profile in this submarket — average credit score on applications, eviction rate, late-payment / NSF rate, and stable-employment percentage? A property-management company in the area should have these aggregated.
- How much new for-sale + rental construction is in the pipeline within 1–3 miles? Heavy new supply typically softens prices + rents 12–24 months out; constrained supply supports both.
Investment metrics
- 1% rule
- 2.16% ✓
- Cap rate
- 19.70%
- Cash-on-cash
- 47.88%
- DSCR
- 3.13
- GRM
- 3.8
CMA / ARV
- ARV (on-the-fly)
- $125,280
- Comps found
- 6
Show comp detail 6 sales within ~0.75 mi
| Address | Dist | Beds/Ba | Sqft | Sold | Price | $/sf | Match |
|---|---|---|---|---|---|---|---|
| 11730 Whittier Blvd #63 | 0.00mi | 2/2.0 | 1,440 (0%) | 1mo | $120,000 | $83 | 99 |
| 11730 Whittier Blvd #27 | 0.00mi | 2/2.0 | 1,440 (0%) | 1mo | $129,000 | $90 | 99 |
| 11730 Whittier Blvd #20 | 0.00mi | 2/2.0 | 1,440 (0%) | 12mo | $125,000 | $87 | 90 |
| 11730 Whittier Blv. #47 | 0.00mi | 2/2.0 | 1,440 (0%) | 23mo | $121,200 | $84 | 81 |
| 11730 Whittier Blvd #40 | 0.00mi | 2/2.0 | 1,296 (-10%) | 6mo | $109,400 | $84 | 79 |
| 11730 Whittier Blvd #12 | 0.00mi | 2/2.0 | 1,600 (+11%) | 8mo | $159,900 | $100 | 75 |
Match score weights: distance 35% · size 25% · config 20% · recency 20%. Top-matched comps best support the ARV.
Projected returns pro-forma
-3.0% appreciation · 3.39% rent growth · sell at horizon
- IRR
- 45.7%
- Equity multiple
- 2.99×
- Total profit
- $72,506
- Equity at exit
- $19,383
- IRR
- 51.7%
- Equity multiple
- 6.13×
- Total profit
- $186,682
- Equity at exit
- $11,240
Cash invested: $36,400 (down + closing). Projections, not guarantees.
Landlord ↔ Tenant lean methodology
- Overall (STATE)
- 18 Strongly Tenant-Friendly
- State California
- 18 Strongly Tenant-Friendly · D+13
- County
- — inherits STATE
- City
- — inherits STATE
ZIP-level market 90601
- Rents YoY
- 3.4%
- Active inventory
- 77
- Price-to-rent
- 3.8×
Monthly cashflow live
- Estimated rent
- $2,814 high interval (Pro) →
- Mortgage (P&I)
- −$682
- Tax from tax record
- −$35 /mo · $418/yr
- Insurance
- −$54
- HOA
- −$0
- Vacancy / Maint / Mgmt
- −$591
- Net cashflow
- $1,452
Break-even live
UW: 25.0% down · 7.5% · 30yr · 1.5% tax · 5.0% vac · 8.0% maint · 8.0% mgmt
Financing live
Cash to close
- Down payment
- $32,500
- Closing costs
- $3,900
- Reserves months
- —
- Total cash needed
- —
Loan-product check · same deal, 3 products live
Conventional
25% down · 7.5% · 30yr
- Down + closing
- —
- Monthly P&I
- —
- Monthly cashflow
- —
- DSCR
- —
- Eligible?
- —
Personal DTI + credit; lowest rate.
DSCR
20% down · 8.5% · 30yr
- Down + closing
- —
- Monthly P&I
- —
- Monthly cashflow
- —
- DSCR
- —
- Eligible?
- —
No personal income docs; deal must DSCR.
Hard money
10% down · 12.0% · 12mo
- Down + closing
- —
- Monthly P&I
- —
- Monthly cashflow
- —
- DSCR
- —
- Eligible?
- —
Short-term bridge; refi at stabilization.
Rent comps 27 comps
| Address | Beds | Baths | Sqft | Rent | $/sqft | DOM | Units | Dist |
|---|---|---|---|---|---|---|---|---|
| 6728 Whittier Ave Whittier, CA | 3.0 | 1.0 | 1000 | $2,800 | $2.80 | 24d | 1 | 0.51mi |
| 12429 Hadley St Whittier, CA | 2.0 | 1.0 | 900 | $2,185 | $2.43 | 24d | 1 | 0.51mi |
| 6535 Pickering Ave Unit 18 Whittier, CA | 2.0 | 2.0 | 1200 | $2,750 | $2.29 | 24d | 1 | 0.54mi |
| 6535 Pickering Ave Apt 14 Whittier, CA | 2.0 | 1.5 | 1100 | $2,495 | $2.27 | 24d | 1 | 0.55mi |
| 12103 Howard St Whittier, CA | 3.0 | 1.0 | 1000 | $2,950 | $2.95 | 3d | 1 | 0.62mi |
| 6741 Newlin Ave Whittier, CA | 2.0 | 2.0 | 1338 | $3,700 | $2.77 | 17d | 1 | 0.63mi |
| 7806 Wellsford Ave Whittier, CA | 2.0 | 1.0 | 912 | $3,299 | $3.62 | 11d | 1 | 0.71mi |
| 7339 Milton Ave Whittier, CA | 2.0 | 1.5 | 1000 | $2,650 | $2.65 | 11d | 1 | 0.83mi |
| 7339 Milton Ave Whittier, CA | 2.0 | 1.5 | 1250 | $2,795 | $2.24 | 18d | 1 | 0.83mi |
| 6227 Greenleaf Ave Apt 3 Whittier, CA | 3.0 | 2.0 | 1251 | $3,000 | $2.40 | 7d | 1 | 0.88mi |
| 6333 Bright Ave Unit 1E Whittier, CA | 2.0 | 1.0 | 1012 | $2,300 | $2.27 | 6d | 1 | 0.91mi |
| 7026 Friends Ave Whittier, CA | 3.0 | 2.0 | 1657 | $4,250 | $2.56 | 1d | 1 | 1.07mi |
| 10726 Orange Grv Unit 21 Whittier, CA | 2.0 | 1.0 | 1000 | $2,100 | $2.10 | 22d | 1 | 1.11mi |
| 10733 Orange Grv Unit 33-03 Whittier, CA | 3.0 | 1.5 | 1100 | $2,795 | $2.54 | 20d | 1 | 1.11mi |
| 7047 Painter Ave Whittier, CA | 3.0 | 1.0 | 1104 | $3,000 | $2.72 | 11d | 1 | 1.12mi |
| 10820 Hunter Ave Whittier, CA | 3.0 | 1.0 | 1316 | $4,200 | $3.19 | 1d | 1 | 1.12mi |
| 8115 Via Alta Whittier, CA | 2.0 | 2.0 | 1018 | $3,500 | $3.44 | 1d | 3 | 1.13mi |
| 10717 Shire Pl Apt 6 Whittier, CA | 2.0 | 2.0 | 980 | $2,750 | $2.81 | 24d | 1 | 1.20mi |
| 10509 El Rancho Dr Whittier, CA | 3.0 | 1.0 | 960 | $900 | $0.94 | 24d | 1 | 1.20mi |
| 13421 Penn St Apt 11 Whittier, CA | 2.0 | 2.0 | 898 | $2,400 | $2.67 | 4d | 1 | 1.21mi |
| 7901 Duchess Dr Whittier, CA | 1.0–2.0 | 1.0–2.0 | 853 | $2,495 | $2.92 | 24d | 2 | 1.22mi |
| 8121 Broadway Ave Whittier, CA | 1.0–3.0 | 1.0–2.0 | 779 | $2,504 | $3.21 | 1d | 8 | 1.31mi |
| 13602 Mar Vista St Whittier, CA | 1.0–2.0 | 1.0–2.0 | 777 | $2,750 | $3.54 | 3d | 6 | 1.33mi |
| 7411 Norwalk Blvd Whittier, CA | 2.0 | 2.0 | 995 | $2,500 | $2.51 | 24d | 1 | 1.38mi |
| 8720 Villa Dr Unit 2 Whittier, CA | 3.0 | 2.0 | 1100 | $3,750 | $3.41 | 10d | 1 | 1.40mi |
| 13708 Via del Palma Ave Whittier, CA | 1.0–2.0 | 1.0–2.0 | 850 | $2,835 | $3.34 | 6d | 1 | 1.44mi |
| 13745 Via del Palma Ave Whittier, CA | 2.0 | 2.0 | 900 | $2,500 | $2.78 | 20d | 1 | 1.49mi |
Listing history 3 events
-
2026-06-18days on market $130,000 Active 2 DOM
-
2026-06-17remarks 699-char remark
-
2026-06-17$130,000 Active 1 DOM
ⓘ Source: listings_history table (triggers on properties + properties_extension) + one-shot
backfill from property_details.listing_events for pre-trigger history.
Tax reassessment forecast CA · Resets to sale price
- Current annual tax
- $418 · $35/mo
- Projected year-2 tax
- $988 · $82/mo
- Expected delta
- +$570/yr (+$48/mo · 136.6%)
ⓘ Screening estimate from a state-policy table — verify with the county assessor before closing.
Climate risk First Street
- Flood 1/10 Low FEMA zone X (unshaded) · 0% chance over 30 yrs
- Wildfire 5/10 Major
- Heat 6/10 Major 7 d/yr ≥95°F today · 21 d/yr by 30 yrs out
- Wind 1/10 Low
- Air quality 6/10 Major 9 unhealthy d/yr today · 10 by 30 yrs out
Nearby sold comps map
Loading sold comps map…
Walkable amenities ~0.75 mi
Loading nearby amenities…
Taxation est. · year 1
- Rental income
- $33,767
- − Mortgage interest
- −$7,282
- − Property taxes
- −$418
- − Insurance
- −$650
- − Repairs & maintenance
- −$2,701
- − Management
- −$2,701
- − Depreciation
- −$3,782
- Taxable income
- $16,233
- Est. tax owed @ 24.0%
- −$3,896
- After-tax cash flow
- $13,532/yr
For passive investors: Depreciation is non-cash, so a rental often shows a tax loss while cash-flowing — sheltering income. Rental losses are passive: they offset passive income freely, and up to $25,000/yr can offset ordinary (W-2) income if you actively participate and your MAGI is under $100k (phasing out to $0 by $150k); unused losses carry forward. On sale, claimed depreciation is recaptured at up to 25%, and gains may owe capital-gains tax (a 1031 exchange can defer both). Figures are a year-1 estimate at your 24.0% rate — not tax advice; consult a CPA.
Schools (NCES district)
- District
- Whittier Union High
- NCES district ID
- 0642480
- Math proficiency
- 42% ▲ 9.00%
- Reading proficiency
- 65% ▲ 7.00%
- Median HH income
- $66,675
- Composite
- 47.19/100
- National rank
- #2321
- State rank
- #111 of 517 in CA
Livability — West Whittier-Los Nietos
No livability data for this city. (Only ~50 U.S. cities are tracked.)
Census & demographics
- Census place
- West Whittier-Los Nietos, CA
- County
- Los Angeles County · 9,444,647 people
- City population
- 31,881
- Metro
- Los Angeles-Long Beach-Anaheim, CA
- Population (ZIP)
- 30,078
- Household income
- $104,052
- Rent vs Own
- Severe rent burden
- 1104.0
Population outlook (Los Angeles County) Hauer SSP2
- Today (2025)
- 10,940,515 people
- By 2030
- 11,256,481 · +2.9%
- By 2040
- 11,729,929 · +7.2%
- By 2050
- 11,948,407 · +9.2%
- By 2075
- 11,818,114 · +8.0%
- By 2100
- 10,842,928 · -0.9%
Race, ethnicity, and origin ACS 2023
- Neighborhood character
- Predominantly Hispanic (71%)
- Race & ethnicity
- Hispanic / Latino 71% Two or more races 19% White 18% Asian 5% Native American 3% Black 1%
- Hispanic origin (detail)
- Mexican 59%
- Common ancestry
- Lithuanian 2% Iranian 1% Slovak 1%
- Foreign-born
- 19% · Canada, China
- Languages at home
- 55% English-only · Spanish 39% Other Indo-European 2% Tagalog/Filipino 1%
Political lean MEDSL · Los Angeles
- 2024 margin
- Solid D (+32.9) · D 64.8% · R 31.9% · Other 3.3%
- 2008→2024 swing
- -7.4pp toward R · 2008: 40.4pp · 2024: 32.9pp
- All cycles
- 2024: D+32.9 2020: D+44.2 2016: D+48.0 2012: D+40.0 2008: D+40.4
Not yet ingested
- Civics
- —
Market trends
- HPI YoY
- ▼ -890.50%
- Current HPI
- 378.8101
- Rent YoY
- ▲ 3.39%
- Metro
- Los Angeles-Long Beach-Anaheim, CA
- State GDP YoY
- ▲ 3.21%
- F500 in state
- 116
Industry mix (Fortune 500 HQ in CA)
| Industry | F500 HQs | Revenue |
|---|---|---|
| Technology | 27 | $1,492B |
|
||
| Financial Services | 3 | $174B |
|
||
| Retail | 3 | $44B |
|
||
| Insurance | 3 | $26B |
|
||
| Media / Entertainment | 2 | $115B |
|
||
| Pharmaceuticals / Biotech | 2 | $62B |
|
||
Price history
+64.6% since first listed9 events — show timeline
- 2026-06-16 Listed $130,000 CRMLS
- 2009-03-31 Listing Removed — CRMLS
- 2008-10-31 Listed $35,900 CRMLS
- 2008-09-02 Listing Removed — CRMLS
- 2008-05-07 Listed $55,000 CRMLS
- 2007-04-07 Listing Removed — CRMLS
- 2007-01-06 Listed $115,000 CRMLS
- 2006-06-16 Sold (MLS) $55,000 CRMLS
- 2006-02-21 Listed $79,000 CRMLS
Property tax history
+10.3%/yrLatest (2025): $418 · +10.3% YoY. Source: county tax records.
Cash-flow waterfall
monthlySold comps — $/sqft
last 12 mo · ≤1 miLoading sold comps…