595 Road 3371a · Cleveland, TX
Flood risk 3/10 · Minor
- FEMA flood zone
- X (unshaded)
- Chance of flooding over 30 yrs
- 0.2%
- Est. flood insurance / yr
- $507 – $1,088
Fire risk 5/10 · Moderate
- Est. fire insurance / yr
- $1,222 – $2,270
Heat risk 9/10 · Severe
- Hot days now (above 111°F)
- 7 days/yr
- Hot days in 30 yrs
- 24 days/yr
Wind risk 8/10 · Major
- Chance of severe wind over 30 yrs
- 99.0%
Air-quality risk 2/10 · Minimal
- Unhealthy air days now
- 1 days/yr
- Unhealthy air days in 30 yrs
- 1 days/yr
Risk factors via First Street. Map © Google.
Why this score? — see what drove the D+ grade
The composite is a weighted blend of 9 inputs, each scored 0–100. Each bar is that input's sub-score; the figure is the points it added to the 100-point composite (weight × sub-score).
- Cash flow +24.5/30.0
- DSCR +7.9/10.0
- 1% rule +5.6/10.0
- Rent growth +3.5/5.0
- Livability +3.1/5.0
- Condition / age +2.5/5.0
- Schools +2.1/10.0
- ARV discount +0.0/15.0
- Appreciation +0.0/10.0
$152,000
🖨 Deal sheet (PDF) 📄 Offer letter ✓ Due diligence
Listing remarks MLS
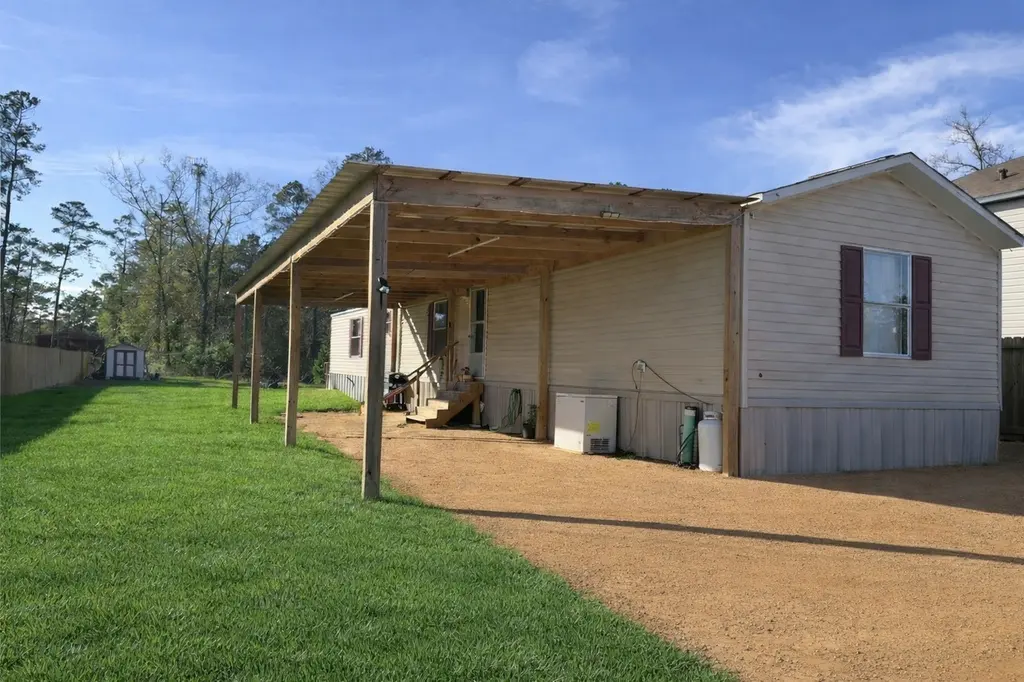
Charming and spacious! This inviting 3-bedroom, 2-bath mobile home features a bright open-concept living area that’s perfect for relaxing or entertaining. Set on a generous 0.492-acre, fully fenced lot, you’ll enjoy privacy, space for pets, outdoor fun, parking, or future projects in a quiet neighborhood. The large yard offers endless possibilities while the interior delivers comfortable, easy living. A great opportunity for homeowners or investors looking for space, value, and versatility!
Key facts
- Large yard
- Quiet neighborhood
- Fully fenced lot
Tags
Neighborhood map
What this means for you Summary
Snapshot
- This is a 3-bed/2.0-bath manufactured listed at $152k.
Deal economics
- At list price, monthly cash flow is $313 ($4k/yr) — positive.
- The deal already cash-flows at list — no discount required.
- Meets the 1% rule at list price ($2k rent vs $152k).
- Recommended offer: $134k (12.0% below list) — sets the bar for market timing.
- Cap rate 8.8% vs local median 4.7% in Cleveland — top-decile yield for the area; either an underpriced asset or a hidden risk that comps aren't pricing in. Stress-test before assuming the spread holds.
Location & tenants
- Location reads 61/100 on livability (#1,013 in TX) — a middle-class / working-renter tenant base. Strengths: cost of living A+, housing A+; Watch: schools F, crime D-, amenities F.
- Cleveland ISD (town): math 24% / reading 25% proficiency, ranked #723 of 826 in TX (top 88%) — low school quality limits family demand, transient renter base, plan for 1-2y turnover; 71% free/reduced lunch — lower-income household profile, screen leases tightly.
- Market conditions: Rents rising fast (+4.0%/yr); 1574 active listings in the ZIP; 1,321 units permitted in Liberty County in 2024 (0 in 5+ unit buildings).
- This rent runs 31% of the median local income ($62k/yr) — at the standard rent-burdened threshold; future hikes will face affordability resistance.
Forward outlook
- Local home prices are declining (-3.0%/yr); year-one equity from $1k of loan paydown is wiped out by about $5k of value loss. Plan a longer hold.
- Liberty County population projected at +24% by 2050 — long-run rental-demand tailwind backs the buy-and-hold thesis.
Negotiation context
- It's been on market 158 days — a 12% lower offer ($134k) is reasonable based on typical stale-listing flexibility.
- 3 sale attempts with the ask held roughly flat each time — persistent listings suggest the price (not the market) is what's stuck; bring a comps-based counter.
Risks & watch-outs
- Climate carrying-cost: severe wind risk, 99% chance of damaging wind over 30y; moderate wildfire risk; extreme-heat days projected 7→24/yr by 2055 (HVAC capex compounding) — expect insurance premiums to compound above CPI over the hold.
Questions for the listing agent
- It's been on market 158 days. Have you received any prior offers? Is the seller open to a 12% concession, seller financing, or rate buy-down credit?
- Why hasn't it sold? Are there any deal-killer items the seller is aware of (foundation, flood, title, zoning, code violations)?
- Is there a deadline driving the sale (1031 exchange, divorce, estate, relocation)? That informs how much negotiation room exists.
- Schools are F-rated, which usually means shorter tenancies and higher turnover. Who's the typical renter profile here, and what's been the actual vacancy rate?
- Crime grade is D in this area — have there been break-ins, vandalism, or insurance claims at this property in the last 3 years? What carrier currently insures it and at what premium?
- The area grade is low — what's the realistic commute time and amenity access for the typical tenant pool here? Any planned neighborhood developments (good or bad) we should know about?
- What's the average days-on-market for RENTAL listings here right now (not sales)? A rising rental-DOM trend means longer vacancies and softer asking-rent achievability than the comps imply.
- What's the recent tenant-quality profile in this submarket — average credit score on applications, eviction rate, late-payment / NSF rate, and stable-employment percentage? A property-management company in the area should have these aggregated.
- How much new for-sale + rental construction is in the pipeline within 1–3 miles? Heavy new supply typically softens prices + rents 12–24 months out; constrained supply supports both.
Investment metrics
- 1% rule
- 1.06% ✓
- Cap rate
- 8.76%
- Cash-on-cash
- 8.82%
- DSCR
- 1.39
- GRM
- 7.9
CMA / ARV
- ARV (median comp)
- $125,000
- List price
- $152,000
- Delta
- 21.60%
- Verdict
- OVERPRICED
- Comps
- 9 within 2.0 mi
Projected returns pro-forma
-3.0% appreciation · 4.0% rent growth · sell at horizon
- IRR
- -1.9%
- Equity multiple
- 0.93×
- Total profit
- $-3,102
- Equity at exit
- $22,664
- IRR
- 8.7%
- Equity multiple
- 1.70×
- Total profit
- $29,657
- Equity at exit
- $13,142
Cash invested: $42,560 (down + closing). Projections, not guarantees.
Landlord ↔ Tenant lean methodology
- Overall (STATE)
- 87 Strongly Landlord-Friendly
- State Texas
- 87 Strongly Landlord-Friendly · R+5
- County
- — inherits STATE
- City
- — inherits STATE
ZIP-level market 77327
- Home prices YoY
- -5.2%
- Rents YoY
- 4.0%
- Active inventory
- 1574
- Price-to-rent
- 7.9×
Monthly cashflow live
- Estimated rent
- $1,605 medium interval (Pro) →
- Mortgage (P&I)
- −$797
- Tax from tax record
- −$95 /mo · $1,138/yr
- Insurance
- −$63
- HOA
- −$0
- Vacancy / Maint / Mgmt
- −$337
- Net cashflow
- $313
Break-even live
Sensitivity live
| Price | -10% $399 | -5% $356 | +0% $313 | +5% $270 | +10% $227 |
|---|---|---|---|---|---|
| Rent | -10% $186 | -5% $250 | +0% $313 | +5% $376 | +10% $440 |
| Rate | -1.0pp $389 | -0.5pp $352 | base $313 | +0.5pp $274 | +1.0pp $233 |
UW: 25.0% down · 7.5% · 30yr · 1.5% tax · 5.0% vac · 8.0% maint · 8.0% mgmt
Financing live
Cash to close
- Down payment
- $38,000
- Closing costs
- $4,560
- Reserves months
- —
- Total cash needed
- —
Loan-product check · same deal, 3 products live
Conventional
25% down · 7.5% · 30yr
- Down + closing
- —
- Monthly P&I
- —
- Monthly cashflow
- —
- DSCR
- —
- Eligible?
- —
Personal DTI + credit; lowest rate.
DSCR
20% down · 8.5% · 30yr
- Down + closing
- —
- Monthly P&I
- —
- Monthly cashflow
- —
- DSCR
- —
- Eligible?
- —
No personal income docs; deal must DSCR.
Hard money
10% down · 12.0% · 12mo
- Down + closing
- —
- Monthly P&I
- —
- Monthly cashflow
- —
- DSCR
- —
- Eligible?
- —
Short-term bridge; refi at stabilization.
Listing history 19 events
-
2026-06-18days on market $152,000 Active 158 DOM
-
2026-06-17days on market $152,000 Active 157 DOM
-
2026-06-16days on market $152,000 Active 156 DOM
-
2026-06-15days on market $152,000 Active 155 DOM
-
2026-06-13days on market $152,000 Active 153 DOM
-
2026-06-09days on market $152,000 Active 149 DOM
-
2026-06-08days on market $152,000 Active 148 DOM
-
2026-06-07days on market $152,000 Active 147 DOM
-
2026-06-04days on market $152,000 Active 144 DOM
-
2026-06-03days on market $152,000 Active 143 DOM
-
2026-06-02days on market $152,000 Active 142 DOM
-
2026-06-01days on market $152,000 Active 141 DOM
-
2026-05-31days on market $152,000 Active 140 DOM
-
2026-01-11$152,000 Active 507-char remark
Show marketing remark (507 chars)
Charming and spacious! This inviting 3-bedroom, 2-bath mobile home features a bright open-concept living area that’s perfect for relaxing or entertaining. Set on a generous 0.492-acre, fully fenced lot, you’ll enjoy privacy, space for pets, outdoor fun, parking, or future projects in a quiet neighborhood. The large yard offers endless possibilities while the interior delivers comfortable, easy living. A great opportunity for homeowners or investors looking for space, value, and versatility!
-
2025-10-27historical
-
2025-10-09$160,000 Active
-
2025-10-08historical
-
2025-10-03price $160,000
-
2025-09-19$169,600 Active
ⓘ Source: listings_history table (triggers on properties + properties_extension) + one-shot
backfill from property_details.listing_events for pre-trigger history.
Tax reassessment forecast TX · Resets to sale price
- Current annual tax
- $1,138 · $95/mo
- Projected year-2 tax
- $2,782 · $232/mo
- Expected delta
- +$1,644/yr (+$137/mo · 144.4%)
ⓘ Screening estimate from a state-policy table — verify with the county assessor before closing.
Climate risk First Street
- Flood 3/10 Moderate FEMA zone X (unshaded) · 20% chance over 30 yrs
- Wildfire 5/10 Major
- Heat 9/10 Extreme 7 d/yr ≥111°F today · 24 d/yr by 30 yrs out
- Wind 8/10 Severe 99% chance of damaging wind over 30 yrs
- Air quality 2/10 Low 1 unhealthy d/yr today · 1 by 30 yrs out
Nearby sold comps map
Loading sold comps map…
Walkable amenities ~0.75 mi
Loading nearby amenities…
Taxation est. · year 1
- Rental income
- $19,264
- − Mortgage interest
- −$8,514
- − Property taxes
- −$1,138
- − Insurance
- −$760
- − Repairs & maintenance
- −$1,541
- − Management
- −$1,541
- − Depreciation
- −$4,422
- Taxable income
- $1,348
- Est. tax owed @ 24.0%
- −$323
- After-tax cash flow
- $3,432/yr
For passive investors: Depreciation is non-cash, so a rental often shows a tax loss while cash-flowing — sheltering income. Rental losses are passive: they offset passive income freely, and up to $25,000/yr can offset ordinary (W-2) income if you actively participate and your MAGI is under $100k (phasing out to $0 by $150k); unused losses carry forward. On sale, claimed depreciation is recaptured at up to 25%, and gains may owe capital-gains tax (a 1031 exchange can defer both). Figures are a year-1 estimate at your 24.0% rate — not tax advice; consult a CPA.
Schools (NCES district)
- District
- Cleveland ISD
- NCES district ID
- 4814370
- Math proficiency
- 24% ▼ -13.00%
- Reading proficiency
- 25% ▼ -4.00%
- Median HH income
- $39,173
- Composite
- 20.61/100
- National rank
- #8549
- State rank
- #723 of 826 in TX
Livability — Cleveland
- Score
- 61/100
- State rank
- #1013
- US rank
- #17943
Category grades
Schools grade is shown separately in the Schools card above.
Census & demographics
- County
- Liberty County · 82,189 people
- City population
- 17,208
- Metro
- Houston-The Woodlands-Sugar Land, TX
- Population (ZIP)
- 42,685
- Household income
- $62,219
- Rent vs Own
- Severe rent burden
- 437.0
Population outlook (Liberty County) Hauer SSP2
- Today (2025)
- 87,956 people
- By 2030
- 92,161 · +4.8%
- By 2040
- 100,784 · +14.6%
- By 2050
- 109,471 · +24.5%
- By 2075
- 133,470 · +51.7%
- By 2100
- 147,372 · +67.6%
Race, ethnicity, and origin ACS 2023
- Neighborhood character
- Diverse neighborhood (Simpson 0.57)
- Race & ethnicity
- Hispanic / Latino 54% White 36% Two or more races 18% Black 8% Native American 2%
- Hispanic origin (detail)
- Mexican 42%
- Common ancestry
- Lithuanian 2% Serbian 1% Slovak 0%
- Foreign-born
- 22% · Canada
- Languages at home
- 51% English-only · Spanish 48%
Political lean MEDSL · Liberty
- 2024 margin
- Solid R (+61.6) · D 19.0% · R 80.6%
- 2008→2024 swing
- -17.9pp toward R · 2008: -43.7pp · 2024: -61.6pp
- All cycles
- 2024: R+61.6 2020: R+59.7 2016: R+58.0 2012: R+53.3 2008: R+43.7
Not yet ingested
- Civics
- —
Market trends
- HPI YoY
- ▼ -12.39%
- Current HPI
- 224.9222
- Rent YoY
- ▲ 4.00%
- Metro
- Houston-The Woodlands-Sugar Land, TX
- State GDP YoY
- ▲ 3.95%
- F500 in state
- 110
Industry mix (Fortune 500 HQ in TX)
| Industry | F500 HQs | Revenue |
|---|---|---|
| Energy | 16 | $1,198B |
|
||
| Technology | 5 | $198B |
|
||
| Engineering / Construction | 4 | $72B |
|
||
| Energy Services | 3 | $60B |
|
||
| Utilities | 3 | $41B |
|
||
| Healthcare | 2 | $330B |
|
||
Price history
-10.4% since first listed6 events — show timeline
- 2026-01-11 Listed $152,000 HARMLS
- 2025-10-27 Listing Removed — HARMLS
- 2025-10-09 Listed $160,000 HARMLS
- 2025-10-08 Listing Removed — HARMLS
- 2025-10-03 Price Changed $160,000 HARMLS
- 2025-09-19 Listed $169,600 HARMLS
Property tax history
+10.8%/yrLatest (2025): $1,138 · +11.2% YoY. Source: county tax records.
Cash-flow waterfall
monthlySold comps — $/sqft
last 12 mo · ≤1 miLoading sold comps…