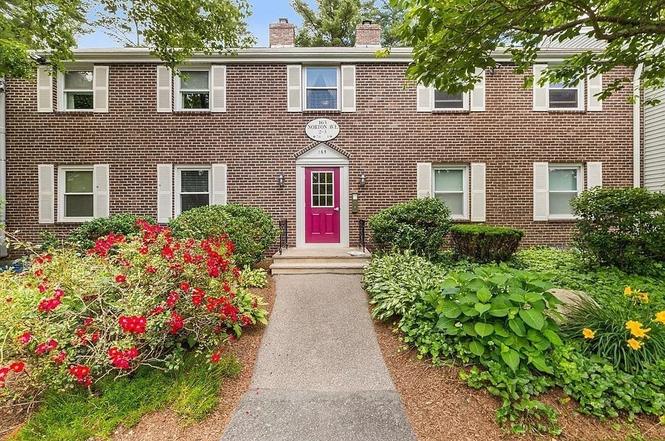
165 Norton Ave #5 · Easton, MA
Flood risk 1/10 · Minimal
- FEMA flood zone
- X (unshaded)
- Chance of flooding over 30 yrs
- 0.0%
- Est. flood insurance / yr
- $473 – $860
Fire risk 2/10 · Minimal
- Est. fire insurance / yr
- $915 – $1,699
Heat risk 5/10 · Moderate
- Hot days now (above 97°F)
- 7 days/yr
- Hot days in 30 yrs
- 15 days/yr
Wind risk 6/10 · Moderate
- Chance of severe wind over 30 yrs
- 67.0%
Air-quality risk 2/10 · Minimal
- Unhealthy air days now
- 2 days/yr
- Unhealthy air days in 30 yrs
- 2 days/yr
Risk factors via First Street. Map © Google.
Why this score? — see what drove the D+ grade
The composite is a weighted blend of 9 inputs, each scored 0–100. Each bar is that input's sub-score; the figure is the points it added to the 100-point composite (weight × sub-score).
- Cash flow +16.5/30.0
- ARV discount +7.5/15.0
- Schools +5.2/10.0
- DSCR +5.1/10.0
- 1% rule +4.8/10.0
- Rent growth +2.5/5.0
- Livability +2.5/5.0
- Condition / age +2.5/5.0
- Appreciation +0.0/10.0
$369,900
🖨 Deal sheet 📄 Offer letter ✓ Due diligence
Listing remarks MLS
ROLLING PINES CONDO WITH 2 LARGE BEDROOMS,COUNRY KITCHEN AND DINING ROOM, WOOD STOVE EXTREMELY NEAT UNIT ,C/A , TENNIS COURT, SWIMMING POOL, CLUB HOUSE. JUST IN TIME FOR SUMMER RELAXING. NO SHOWING TILL 3-23-00.
Key facts
- Private deck
- Private storage unit
- In-home office
Tags
Property features AI
Finance
- HOA & community: Monthly association fee of $320.25; Association covers water, sewer, insurance, structure maintenance, road maintenance, grounds maintenance, snow removal, and trash; Community amenities include pool, laundry, and tennis courts
Exterior
- Parking: Two off-street parking spaces
- Utilities: Public water; Private sewer; 110 volt electric (for electric range)
- Home design: Condominium (Garden-style); One-story building; Entry level 2
- Construction: Frame construction; Shingle roof; Building name: Rolling Pines; Built (approximate) per public records
- Exterior features: Wood deck
Interior
- Kitchen: Laminate flooring; Pantry; Range; Dishwasher; Disposal; Refrigerator
- Bedrooms: Master bedroom on first floor with closet and wall-to-wall carpet; Second bedroom on first floor with closet and wall-to-wall carpet
- Flooring: Wall-to-wall carpet in bedrooms; Laminate flooring in living areas, dining room, kitchen, and bathroom
- Bathrooms: One full bathroom with laminate flooring; Master bathroom present
- Heating & cooling: Heat pump; Wood stove; Central air
- Interior features: Insulated windows; Walk-up attic; Wood / Coal / Pellet stove in living room; Ceiling fans in living areas and bedrooms
- Laundry & utility: Laundry facilities in basement and common area (in building)
Neighborhood map
What this means for you Summary
Snapshot
- This is a 2-bed/1.0-bath condo listed at $370k.
Deal economics
- At list price, monthly cash flow is $215 ($3k/yr) — positive.
- The deal already cash-flows at list — no discount required.
- To meet the 1% rule (rent ≥ 1% of price), the offer needs to be $362k (2.1% below list).
- Recommended offer: $362k (2.1% below list) — sets the bar for 1% rule.
Location & tenants
- Location reads: area grade D — affects rentability + tenant quality, not the cash-flow math above.
- Easton (suburban): math 51% / reading 60% proficiency, ranked #76 of 302 in MA (top 25%) — acceptable for families but not a draw, mixed tenant base, ~2y average lease; only 10% free/reduced lunch — higher-income household profile.
- Market conditions: 27 active listings in the ZIP; 1 comparable units currently listed for rent nearby; 760 units permitted in Bristol County in 2024 (142 in 5+ unit buildings).
Forward outlook
- Local home prices are declining (-3.0%/yr); year-one equity from $3k of loan paydown is wiped out by about $11k of value loss. Plan a longer hold.
- Bristol County population projected to shrink 3% by 2050 — rents likely to lag national; underwrite the cash flow, not the appreciation.
Negotiation context
- Only 6 days on market — expect competitive offers; lowballing is unlikely to land.
- 2 sale attempts since 26y ago with the ask held roughly flat each time — persistent listings suggest the price (not the market) is what's stuck; bring a comps-based counter.
- Current owner paid $94k; list at $370k implies a 291% gain — meaningful room to come down on a strong offer.
Risks & watch-outs
- Climate carrying-cost: major wind risk, 67% chance of damaging wind over 30y; extreme-heat days projected 7→15/yr by 2055 (HVAC capex compounding) — expect insurance premiums to compound above CPI over the hold.
Questions for the listing agent
- Built in 1974 — when were the roof, HVAC, electrical panel, plumbing, and water heater last replaced?
- What does the HOA fee cover, when was the last increase, and are there any pending special assessments or reserve-fund shortfalls?
- Any open or pending special assessments — roof, HVAC, plumbing, elevator, façade? What's the per-unit balance and payoff schedule, and is the seller paying it off at close or rolling it to the buyer?
- Is there a deadline driving the sale (1031 exchange, divorce, estate, relocation)? That informs how much negotiation room exists.
- The area grade is low — what's the realistic commute time and amenity access for the typical tenant pool here? Any planned neighborhood developments (good or bad) we should know about?
- What's the average days-on-market for RENTAL listings here right now (not sales)? A rising rental-DOM trend means longer vacancies and softer asking-rent achievability than the comps imply.
- What's the recent tenant-quality profile in this submarket — average credit score on applications, eviction rate, late-payment / NSF rate, and stable-employment percentage? A property-management company in the area should have these aggregated.
- How much new apartment / multifamily construction is in the pipeline within 1–3 miles? Heavy new supply (>2% of stock underway) typically softens rents 12–24 months out; light construction supports rent growth.
Investment metrics
- 1% rule
- 0.98% ✗
- Cap rate
- 6.99%
- Cash-on-cash
- 2.49%
- DSCR
- 1.11
- GRM
- 8.5
CMA / ARV
No comps found within radius.
Projected returns pro-forma
-3.0% appreciation · 3.0% rent growth · sell at horizon
- IRR
- -12.3%
- Equity multiple
- 0.55×
- Total profit
- $-46,158
- Equity at exit
- $55,153
- IRR
- -3.2%
- Equity multiple
- 0.79×
- Total profit
- $-22,142
- Equity at exit
- $31,982
Cash invested: $103,572 (down + closing). Projections, not guarantees.
Landlord ↔ Tenant lean methodology
- Overall (STATE)
- 20 Strongly Tenant-Friendly
- State Massachusetts
- 20 Strongly Tenant-Friendly · D+15
- County
- — inherits STATE
- City
- — inherits STATE
ZIP-level market 02375
- Home prices YoY
- -17.9%
- Active inventory
- 27
- Price-to-rent
- 8.5×
Monthly cashflow live
- Estimated rent
- $3,621 medium interval (Pro) →
- Mortgage (P&I)
- −$1,940
- Tax from tax record
- −$232 /mo · $2,784/yr
- Insurance
- −$154
- HOA
- −$320
- Vacancy / Maint / Mgmt
- −$760
- Net cashflow
- $215
Break-even live
UW: 25.0% down · 7.5% · 30yr · 1.5% tax · 5.0% vac · 8.0% maint · 8.0% mgmt
Financing live
Cash to close
- Down payment
- $92,475
- Closing costs
- $11,097
- Reserves months
- —
- Total cash needed
- —
Loan-product check · same deal, 3 products live
Conventional
25% down · 7.5% · 30yr
- Down + closing
- —
- Monthly P&I
- —
- Monthly cashflow
- —
- DSCR
- —
- Eligible?
- —
Personal DTI + credit; lowest rate.
DSCR
20% down · 8.5% · 30yr
- Down + closing
- —
- Monthly P&I
- —
- Monthly cashflow
- —
- DSCR
- —
- Eligible?
- —
No personal income docs; deal must DSCR.
Hard money
10% down · 12.0% · 12mo
- Down + closing
- —
- Monthly P&I
- —
- Monthly cashflow
- —
- DSCR
- —
- Eligible?
- —
Short-term bridge; refi at stabilization.
Rent comps 1 comps
| Address | Beds | Baths | Sqft | Rent | $/sqft | DOM | Units | Dist |
|---|---|---|---|---|---|---|---|---|
| 60 Robert Dr South Easton, MA | 1.0–3.0 | 1.0–2.5 | 1304 | $3,621 | $2.78 | 1d | 1 | 1.21mi |
HOA detail condo
- Monthly dues
- $320 · $3,840/yr
- Likely covers
- pool
- Assessments
- None detected in remarks — confirm with the listing agent.
Listing history 6 events
-
2026-06-18days on market $369,900 Active 6 DOM
-
2026-06-17days on market $369,900 Active 5 DOM
-
2026-06-16statusdays on market $369,900 Active 4 DOM
-
2026-06-15days on market $369,900 New 3 DOM
-
2026-06-13remarks 626-char remark
-
2026-06-13$369,900 New 1 DOM
ⓘ Source: listings_history table (triggers on properties + properties_extension) + one-shot
backfill from property_details.listing_events for pre-trigger history.
Tax reassessment forecast MA · Partial reset (capped growth)
- Current annual tax
- $2,784 · $232/mo
- Projected year-2 tax
- $3,667 · $306/mo
- Expected delta
- +$883/yr (+$74/mo · 31.7%)
ⓘ Screening estimate from a state-policy table — verify with the county assessor before closing.
Climate risk First Street
- Flood 1/10 Low FEMA zone X (unshaded) · 0% chance over 30 yrs
- Wildfire 2/10 Low
- Heat 5/10 Major 7 d/yr ≥97°F today · 15 d/yr by 30 yrs out
- Wind 6/10 Major 67% chance of damaging wind over 30 yrs
- Air quality 2/10 Low 2 unhealthy d/yr today · 2 by 30 yrs out
Nearby sold comps map
Loading sold comps map…
Walkable amenities ~0.75 mi
Loading nearby amenities…
Taxation est. · year 1
- Rental income
- $43,452
- − Mortgage interest
- −$20,720
- − Property taxes
- −$2,784
- − Insurance
- −$1,850
- − Repairs & maintenance
- −$3,476
- − Management
- −$3,476
- − HOA
- −$3,840
- − Depreciation
- −$10,761
- Taxable loss
- −$3,455
- Est. tax savings @ 24.0%
- +$829
- After-tax cash flow
- $3,405/yr
For passive investors: Depreciation is non-cash, so a rental often shows a tax loss while cash-flowing — sheltering income. Rental losses are passive: they offset passive income freely, and up to $25,000/yr can offset ordinary (W-2) income if you actively participate and your MAGI is under $100k (phasing out to $0 by $150k); unused losses carry forward. On sale, claimed depreciation is recaptured at up to 25%, and gains may owe capital-gains tax (a 1031 exchange can defer both). Figures are a year-1 estimate at your 24.0% rate — not tax advice; consult a CPA.
Schools (NCES district)
- District
- Easton
- NCES district ID
- 2504620
- Math proficiency
- 51% ▼ -15.00%
- Reading proficiency
- 60% ▼ -7.00%
- Median HH income
- $94,017
- Composite
- 51.52/100
- National rank
- #1719
- State rank
- #76 of 302 in MA
Livability — Easton
No livability data for this city. (Only ~50 U.S. cities are tracked.)
Census & demographics
- Population (ZIP)
- 11,205
Population outlook (Bristol County) Hauer SSP2
- Today (2025)
- 570,212 people
- By 2030
- 571,181 · +0.2%
- By 2040
- 565,389 · -0.8%
- By 2050
- 552,141 · -3.2%
- By 2075
- 520,923 · -8.6%
- By 2100
- 474,363 · -16.8%
Race, ethnicity, and origin ACS 2023
- Neighborhood character
- Predominantly White (78%)
- Race & ethnicity
- White 78% Two or more races 8% Black 6% Hispanic / Latino 5% Asian 4%
- Hispanic origin (detail)
- Puerto Rican 2%
- Common ancestry
- Russian 6% Slovak 4% Lithuanian 3%
- Foreign-born
- 10% · Canada, Vietnam, China
- Languages at home
- 88% English-only · Other Indo-European 3% French/Haitian/Cajun 3% Spanish 2%
Political lean MEDSL · Bristol
- 2024 margin
- Toss-up / Even · D 49.8% · R 48.5% · Other 1.8%
- 2008→2024 swing
- -21.9pp toward R · 2008: 23.2pp · 2024: 1.3pp
- All cycles
- 2024: D+1.3 2020: D+12.0 2016: D+9.3 2012: D+20.5 2008: D+23.2
Not yet ingested
- Civics
- —
Market trends
- HPI YoY
- ▼ -68.89%
- Current HPI
- 317.0994
- Rent YoY
- —
- Metro
- —
- State GDP YoY
- ▲ 2.28%
- F500 in state
- 38
Industry mix (Fortune 500 HQ in MA)
| Industry | F500 HQs | Revenue |
|---|---|---|
| Technology | 3 | $17B |
|
||
| Insurance | 2 | $84B |
|
||
| Retail | 2 | $76B |
|
||
| Life Sciences | 1 | $43B |
|
||
| Energy Technology | 1 | $31B |
|
||
| Aerospace / Defense | 1 | $18B |
|
||
Price history
+639.8% since first listed8 events — show timeline
- 2026-06-12 Listed $369,900 MLS PIN
- 2001-01-02 Sold (Public Records) $94,500 Public Records
- 2000-05-16 Sold (Public Records) $87,900 Public Records
- 2000-05-16 Sold (MLS) $87,900 MLS PIN
- 2000-03-24 Listing Removed — MLS PIN
- 2000-03-17 Listed $87,900 MLS PIN
- 1987-02-27 Sold (Public Records) $98,000 Public Records
- 1984-10-26 Sold (Public Records) $50,000 Public Records
Property tax history
+2.0%/yrLatest (2023): $2,784 · +8.7% YoY. Source: county tax records.
Cash-flow waterfall
monthlySold comps — $/sqft
last 12 mo · ≤1 miLoading sold comps…