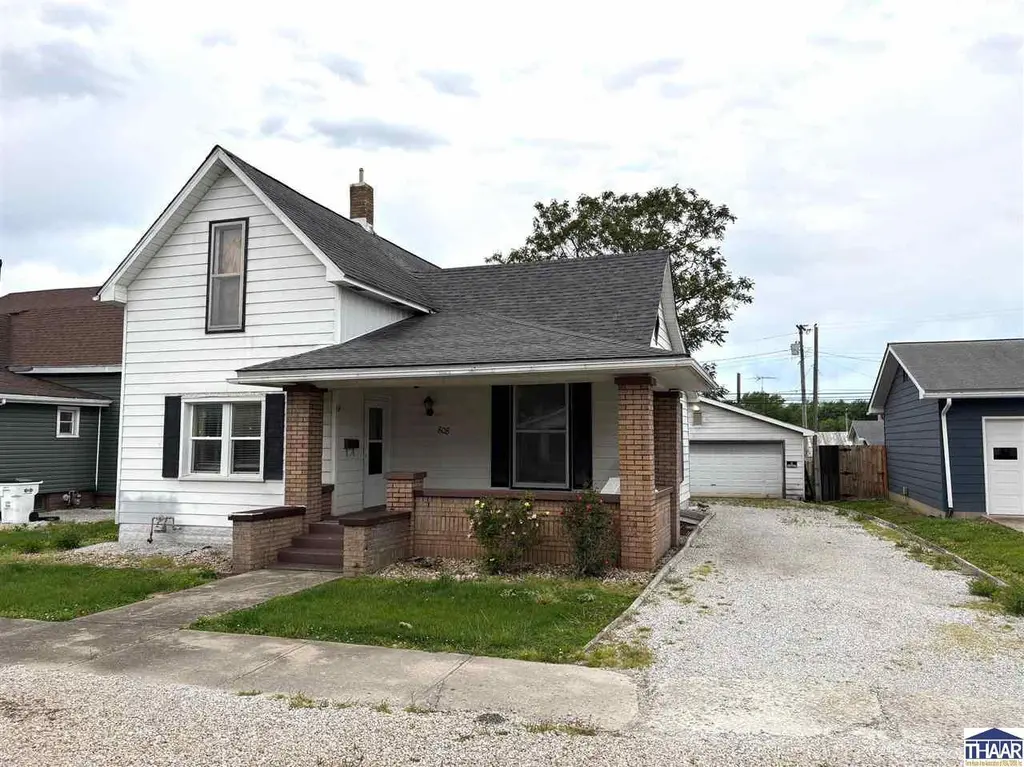
808 Washington St · Clay City, IN
Flood risk 1/10 · Minimal
- FEMA flood zone
- X (unshaded)
- Chance of flooding over 30 yrs
- 0.0%
- Est. flood insurance / yr
- $473 – $860
Fire risk 1/10 · Minimal
- Est. fire insurance / yr
- $717 – $1,331
Heat risk 4/10 · Minor
- Hot days now (above 104°F)
- 7 days/yr
- Hot days in 30 yrs
- 19 days/yr
Wind risk 2/10 · Minimal
- Chance of severe wind over 30 yrs
- 1.0%
Air-quality risk 2/10 · Minimal
- Unhealthy air days now
- 1 days/yr
- Unhealthy air days in 30 yrs
- 2 days/yr
Risk factors via First Street. Map © Google.
Why this score? — see what drove the B- grade
The composite is a weighted blend of 9 inputs, each scored 0–100. Each bar is that input's sub-score; the figure is the points it added to the 100-point composite (weight × sub-score).
- Cash flow +20.3/30.0
- ARV discount +15.0/15.0
- Appreciation +8.5/10.0
- DSCR +6.5/10.0
- 1% rule +5.4/10.0
- Schools +4.0/10.0
- Livability +3.4/5.0
- Rent growth +2.5/5.0
- Condition / age +2.5/5.0
$120,000
🖨 Deal sheet 📄 Offer letter ✓ Due diligence
Listing remarks
* Motivated sellers - bring us an offer! * Welcome to this functional 3 bedroom, 1 bath home that offers over 1800 square feet that is ready for your updates. The main floor layout features a living room, formal dining room, kitchen, 2 bedrooms, a full bath, and a large mudroom/laundry area just inside the back door. Upstairs there is another bedroom and a bonus room area. This home also offers a partial unfinished basement for storage space. Outside, enjoy a fully fenced backyard - complete with a large storage shed. A gravel driveway offers off-street parking and there is a 24x24 garage for all of your projects. The covered front porch adds a welcoming touch, perfect for morning coffee o
Key facts
- Mudroom laundry area
- Formal dining room
- Kitchen
Tags
Property features AI
Exterior
- Parking: 2-car garage; Gravel parking
- Utilities: Public sewer
- Home design: Single-family residential; 2 stories
- Construction: Shingle roof
- Exterior features: Covered porch/patio; Shingle roof
Interior
- Kitchen: Electric range; Electric oven; Refrigerator
- Bathrooms: 1 full bathroom
- Heating & cooling: Natural gas heating; Central air; Wall/window AC units
- Interior features: Electric range, electric oven, refrigerator; Partial basement with crawl space
Neighborhood map
What this means for you Summary
Snapshot
- This is a 4-bed/2.0-bath single-family listed at $120k.
Deal economics
- At list price, monthly cash flow is $155 ($2k/yr) — positive.
- The deal already cash-flows at list — no discount required.
- Meets the 1% rule at list price ($1k rent vs $120k).
- Recommended offer: $116k (3.0% below list) — sets the bar for market timing.
Location & tenants
- Location reads 67/100 on livability (#257 in IN) — a middle-class / working-renter tenant base. Strengths: crime A+, cost of living A+, housing A+; Watch: amenities F, commute F, health & safety F.
- Clay Community Schools (rural): math 46% / reading 49% proficiency, ranked #79 of 301 in IN (top 26%) — families likely to look elsewhere, expect single-tenant / working-renter base with shorter leases.
- Zoned schools: Clay City Elementary School (math 58% / reading 54%, grade C+, #183 of 994 statewide, top 19%, 377 students, 51% FRL); Clay City Jr-Sr High School (math 32% / reading 47%, grade F, #221 of 369 statewide, top 63%, 365 students, 44% FRL) — zoned schools at 48% FRL track the district average.
- Market conditions: 6 active listings in the ZIP; 70 units permitted in Clay County in 2024 (0 in 5+ unit buildings).
Forward outlook
- In year one you build about $9k of equity ($830 loan paydown + $8k appreciation (7.1% local appreciation)).
- Clay County population projected at -16% by 2050 — secular population decline; favor cash flow + early exit over multi-decade hold.
- At projected returns (7.1% appreciation + 3.0% rent growth), your $34k cash investment doubles in ~3 years — after that, you're playing with house money.
- By year 4, paydown + projected appreciation supports a ~$32k cash-out refi (75% LTV) — recoverable capital for the next deal without selling this one.
Negotiation context
- It's been on market 46 days — a 3% lower offer ($116k) is reasonable based on typical stale-listing flexibility.
Risks & watch-outs
- Watch-outs: built in 1900 — expect roof / HVAC / electrical / plumbing capex.
Questions for the listing agent
- It's been on market 46 days. Have you received any prior offers? Is the seller open to a 3% concession, seller financing, or rate buy-down credit?
- Built in 1900 — when were the roof, HVAC, electrical panel, plumbing, and water heater last replaced?
- Is there a deadline driving the sale (1031 exchange, divorce, estate, relocation)? That informs how much negotiation room exists.
- What's the average days-on-market for RENTAL listings here right now (not sales)? A rising rental-DOM trend means longer vacancies and softer asking-rent achievability than the comps imply.
- What's the recent tenant-quality profile in this submarket — average credit score on applications, eviction rate, late-payment / NSF rate, and stable-employment percentage? A property-management company in the area should have these aggregated.
- How much new for-sale + rental construction is in the pipeline within 1–3 miles? Heavy new supply typically softens prices + rents 12–24 months out; constrained supply supports both.
Investment metrics
- 1% rule
- 1.04% ✓
- Cap rate
- 7.84%
- Cash-on-cash
- 5.53%
- DSCR
- 1.25
- GRM
- 8.0
CMA / ARV
- ARV (median comp)
- $144,498
- List price
- $120,000
- Delta
- -16.95%
- Verdict
- UNDERPRICED
- Comps
- 16 within 1.0 mi
Show comp detail 3 sales within ~0.75 mi
| Address | Dist | Beds/Ba | Sqft | Sold | Price | $/sf | Match |
|---|---|---|---|---|---|---|---|
| 308 Washington St | 0.39mi | 4/2.0 | 1,725 (+1%) | 22mo | $172,500 | $100 | 63 |
| 165 E County Road 750 S | 0.28mi | 3/2.5 (-1) | 1,832 (+7%) | 14mo | $175,000 | $96 | 57 |
| 207 Main St | 0.47mi | 3/2.5 (-1) | 1,708 (-0%) | 21mo | $215,000 | $126 | 53 |
Match score weights: distance 35% · size 25% · config 20% · recency 20%. Top-matched comps best support the ARV.
Projected returns pro-forma
7.06% appreciation · 3.0% rent growth · sell at horizon
- IRR
- 22.2%
- Equity multiple
- 2.55×
- Total profit
- $52,199
- Equity at exit
- $83,601
- IRR
- 20.7%
- Equity multiple
- 5.30×
- Total profit
- $144,344
- Equity at exit
- $159,208
Cash invested: $33,600 (down + closing). Projections, not guarantees.
Landlord ↔ Tenant lean methodology
- Overall (STATE)
- 90 Strongly Landlord-Friendly
- State Indiana
- 90 Strongly Landlord-Friendly · R+11
- County
- — inherits STATE
- City
- — inherits STATE
ZIP-level market 47841
- Home prices YoY
- 2.9%
- Active inventory
- 6
- Price-to-rent
- 8.0×
Monthly cashflow live
- Estimated rent
- $1,246 medium interval (Pro) →
- Mortgage (P&I)
- −$629
- Tax est. 1.5%
- −$150 /mo · $1,800/yr
- Insurance
- −$50
- HOA
- −$0
- Vacancy / Maint / Mgmt
- −$262
- Net cashflow
- $155
Break-even live
UW: 25.0% down · 7.5% · 30yr · 1.5% tax · 5.0% vac · 8.0% maint · 8.0% mgmt
Financing live
Cash to close
- Down payment
- $30,000
- Closing costs
- $3,600
- Reserves months
- —
- Total cash needed
- —
Loan-product check · same deal, 3 products live
Conventional
25% down · 7.5% · 30yr
- Down + closing
- —
- Monthly P&I
- —
- Monthly cashflow
- —
- DSCR
- —
- Eligible?
- —
Personal DTI + credit; lowest rate.
DSCR
20% down · 8.5% · 30yr
- Down + closing
- —
- Monthly P&I
- —
- Monthly cashflow
- —
- DSCR
- —
- Eligible?
- —
No personal income docs; deal must DSCR.
Hard money
10% down · 12.0% · 12mo
- Down + closing
- —
- Monthly P&I
- —
- Monthly cashflow
- —
- DSCR
- —
- Eligible?
- —
Short-term bridge; refi at stabilization.
Listing history 18 events
-
2026-06-19days on market $120,000 Active 46 DOM
-
2026-06-18days on market $120,000 Active 45 DOM
-
2026-06-17days on market $120,000 Active 44 DOM
-
2026-06-16days on market $120,000 Active 43 DOM
-
2026-06-15days on market $120,000 Active 42 DOM
-
2026-06-14days on market $120,000 Active 40 DOM
-
2026-06-13days on market $120,000 Active 39 DOM
-
2026-06-10days on market $120,000 Active 37 DOM
-
2026-06-09days on market $120,000 Active 36 DOM
-
2026-06-08days on market $120,000 Active 35 DOM
-
2026-06-07days on market $120,000 Active 34 DOM
-
2026-06-05days on market $120,000 Active 31 DOM
-
2026-06-02days on market $120,000 Active 29 DOM
-
2026-06-01pricedays on market $120,000 Active 28 DOM
-
2026-05-31days on market $130,000 Active 27 DOM
-
2026-05-30days on market $130,000 Active 26 DOM
-
2026-05-17price $130,000 770-char remark
-
2026-05-04$150,000 Active 770-char remark
ⓘ Source: listings_history table (triggers on properties + properties_extension) + one-shot
backfill from property_details.listing_events for pre-trigger history.
Climate risk First Street
- Flood 1/10 Low FEMA zone X (unshaded) · 0% chance over 30 yrs
- Wildfire 1/10 Low
- Heat 4/10 Moderate 7 d/yr ≥104°F today · 19 d/yr by 30 yrs out
- Wind 2/10 Low 100% chance of damaging wind over 30 yrs
- Air quality 2/10 Low 1 unhealthy d/yr today · 2 by 30 yrs out
Nearby sold comps map
Loading sold comps map…
Walkable amenities ~0.75 mi
Loading nearby amenities…
Taxation est. · year 1
- Rental income
- $14,948
- − Mortgage interest
- −$6,722
- − Property taxes
- −$1,800
- − Insurance
- −$600
- − Repairs & maintenance
- −$1,196
- − Management
- −$1,196
- − Depreciation
- −$3,491
- Taxable loss
- −$56
- Est. tax savings @ 24.0%
- +$13
- After-tax cash flow
- $1,871/yr
For passive investors: Depreciation is non-cash, so a rental often shows a tax loss while cash-flowing — sheltering income. Rental losses are passive: they offset passive income freely, and up to $25,000/yr can offset ordinary (W-2) income if you actively participate and your MAGI is under $100k (phasing out to $0 by $150k); unused losses carry forward. On sale, claimed depreciation is recaptured at up to 25%, and gains may owe capital-gains tax (a 1031 exchange can defer both). Figures are a year-1 estimate at your 24.0% rate — not tax advice; consult a CPA.
Schools (NCES district)
- District
- Clay Community Schools
- NCES district ID
- 1800840
- Math proficiency
- 46% ▼ -6.00%
- Reading proficiency
- 49% ▼ -1.00%
- Median HH income
- $46,673
- Composite
- 40.39/100
- National rank
- #3733
- State rank
- #79 of 301 in IN
Livability — Clay City
- Score
- 67/100
- State rank
- #257
- US rank
- #10872
Category grades
Schools grade is shown separately in the Schools card above.
Census & demographics
- Census place
- Clay City, IN
- City population
- 2,546
- Population (ZIP)
- 2,546
Population outlook (Clay County) Hauer SSP2
- Today (2025)
- 25,820 people
- By 2030
- 25,182 · -2.5%
- By 2040
- 23,562 · -8.7%
- By 2050
- 21,829 · -15.5%
- By 2075
- 17,939 · -30.5%
- By 2100
- 14,042 · -45.6%
Race, ethnicity, and origin ACS 2023
- Neighborhood character
- Predominantly White (94%)
- Race & ethnicity
- White 94% Two or more races 4% Hispanic / Latino 1%
- Common ancestry
- Lithuanian 3% Italian 2% Iranian 1%
- Foreign-born
- 1%
Political lean MEDSL · Clay
- 2024 margin
- Solid R (+56.9) · D 20.7% · R 77.6% · Other 1.7%
- 2008→2024 swing
- -45.4pp toward R · 2008: -11.5pp · 2024: -56.9pp
- All cycles
- 2024: R+56.9 2020: R+56.6 2016: R+55.3 2012: R+31.4 2008: R+11.5
Not yet ingested
- Civics
- —
Market trends
- HPI YoY
- ▲ 7.06%
- Current HPI
- 250.0742
- Rent YoY
- —
- Metro
- —
- State GDP YoY
- ▲ 2.90%
- F500 in state
- 18
Industry mix (Fortune 500 HQ in IN)
| Industry | F500 HQs | Revenue |
|---|---|---|
| Industrial Machinery | 2 | $37B |
|
||
| Healthcare | 1 | $177B |
|
||
| Pharmaceuticals | 1 | $45B |
|
||
| Metals / Steel | 1 | $18B |
|
||
| Agriculture | 1 | $17B |
|
||
| Packaging | 1 | $12B |
|
||
Price history
-20.0% since first listed3 events — show timeline
- 2026-06-01 Price Changed $120,000 THAAR
- 2026-05-17 Price Changed $130,000 THAAR
- 2026-05-04 Listed $150,000 THAAR
Property tax history
-3.3%/yrLatest (2024): $162 · -26.7% YoY. Source: county tax records.
Cash-flow waterfall
monthlySold comps — $/sqft
last 12 mo · ≤1 miLoading sold comps…