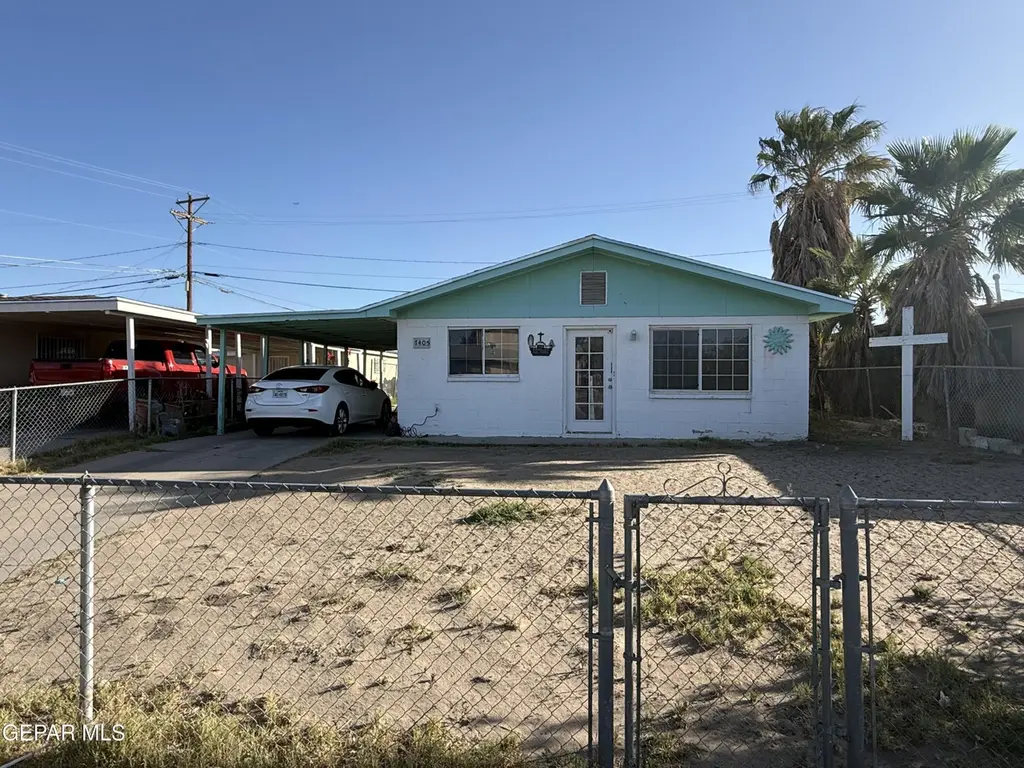
7405 Mimosa Ave · El Paso, TX
Flood risk 5/10 · Moderate
- FEMA flood zone
- AH
- Chance of flooding over 30 yrs
- 0.24%
- Est. flood insurance / yr
- $1,142 – $2,507
Fire risk 1/10 · Minimal
- Est. fire insurance / yr
- $1,222 – $2,270
Heat risk 6/10 · Moderate
- Hot days now (above 102°F)
- 7 days/yr
- Hot days in 30 yrs
- 25 days/yr
Wind risk 1/10 · Minimal
- Chance of severe wind over 30 yrs
- —
Air-quality risk 2/10 · Minimal
- Unhealthy air days now
- 1 days/yr
- Unhealthy air days in 30 yrs
- 1 days/yr
Risk factors via First Street. Map © Google.
Why this score? — see what drove the B- grade
The composite is a weighted blend of 9 inputs, each scored 0–100. Each bar is that input's sub-score; the figure is the points it added to the 100-point composite (weight × sub-score).
- Cash flow +24.6/30.0
- ARV discount +15.0/15.0
- 1% rule +8.7/10.0
- DSCR +7.9/10.0
- Livability +4.0/5.0
- Schools +2.6/10.0
- Rent growth +2.5/5.0
- Condition / age +2.5/5.0
- Appreciation +0.0/10.0
$90,000
🖨 Deal sheet 📄 Offer letter ✓ Due diligence
Listing remarks
Investment potential in the heart of a neighborhood rich in culture ✨ Right off Loop 375 South 📍--near restaurants, schools, and shopping. Opportunity, location, and value all in one.
Key facts
- 4,700 sq ft lot
- Built 1958
- Listed 18 days
Property features AI
Finance
- HOA & community: No HOA fees included
Exterior
- Home design: Single family residence
- Construction: Block construction; Shingle pitched roof
- Exterior features: Back yard access; Open patio/porch
Interior
- Kitchen: Country-style kitchen
- Flooring: Tile flooring
- Bathrooms: 2 full bathrooms
- Heating & cooling: Central heating; Forced air heating; Central air conditioning; Evaporative cooling
- Interior features: Country kitchen; Windows with no treatments
Neighborhood map
What this means for you Summary
Snapshot
- This is a 3-bed/1.0-bath single-family listed at $90k.
Deal economics
- At list price, monthly cash flow is $34 ($409/yr) — positive.
- The deal already cash-flows at list — no discount required.
- Meets the 1% rule at list price ($1k rent vs $90k).
- Recommended offer: $89k (1.5% below list) — sets the bar for market timing.
Location & tenants
- Location reads 81/100 on livability (#23 in TX, #1,375 nationally) — a professional / high-income tenant draw. Strengths: commute A+, cost of living A+, housing A+; Watch: employment D+.
- Ysleta ISD (urban): math 27% / reading 35% proficiency, ranked #626 of 826 in TX (top 76%) — families likely to look elsewhere, expect single-tenant / working-renter base with shorter leases; 68% free/reduced lunch — lower-income household profile, screen leases tightly.
- Zoned schools: Riverside Middle (math 28% / reading 33%, grade F, #1,036 of 1,662 statewide, top 63%, 726 students, 89% FRL); Riverside H S (math 26% / reading 31%, grade F, #1,157 of 1,632 statewide, top 72%, 1,001 students, 87% FRL) — zoned schools average 88% FRL vs 68% district-wide (20 pts higher); higher-poverty schools than district average — tighter screening recommended.
- Market conditions: 70 active listings in the ZIP; 9 comparable units currently listed for rent nearby; rentals at typical pace (median 24d on market — plan ~3-4 weeks tenant-placement turnaround); lower-income renter base — watch delinquency; 2,196 units permitted in El Paso County in 2024 (143 in 5+ unit buildings).
- This rent runs 42% of the median local income ($35k/yr) — at the standard rent-burdened threshold; future hikes will face affordability resistance.
Forward outlook
- Local home prices are declining (-3.0%/yr); year-one equity from $622 of loan paydown is wiped out by about $3k of value loss. Plan a longer hold.
- El Paso County population projected at +10% by 2050 — modest demand growth; plan on rents tracking national, not racing it.
Negotiation context
- It's been on market 18 days — a 2% lower offer ($89k) is reasonable based on typical stale-listing flexibility.
Risks & watch-outs
- Watch-outs: property tax is 3.7% of price; flood insurance adds $152/mo; built in 1958 — expect roof / HVAC / electrical / plumbing capex.
- Climate carrying-cost: in FEMA flood zone AH (mandatory federal flood insurance); extreme-heat days projected 7→25/yr by 2055 (HVAC capex compounding) — expect insurance premiums to compound above CPI over the hold.
Questions for the listing agent
- Built in 1958 — when were the roof, HVAC, electrical panel, plumbing, and water heater last replaced?
- Property tax is high relative to price — has the assessment been appealed recently, and will the sale trigger a re-assessment?
- What's the actual annual flood-insurance premium (NFIP or private), and is the property in a SFHA with mandatory coverage?
- Is there a deadline driving the sale (1031 exchange, divorce, estate, relocation)? That informs how much negotiation room exists.
- Schools are B-rated — typically a magnet for longer-tenancy family renters. What's the average tenant stay here, and is there a school-zone premium baked into asking?
- What's the average days-on-market for RENTAL listings here right now (not sales)? A rising rental-DOM trend means longer vacancies and softer asking-rent achievability than the comps imply.
- What's the recent tenant-quality profile in this submarket — average credit score on applications, eviction rate, late-payment / NSF rate, and stable-employment percentage? A property-management company in the area should have these aggregated.
- How much new for-sale + rental construction is in the pipeline within 1–3 miles? Heavy new supply typically softens prices + rents 12–24 months out; constrained supply supports both.
Investment metrics
- 1% rule
- 1.37% ✓
- Cap rate
- 8.77%
- Cash-on-cash
- 8.86%
- DSCR
- 1.39
- GRM
- 6.1
CMA / ARV
- ARV (median comp)
- $129,597
- List price
- $90,000
- Delta
- -30.55%
- Verdict
- UNDERPRICED
- Comps
- 1 within 2.0 mi
Show comp detail 1 sale within ~0.75 mi
| Address | Dist | Beds/Ba | Sqft | Sold | Price | $/sf | Match |
|---|---|---|---|---|---|---|---|
| 123 Marquita Ln | 0.56mi | 2/1.0 (-1) | 988 (-6%) | 8mo | $132,000 | $134 | 52 |
Match score weights: distance 35% · size 25% · config 20% · recency 20%. Top-matched comps best support the ARV.
Projected returns pro-forma
-3.0% appreciation · 3.0% rent growth · sell at horizon
- IRR
- -13.4%
- Equity multiple
- 0.52×
- Total profit
- $-12,199
- Equity at exit
- $13,419
- IRR
- -4.1%
- Equity multiple
- 0.72×
- Total profit
- $-6,960
- Equity at exit
- $7,782
Cash invested: $25,200 (down + closing). Projections, not guarantees.
Landlord ↔ Tenant lean methodology
- Overall (STATE)
- 87 Strongly Landlord-Friendly
- State Texas
- 87 Strongly Landlord-Friendly · R+5
- County
- — inherits STATE
- City
- — inherits STATE
ZIP-level market 79915
- Home prices YoY
- -13.1%
- Active inventory
- 70
- Price-to-rent
- 6.1×
Monthly cashflow live
- Estimated rent
- $1,232 high interval (Pro) →
- Mortgage (P&I)
- −$472
- Tax from tax record
- −$278 /mo · $3,331/yr
- Insurance
- −$38
- Flood insurance flood zone
- −$152 /mo · $1,824/yr
- HOA
- −$0
- Vacancy / Maint / Mgmt
- −$259
- Net cashflow
- $34
Break-even live
UW: 25.0% down · 7.5% · 30yr · 1.5% tax · 5.0% vac · 8.0% maint · 8.0% mgmt
Financing live
Cash to close
- Down payment
- $22,500
- Closing costs
- $2,700
- Reserves months
- —
- Total cash needed
- —
Loan-product check · same deal, 3 products live
Conventional
25% down · 7.5% · 30yr
- Down + closing
- —
- Monthly P&I
- —
- Monthly cashflow
- —
- DSCR
- —
- Eligible?
- —
Personal DTI + credit; lowest rate.
DSCR
20% down · 8.5% · 30yr
- Down + closing
- —
- Monthly P&I
- —
- Monthly cashflow
- —
- DSCR
- —
- Eligible?
- —
No personal income docs; deal must DSCR.
Hard money
10% down · 12.0% · 12mo
- Down + closing
- —
- Monthly P&I
- —
- Monthly cashflow
- —
- DSCR
- —
- Eligible?
- —
Short-term bridge; refi at stabilization.
Rent comps 9 comps
| Address | Beds | Baths | Sqft | Rent | $/sqft | DOM | Units | Dist |
|---|---|---|---|---|---|---|---|---|
| 157 Cherry St El Paso, TX | 3.0 | 1.5 | 1161 | $1,350 | $1.16 | 23d | 1 | 0.24mi |
| 7441 Alameda Ave #10 El Paso, TX | 2.0 | 1.0 | 1122 | $1,200 | $1.07 | 23d | 1 | 0.32mi |
| 167 Pearl Ln El Paso, TX | 3.0 | 1.0 | 1248 | $1,275 | $1.02 | 2d | 1 | 0.73mi |
| 7320 Dale Rd Unit 3 El Paso, TX | 2.0 | 1.0 | 900 | $975 | $1.08 | 23d | 1 | 0.84mi |
| 7182 Ponce Dr Unit A El Paso, TX | 2.0 | 1.0 | 1336 | $745 | $0.56 | 43d | 1 | 0.87mi |
| 7224 N Loop Dr Unit 316 El Paso, TX | 2.0 | 1.0 | 900 | $1,050 | $1.17 | 23d | 1 | 1.05mi |
| 7161 Dale Rd Unit 3 El Paso, TX | 3.0 | 1.0 | 778 | $845 | $1.09 | 14d | 1 | 1.16mi |
| 359 Mary Jeanne Ln El Paso, TX | 3.0 | 2.0 | 1300 | $1,600 | $1.23 | 21d | 1 | 1.36mi |
| 7143 N Loop Dr Unit E El Paso, TX | 2.0 | 1.0 | 815 | $895 | $1.10 | 14d | 1 | 1.38mi |
Listing history 2 events
-
2026-05-16status Pending 186-char remark
-
2026-04-28$90,000 Active 186-char remark
ⓘ Source: listings_history table (triggers on properties + properties_extension) + one-shot
backfill from property_details.listing_events for pre-trigger history.
Tax reassessment forecast TX · Resets to sale price
- Current annual tax
- $3,331 · $278/mo
- Projected year-2 tax
- $3,331 · $278/mo
- Expected delta
- $0/yr ($0/mo · 0.0%)
ⓘ Screening estimate from a state-policy table — verify with the county assessor before closing.
Climate risk First Street
- Flood 5/10 Major FEMA zone AH · 24% chance over 30 yrs
- Wildfire 1/10 Low
- Heat 6/10 Major 7 d/yr ≥102°F today · 25 d/yr by 30 yrs out
- Wind 1/10 Low
- Air quality 2/10 Low 1 unhealthy d/yr today · 1 by 30 yrs out
Nearby sold comps map
Loading sold comps map…
Walkable amenities ~0.75 mi
Loading nearby amenities…
Taxation est. · year 1
- Rental income
- $14,783
- − Mortgage interest
- −$5,041
- − Property taxes
- −$3,331
- − Insurance
- −$2,274
- − Repairs & maintenance
- −$1,183
- − Management
- −$1,183
- − Depreciation
- −$2,618
- Taxable loss
- −$848
- Est. tax savings @ 24.0%
- +$203
- After-tax cash flow
- $612/yr
For passive investors: Depreciation is non-cash, so a rental often shows a tax loss while cash-flowing — sheltering income. Rental losses are passive: they offset passive income freely, and up to $25,000/yr can offset ordinary (W-2) income if you actively participate and your MAGI is under $100k (phasing out to $0 by $150k); unused losses carry forward. On sale, claimed depreciation is recaptured at up to 25%, and gains may owe capital-gains tax (a 1031 exchange can defer both). Figures are a year-1 estimate at your 24.0% rate — not tax advice; consult a CPA.
Schools (NCES district)
- District
- Ysleta ISD
- NCES district ID
- 4846680
- Math proficiency
- 27% ▼ -31.00%
- Reading proficiency
- 35% ▼ -11.00%
- Median HH income
- $35,826
- Composite
- 25.65/100
- National rank
- #7400
- State rank
- #626 of 826 in TX
Livability — El Paso
- Score
- 81/100
- State rank
- #23
- US rank
- #1375
Category grades
Schools grade is shown separately in the Schools card above.
Census & demographics
- Census place
- El Paso, TX
- County
- El Paso County · 761,266 people
- City population
- 630,223
- Metro
- El Paso, TX
- Population (ZIP)
- 34,230
- Household income
- $35,432
- Rent vs Own
- Severe rent burden
- 1145.0
Population outlook (El Paso County) Hauer SSP2
- Today (2025)
- 897,899 people
- By 2030
- 922,694 · +2.8%
- By 2040
- 960,492 · +7.0%
- By 2050
- 982,919 · +9.5%
- By 2075
- 997,266 · +11.1%
- By 2100
- 900,630 · +0.3%
Race, ethnicity, and origin ACS 2023
- Neighborhood character
- Predominantly Hispanic (95%)
- Race & ethnicity
- Hispanic / Latino 95% Two or more races 38% White 3% Asian 1%
- Hispanic origin (detail)
- Mexican 91%
- Foreign-born
- 24% · Canada, China
- Languages at home
- 22% English-only · Spanish 77%
Political lean MEDSL · El Paso
- 2024 margin
- D (+15.1) · D 57.0% · R 41.8% · Other 1.2%
- 2008→2024 swing
- -17.4pp toward R · 2008: 32.5pp · 2024: 15.1pp
- All cycles
- 2024: D+15.1 2020: D+35.1 2016: D+43.2 2012: D+32.6 2008: D+32.5
Not yet ingested
- Civics
- —
Market trends
- HPI YoY
- ▼ -35.66%
- Current HPI
- 236.1626
- Rent YoY
- —
- Metro
- El Paso, TX
- State GDP YoY
- ▲ 3.95%
- F500 in state
- 110
Industry mix (Fortune 500 HQ in TX)
| Industry | F500 HQs | Revenue |
|---|---|---|
| Energy | 16 | $1,198B |
|
||
| Technology | 5 | $198B |
|
||
| Engineering / Construction | 4 | $72B |
|
||
| Energy Services | 3 | $60B |
|
||
| Utilities | 3 | $41B |
|
||
| Healthcare | 2 | $330B |
|
||
Price history
2 events — show timeline
- 2026-05-16 Pending — GEPARMLS
- 2026-04-28 Listed $90,000 GEPARMLS
Property tax history
+3.7%/yrLatest (2025): $3,331 · +10.7% YoY. Source: county tax records.
Cash-flow waterfall
monthlySold comps — $/sqft
last 12 mo · ≤1 miLoading sold comps…