306 South 4th St · Vienna, IL
Flood risk 1/10 · Minimal
- FEMA flood zone
- X
- Chance of flooding over 30 yrs
- 0.0%
- Est. flood insurance / yr
- $473 – $860
Fire risk 3/10 · Minor
- Est. fire insurance / yr
- $804 – $1,492
Heat risk 5/10 · Moderate
- Hot days now (above 108°F)
- 7 days/yr
- Hot days in 30 yrs
- 21 days/yr
Wind risk 3/10 · Minor
- Chance of severe wind over 30 yrs
- 4.0%
Air-quality risk 2/10 · Minimal
- Unhealthy air days now
- 1 days/yr
- Unhealthy air days in 30 yrs
- 1 days/yr
Risk factors via First Street. Map © Google.
Why this score? — see what drove the C grade
The composite is a weighted blend of 9 inputs, each scored 0–100. Each bar is that input's sub-score; the figure is the points it added to the 100-point composite (weight × sub-score).
- Cash flow +29.6/30.0
- DSCR +10.0/10.0
- 1% rule +8.9/10.0
- Livability +3.2/5.0
- Rent growth +2.5/5.0
- Condition / age +2.5/5.0
- Schools +2.4/10.0
- ARV discount +0.0/15.0
- Appreciation +0.0/10.0
$68,000
🖨 Deal sheet 📄 Offer letter ✓ Due diligence
Listing remarks
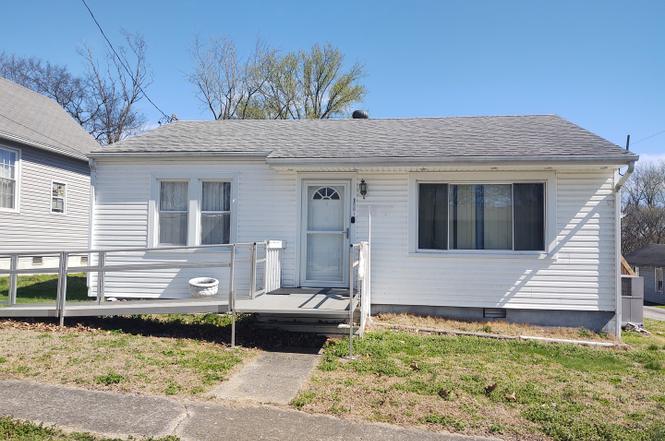
Perfect Retirement/Investment/Starter Home! Aluminum Wheel Chair Ramp! 2 Baths. One Is Handicap w/ Large Walkin Shower! Very Nice Eat In Kitchen w/ Appliances/Oak Cabinetry/Lots Counter Space. Both A Living & Family Rm(possible 2nd BR or Formal Dining). Office Area. Laundry Rm. One Car Attached Garage w/ Storage Cabinets. Large Side Deck! Detached 16x20 Storage Building. Call Today!
Key facts
- Oak cabinetry
- Eat in kitchen
- Large side deck
Tags
Neighborhood map
What this means for you Summary
Snapshot
- This is a 1-bed/2.0-bath single-family listed at $68k.
Deal economics
- At list price, monthly cash flow is $245 ($3k/yr) — positive.
- The deal already cash-flows at list — no discount required.
- Meets the 1% rule at list price ($946 rent vs $68k).
Location & tenants
- Location reads 64/100 on livability (#678 in IL) — a middle-class / working-renter tenant base. Strengths: cost of living A+, housing A+, crime A; Watch: amenities F, commute F, employment F.
- Vienna Hsd 133 (rural): math 15% / reading 35% proficiency, ranked #630 of 919 in IL (top 69%) — low school quality limits family demand, transient renter base, plan for 1-2y turnover.
- Zoned schools: Vienna High School (math 12% / reading 27%, grade F, #397 of 693 statewide, top 61%, 322 students, 0% FRL).
- Market conditions: 31 active listings in the ZIP.
Forward outlook
- Local home prices are declining (-3.0%/yr); year-one equity from $470 of loan paydown is wiped out by about $2k of value loss. Plan a longer hold.
- Johnson County population projected at +4% by 2050 — modest demand growth; plan on rents tracking national, not racing it.
- At projected returns (-3.0% appreciation + 3.0% rent growth), your $19k cash investment doubles in ~8 years — after that, you're playing with house money.
Negotiation context
- Only 14 days on market — expect competitive offers; lowballing is unlikely to land.
- Current owner paid $35k; list at $68k implies a 94% gain — meaningful room to come down on a strong offer.
Risks & watch-outs
- Watch-outs: built in 1952 — expect roof / HVAC / electrical / plumbing capex.
- Climate carrying-cost: extreme-heat days projected 7→21/yr by 2055 (HVAC capex compounding) — expect insurance premiums to compound above CPI over the hold.
Questions for the listing agent
- Built in 1952 — when were the roof, HVAC, electrical panel, plumbing, and water heater last replaced?
- Is there a deadline driving the sale (1031 exchange, divorce, estate, relocation)? That informs how much negotiation room exists.
- Schools are F-rated, which usually means shorter tenancies and higher turnover. Who's the typical renter profile here, and what's been the actual vacancy rate?
- What's the average days-on-market for RENTAL listings here right now (not sales)? A rising rental-DOM trend means longer vacancies and softer asking-rent achievability than the comps imply.
- What's the recent tenant-quality profile in this submarket — average credit score on applications, eviction rate, late-payment / NSF rate, and stable-employment percentage? A property-management company in the area should have these aggregated.
- How much new for-sale + rental construction is in the pipeline within 1–3 miles? Heavy new supply typically softens prices + rents 12–24 months out; constrained supply supports both.
Investment metrics
- 1% rule
- 1.39% ✓
- Cap rate
- 10.62%
- Cash-on-cash
- 15.45%
- DSCR
- 1.69
- GRM
- 6.0
CMA / ARV
- ARV (on-the-fly)
- $58,240
- Comps found
- 1
Show comp detail 1 sale within ~0.75 mi
| Address | Dist | Beds/Ba | Sqft | Sold | Price | $/sf | Match |
|---|---|---|---|---|---|---|---|
| 306 South 4th St | 0.00mi | 1/2.0 | 1,120 (0%) | 1mo | $58,000 | $52 | 100 |
Match score weights: distance 35% · size 25% · config 20% · recency 20%. Top-matched comps best support the ARV.
Projected returns pro-forma
-3.0% appreciation · 3.0% rent growth · sell at horizon
- IRR
- 6.2%
- Equity multiple
- 1.24×
- Total profit
- $4,625
- Equity at exit
- $10,139
- IRR
- 15.6%
- Equity multiple
- 2.27×
- Total profit
- $24,265
- Equity at exit
- $5,879
Cash invested: $19,040 (down + closing). Projections, not guarantees.
Landlord ↔ Tenant lean methodology
- Overall (STATE)
- 43 Moderately Tenant-Leaning
- State Illinois
- 43 Moderately Tenant-Leaning · D+7
- County
- — inherits STATE
- City
- — inherits STATE
ZIP-level market 62995
- Home prices YoY
- -20.1%
- Active inventory
- 31
- Price-to-rent
- 6.0×
Monthly cashflow live
- Estimated rent
- $946 medium interval (Pro) →
- Mortgage (P&I)
- −$357
- Tax from tax record
- −$117 /mo · $1,403/yr
- Insurance
- −$28
- HOA
- −$0
- Vacancy / Maint / Mgmt
- −$199
- Net cashflow
- $245
Break-even live
UW: 25.0% down · 7.5% · 30yr · 1.5% tax · 5.0% vac · 8.0% maint · 8.0% mgmt
Financing live
Cash to close
- Down payment
- $17,000
- Closing costs
- $2,040
- Reserves months
- —
- Total cash needed
- —
Loan-product check · same deal, 3 products live
Conventional
25% down · 7.5% · 30yr
- Down + closing
- —
- Monthly P&I
- —
- Monthly cashflow
- —
- DSCR
- —
- Eligible?
- —
Personal DTI + credit; lowest rate.
DSCR
20% down · 8.5% · 30yr
- Down + closing
- —
- Monthly P&I
- —
- Monthly cashflow
- —
- DSCR
- —
- Eligible?
- —
No personal income docs; deal must DSCR.
Hard money
10% down · 12.0% · 12mo
- Down + closing
- —
- Monthly P&I
- —
- Monthly cashflow
- —
- DSCR
- —
- Eligible?
- —
Short-term bridge; refi at stabilization.
Listing history 3 events
-
2026-03-27status Pending
-
2026-03-13$68,000 Active
-
1997-10-01soldstatus $35,000
ⓘ Source: listings_history table (triggers on properties + properties_extension) + one-shot
backfill from property_details.listing_events for pre-trigger history.
Tax reassessment forecast IL · Partial reset (capped growth)
- Current annual tax
- $1,403 · $117/mo
- Projected year-2 tax
- $1,473 · $123/mo
- Expected delta
- +$70/yr (+$6/mo · 5.0%)
ⓘ Screening estimate from a state-policy table — verify with the county assessor before closing.
Climate risk First Street
- Flood 1/10 Low FEMA zone X · 0% chance over 30 yrs
- Wildfire 3/10 Moderate
- Heat 5/10 Major 7 d/yr ≥108°F today · 21 d/yr by 30 yrs out
- Wind 3/10 Moderate 4% chance of damaging wind over 30 yrs
- Air quality 2/10 Low 1 unhealthy d/yr today · 1 by 30 yrs out
Nearby sold comps map
Loading sold comps map…
Walkable amenities ~0.75 mi
Loading nearby amenities…
Taxation est. · year 1
- Rental income
- $11,346
- − Mortgage interest
- −$3,809
- − Property taxes
- −$1,403
- − Insurance
- −$340
- − Repairs & maintenance
- −$908
- − Management
- −$908
- − Depreciation
- −$1,978
- Taxable income
- $2,000
- Est. tax owed @ 24.0%
- −$480
- After-tax cash flow
- $2,461/yr
For passive investors: Depreciation is non-cash, so a rental often shows a tax loss while cash-flowing — sheltering income. Rental losses are passive: they offset passive income freely, and up to $25,000/yr can offset ordinary (W-2) income if you actively participate and your MAGI is under $100k (phasing out to $0 by $150k); unused losses carry forward. On sale, claimed depreciation is recaptured at up to 25%, and gains may owe capital-gains tax (a 1031 exchange can defer both). Figures are a year-1 estimate at your 24.0% rate — not tax advice; consult a CPA.
Schools (NCES district)
- District
- Vienna Hsd 133
- NCES district ID
- 1740290
- Math proficiency
- 15% ▲ 5.00%
- Reading proficiency
- 35% ▬ 0.00%
- Median HH income
- $40,197
- Composite
- 24.12/100
- National rank
- #13157
- State rank
- #630 of 919 in IL
Livability — Vienna
- Score
- 64/100
- State rank
- #678
- US rank
- #13848
Category grades
Schools grade is shown separately in the Schools card above.
Census & demographics
- Census place
- Vienna, IL
- City population
- 6,477
- Population (ZIP)
- 6,477
Population outlook (Johnson County) Hauer SSP2
- Today (2025)
- 13,355 people
- By 2030
- 13,579 · +1.7%
- By 2040
- 13,849 · +3.7%
- By 2050
- 13,880 · +3.9%
- By 2075
- 13,759 · +3.0%
- By 2100
- 11,536 · -13.6%
Race, ethnicity, and origin ACS 2023
- Neighborhood character
- Predominantly White (72%)
- Race & ethnicity
- White 72% Black 15% Two or more races 11% Hispanic / Latino 5%
- Common ancestry
- Romanian 2% Serbian 2% Slovak 1%
- Foreign-born
- 1% · Canada
- Languages at home
- 96% English-only · German/W. Germanic 2% Spanish 2%
Political lean MEDSL · Johnson
- 2024 margin
- Solid R (+58.3) · D 20.3% · R 78.6% · Other 1.1%
- 2008→2024 swing
- -23.7pp toward R · 2008: -34.6pp · 2024: -58.3pp
- All cycles
- 2024: R+58.3 2020: R+58.6 2016: R+58.3 2012: R+42.1 2008: R+34.6
Not yet ingested
- Civics
- —
Market trends
- HPI YoY
- ▼ -36.69%
- Current HPI
- 145.9396
- Rent YoY
- —
- Metro
- —
- State GDP YoY
- ▲ 1.59%
- F500 in state
- 60
Industry mix (Fortune 500 HQ in IL)
| Industry | F500 HQs | Revenue |
|---|---|---|
| Insurance | 4 | $201B |
|
||
| Consumer Goods | 4 | $87B |
|
||
| Industrial Machinery | 3 | $64B |
|
||
| Healthcare | 2 | $55B |
|
||
| Retail / Pharmacy | 1 | $148B |
|
||
| Agriculture / Food | 1 | $86B |
|
||
Price history
+94.3% since first listed3 events — show timeline
- 2026-03-27 Pending — MRED as Distributed by MLS Grid
- 2026-03-13 Listed $68,000 MRED as Distributed by MLS Grid
- 1997-10-01 Sold (Public Records) $35,000 Public Records
Property tax history
+52.2%/yrLatest (2023): $1,403 · +52.2% YoY. Source: county tax records.
Cash-flow waterfall
monthlySold comps — $/sqft
last 12 mo · ≤1 miLoading sold comps…