 🏷️ Likely Rental
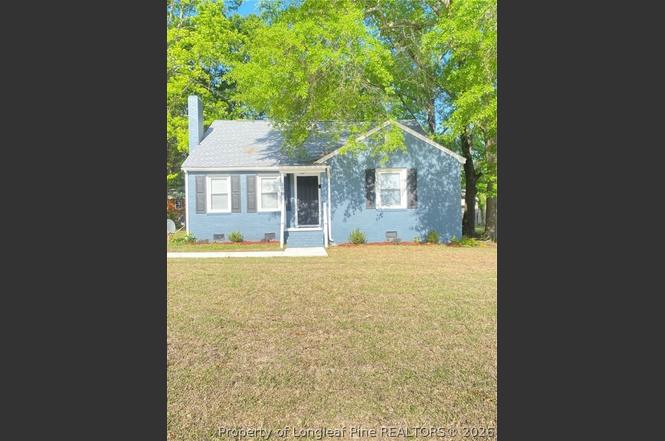
110 N Grove Ave · Rockingham, NC
Flood risk 1/10 · Minimal
- FEMA flood zone
- X (unshaded)
- Chance of flooding over 30 yrs
- 0.0%
- Est. flood insurance / yr
- $507 – $1,088
Fire risk 3/10 · Minor
- Est. fire insurance / yr
- $906 – $1,684
Heat risk 7/10 · Major
- Hot days now (above 109°F)
- 7 days/yr
- Hot days in 30 yrs
- 16 days/yr
Wind risk 6/10 · Moderate
- Chance of severe wind over 30 yrs
- 66.0%
Air-quality risk 1/10 · Minimal
- Unhealthy air days now
- 0 days/yr
- Unhealthy air days in 30 yrs
- 0 days/yr
Risk factors via First Street. Map © Google.
Why this score? — see what drove the B- grade
The composite is a weighted blend of 9 inputs, each scored 0–100. Each bar is that input's sub-score; the figure is the points it added to the 100-point composite (weight × sub-score).
- Cash flow +25.7/30.0
- ARV discount +15.0/15.0
- DSCR +8.6/10.0
- 1% rule +5.7/10.0
- Livability +3.2/5.0
- Schools +2.7/10.0
- Rent growth +2.5/5.0
- Condition / age +2.5/5.0
- Appreciation +0.0/10.0
$149,500
🖨 Deal sheet 📄 Offer letter ✓ Due diligence
Listing remarks
CURRENTLY TENANT OCCUPIED in the heart of Rockingham community, and conveniently located to shopping. .. . This 3BR/1BA ranch style home also features a finished bonus room and private office upstairs. Updated flooring, appliances, some new windows throughout. The roof was replaced in 2023. New HVAC system installed in 2024. Property being sold "AS IS" This home delivers the perfect blend of charm, efficiency, and flexibility. The finished bonus room provides extra space rarely found in cottage-style homes, while the single-level layout keeps daily living simple and accessible. Whether a first-time buyer, investor, downsizer, or anyone seeking a cozy home with personality, this p
Key facts
- Finished bonus room
- Updated flooring
- Roof replaced
Tags
Property features AI
Exterior
- Parking: No garage
- Utilities: Public water; Public sewer
- Home design: Single family residence; Residential property; Located in the Rockingham subdivision
- Construction: Brick construction
- Exterior features: Level lot
Interior
- Kitchen: Range; Refrigerator; Dishwasher; Free-standing range; Free-standing refrigerator
- Bedrooms: Total rooms: 6
- Flooring: Vinyl
- Bathrooms: 1 full bathroom
- Heating & cooling: Heat pump heating; Ceiling fan cooling
- Interior features: Ceiling fans throughout; Fireplace (see remarks)
- Laundry & utility: Washer hookup in unit; Crawl space
Neighborhood map
What this means for you Summary
Snapshot
- This is a 3-bed/1.0-bath single-family listed at $150k.
Deal economics
- At list price, monthly cash flow is $357 ($4k/yr) — positive.
- The deal already cash-flows at list — no discount required.
- Meets the 1% rule at list price ($2k rent vs $150k).
- Recommended offer: $141k (6.0% below list) — sets the bar for market timing.
- Cap rate 9.2% vs local median 6.0% in Rockingham — top-decile yield for the area; either an underpriced asset or a hidden risk that comps aren't pricing in. Stress-test before assuming the spread holds.
Location & tenants
- Location reads 63/100 on livability (#403 in NC) — a middle-class / working-renter tenant base. Strengths: cost of living A+, housing A, health & safety B+; Watch: crime F, amenities F, commute F.
- Richmond County Schools (town): math 30% / reading 36% proficiency, ranked #139 of 178 in NC (top 78%) — families likely to look elsewhere, expect single-tenant / working-renter base with shorter leases; 70% free/reduced lunch — lower-income household profile, screen leases tightly.
- Zoned schools: Richmond Senior High (math 58% / reading 38%, grade D, #329 of 535 statewide, top 62%, 1,286 students, 99% FRL) — zoned schools average 99% FRL vs 70% district-wide (30 pts higher); higher-poverty schools than district average — tighter screening recommended.
- Zoned-school proficiency averages 48% at this address vs 33% district-wide (+15 pts) — the actual schools serving this property are materially stronger than the Richmond County Schools average implies; a family-tenant draw the district grade alone would hide.
- Market conditions: 155 active listings in the ZIP; 54 units permitted in Richmond County in 2024 (0 in 5+ unit buildings).
Forward outlook
- Local home prices are declining (-3.0%/yr); year-one equity from $1k of loan paydown is wiped out by about $4k of value loss. Plan a longer hold.
- Richmond County population projected at -22% by 2050 — secular population decline; favor cash flow + early exit over multi-decade hold.
Negotiation context
- It's been on market 73 days — a 6% lower offer ($141k) is reasonable based on typical stale-listing flexibility.
- 11 sale attempts since 4y ago with the ask held roughly flat each time — persistent listings suggest the price (not the market) is what's stuck; bring a comps-based counter.
- Current owner paid $71k; list at $150k implies a 111% gain — meaningful room to come down on a strong offer.
Risks & watch-outs
- Watch-outs: built in 1951 — expect roof / HVAC / electrical / plumbing capex.
- Climate carrying-cost: major wind risk, 66% chance of damaging wind over 30y; extreme-heat days projected 7→16/yr by 2055 (HVAC capex compounding) — expect insurance premiums to compound above CPI over the hold.
Questions for the listing agent
- It's been on market 73 days. Have you received any prior offers? Is the seller open to a 6% concession, seller financing, or rate buy-down credit?
- Built in 1951 — when were the roof, HVAC, electrical panel, plumbing, and water heater last replaced?
- Why hasn't it sold? Are there any deal-killer items the seller is aware of (foundation, flood, title, zoning, code violations)?
- Is there a deadline driving the sale (1031 exchange, divorce, estate, relocation)? That informs how much negotiation room exists.
- Schools are D-rated, which usually means shorter tenancies and higher turnover. Who's the typical renter profile here, and what's been the actual vacancy rate?
- Crime grade is F in this area — have there been break-ins, vandalism, or insurance claims at this property in the last 3 years? What carrier currently insures it and at what premium?
- What's the average days-on-market for RENTAL listings here right now (not sales)? A rising rental-DOM trend means longer vacancies and softer asking-rent achievability than the comps imply.
- What's the recent tenant-quality profile in this submarket — average credit score on applications, eviction rate, late-payment / NSF rate, and stable-employment percentage? A property-management company in the area should have these aggregated.
- How much new for-sale + rental construction is in the pipeline within 1–3 miles? Heavy new supply typically softens prices + rents 12–24 months out; constrained supply supports both.
Investment metrics
- 1% rule
- 1.07% ✓
- Cap rate
- 9.16%
- Cash-on-cash
- 10.24%
- DSCR
- 1.46
- GRM
- 7.8
CMA / ARV
- ARV (on-the-fly)
- $206,063
- Comps found
- 12
Show comp detail 12 sales within ~0.75 mi
| Address | Dist | Beds/Ba | Sqft | Sold | Price | $/sf | Match |
|---|---|---|---|---|---|---|---|
| 1507 Fayetteville Rd | 0.30mi | 3/1.0 | 1,659 (+6%) | 3mo | $119,000 | $72 | 74 |
| 1604 E Washington St | 0.30mi | 3/1.0 | 1,456 (-7%) | 6mo | $114,000 | $78 | 69 |
| 1611 Summit Dr | 0.32mi | 3/2.0 | 1,487 (-6%) | 7mo | $195,000 | $131 | 66 |
| 116 Brook Leigh Dr | 0.21mi | 2/2.0 (-1) | 1,591 (+1%) | 16mo | $325,000 | $204 | 66 |
| 1418 Carolina Dr | 0.55mi | 3/2.0 | 1,630 (+4%) | 4mo | $221,000 | $136 | 61 |
| 201 S Brookwood Ave | 0.16mi | 2/1.5 (-1) | 1,344 (-15%) | 4mo | $65,000 | $48 | 58 |
| 1907 Anthony Ave | 0.60mi | 3/2.0 | 1,684 (+7%) | 0mo | $130,000 | $77 | 56 |
| 1306 Carolina Dr | 0.33mi | 3/2.0 | 1,704 (+8%) | 14mo | $145,000 | $85 | 55 |
| 1206 Lancaster Ln | 0.45mi | 4/2.0 (+1) | 1,776 (+13%) | 2mo | $295,000 | $166 | 47 |
| 431 Curtis Dr | 0.68mi | 3/2.0 | 1,567 (-0%) | 22mo | $270,000 | $172 | 46 |
| 1817 Fayetteville Rd | 0.57mi | 2/1.5 (-1) | 1,367 (-13%) | 6mo | $150,000 | $110 | 40 |
| 313 Mcarthur Dr | 0.66mi | 3/2.0 | 1,337 (-15%) | 4mo | $195,000 | $146 | 37 |
Match score weights: distance 35% · size 25% · config 20% · recency 20%. Top-matched comps best support the ARV.
Projected returns pro-forma
-3.0% appreciation · 3.0% rent growth · sell at horizon
- IRR
- -1.0%
- Equity multiple
- 0.96×
- Total profit
- $-1,530
- Equity at exit
- $22,291
- IRR
- 8.7%
- Equity multiple
- 1.66×
- Total profit
- $27,735
- Equity at exit
- $12,926
Cash invested: $41,860 (down + closing). Projections, not guarantees.
Landlord ↔ Tenant lean methodology
- Overall (STATE)
- 85 Strongly Landlord-Friendly
- State North Carolina
- 85 Strongly Landlord-Friendly · R+3
- County
- — inherits STATE
- City
- — inherits STATE
ZIP-level market 28379
- Home prices YoY
- -32.4%
- Active inventory
- 155
- Price-to-rent
- 7.8×
Monthly cashflow live
- Estimated rent
- $1,594 medium interval (Pro) →
- Mortgage (P&I)
- −$784
- Tax from tax record
- −$55 /mo · $665/yr
- Insurance
- −$62
- HOA
- −$0
- Vacancy / Maint / Mgmt
- −$335
- Net cashflow
- $357
Break-even live
UW: 25.0% down · 7.5% · 30yr · 1.5% tax · 5.0% vac · 8.0% maint · 8.0% mgmt
Financing live
Cash to close
- Down payment
- $37,375
- Closing costs
- $4,485
- Reserves months
- —
- Total cash needed
- —
Loan-product check · same deal, 3 products live
Conventional
25% down · 7.5% · 30yr
- Down + closing
- —
- Monthly P&I
- —
- Monthly cashflow
- —
- DSCR
- —
- Eligible?
- —
Personal DTI + credit; lowest rate.
DSCR
20% down · 8.5% · 30yr
- Down + closing
- —
- Monthly P&I
- —
- Monthly cashflow
- —
- DSCR
- —
- Eligible?
- —
No personal income docs; deal must DSCR.
Hard money
10% down · 12.0% · 12mo
- Down + closing
- —
- Monthly P&I
- —
- Monthly cashflow
- —
- DSCR
- —
- Eligible?
- —
Short-term bridge; refi at stabilization.
Listing history 34 events
-
2026-05-14status Pending
-
2026-03-02$149,500 Active
-
2025-06-04status Active
-
2025-06-04price $149,400
-
2025-05-30status Pending
-
2025-04-01status Active
-
2024-11-17$149,500 Active
-
2024-11-16historical
-
2024-06-10price $159,000
-
2024-05-28status Active
-
2024-05-01status Pending
-
2024-04-22$169,500 Active
-
2024-03-05price $159,500
-
2024-03-05price $159,500
-
2024-02-21price $169,000
-
2024-02-21price $169,000
-
2024-02-12price $171,500
-
2024-02-12price $171,500
-
2024-01-12price $172,000
-
2024-01-12price $172,000
-
2024-01-07status Active
-
2023-11-01status Pending
-
2023-10-20historical Active Under Contract
-
2023-10-13$177,000 Active
-
2023-09-27historical
-
2023-05-11soldstatus $71,000 Closed
-
2023-05-11soldstatus $71,000
-
2023-04-22status Pending
-
2023-03-04status Active
-
2023-03-04price $72,900
-
2023-02-16historical
-
2023-01-23price $82,900
-
2022-11-29status Active
-
2022-09-08$92,900 Active
ⓘ Source: listings_history table (triggers on properties + properties_extension) + one-shot
backfill from property_details.listing_events for pre-trigger history.
Tax reassessment forecast NC · Resets to sale price
- Current annual tax
- $665 · $55/mo
- Projected year-2 tax
- $1,226 · $102/mo
- Expected delta
- +$561/yr (+$47/mo · 84.4%)
ⓘ Screening estimate from a state-policy table — verify with the county assessor before closing.
Climate risk First Street
- Flood 1/10 Low FEMA zone X (unshaded) · 0% chance over 30 yrs
- Wildfire 3/10 Moderate
- Heat 7/10 Severe 7 d/yr ≥109°F today · 16 d/yr by 30 yrs out
- Wind 6/10 Major 66% chance of damaging wind over 30 yrs
- Air quality 1/10 Low 0 unhealthy d/yr today · 0 by 30 yrs out
Nearby sold comps map
Loading sold comps map…
Walkable amenities ~0.75 mi
Loading nearby amenities…
Taxation est. · year 1
- Rental income
- $19,123
- − Mortgage interest
- −$8,374
- − Property taxes
- −$665
- − Insurance
- −$748
- − Repairs & maintenance
- −$1,530
- − Management
- −$1,530
- − Depreciation
- −$4,349
- Taxable income
- $1,927
- Est. tax owed @ 24.0%
- −$463
- After-tax cash flow
- $3,824/yr
For passive investors: Depreciation is non-cash, so a rental often shows a tax loss while cash-flowing — sheltering income. Rental losses are passive: they offset passive income freely, and up to $25,000/yr can offset ordinary (W-2) income if you actively participate and your MAGI is under $100k (phasing out to $0 by $150k); unused losses carry forward. On sale, claimed depreciation is recaptured at up to 25%, and gains may owe capital-gains tax (a 1031 exchange can defer both). Figures are a year-1 estimate at your 24.0% rate — not tax advice; consult a CPA.
Schools (NCES district)
- District
- Richmond County Schools
- NCES district ID
- 3703870
- Math proficiency
- 30% ▼ -12.00%
- Reading proficiency
- 36% ▼ -3.00%
- Median HH income
- $32,224
- Composite
- 26.97/100
- National rank
- #7076
- State rank
- #139 of 178 in NC
Livability — Rockingham
- Score
- 63/100
- State rank
- #403
- US rank
- #15356
Category grades
Schools grade is shown separately in the Schools card above.
Census & demographics
- Census place
- Rockingham, NC
- Population (ZIP)
- 24,068
Population outlook (Richmond County) Hauer SSP2
- Today (2025)
- 42,892 people
- By 2030
- 41,257 · -3.8%
- By 2040
- 37,629 · -12.3%
- By 2050
- 33,655 · -21.5%
- By 2075
- 23,992 · -44.1%
- By 2100
- 14,782 · -65.5%
Race, ethnicity, and origin ACS 2023
- Neighborhood character
- Diverse neighborhood (Simpson 0.58)
- Race & ethnicity
- White 56% Black 32% Hispanic / Latino 8% Two or more races 4% Asian 1%
- Hispanic origin (detail)
- Mexican 6%
- Common ancestry
- Serbian 2% Slovak 2% Lithuanian 1%
- Foreign-born
- 4% · Canada, Jamaica
- Languages at home
- 91% English-only · Spanish 7%
Political lean MEDSL · Richmond
- 2024 margin
- Strong R (+20.9) · D 39.2% · R 60.1%
- 2008→2024 swing
- -22.4pp toward R · 2008: 1.5pp · 2024: -20.9pp
- All cycles
- 2024: R+20.9 2020: R+14.8 2016: R+10.1 2012: D+2.7 2008: D+1.5
Not yet ingested
- Civics
- —
Market trends
- HPI YoY
- ▼ -97.10%
- Current HPI
- 203.0628
- Rent YoY
- —
- Metro
- —
- State GDP YoY
- ▲ 3.28%
- F500 in state
- 26
Industry mix (Fortune 500 HQ in NC)
| Industry | F500 HQs | Revenue |
|---|---|---|
| Financial Services | 2 | $213B |
|
||
| Retail | 2 | $95B |
|
||
| Industrial Conglomerate | 1 | $38B |
|
||
| Metals / Steel | 1 | $35B |
|
||
| Utilities | 1 | $30B |
|
||
| Industrial Machinery | 1 | $19B |
|
||
Price history
+60.9% since first listed34 events — show timeline
- 2026-05-14 Pending — LPRMLS
- 2026-03-02 Listed $149,500 LPRMLS
- 2025-06-04 Relisted — LPRMLS
- 2025-06-04 Price Changed $149,400 LPRMLS
- 2025-05-30 Pending — LPRMLS
- 2025-04-01 Relisted — LPRMLS
- 2024-11-17 Listed $149,500 LPRMLS
- 2024-11-16 Coming Soon — LPRMLS
- 2024-06-10 Price Changed $159,000 LPRMLS
- 2024-05-28 Relisted — LPRMLS
- 2024-05-01 Pending — LPRMLS
- 2024-04-22 Listed $169,500 LPRMLS
- 2024-03-05 Price Changed $159,500 Triad MLS
- 2024-03-05 Price Changed $159,500 CANOPYMLS as Distributed by MLS Grid
- 2024-02-21 Price Changed $169,000 Triad MLS
- 2024-02-21 Price Changed $169,000 CANOPYMLS as Distributed by MLS Grid
- 2024-02-12 Price Changed $171,500 Triad MLS
- 2024-02-12 Price Changed $171,500 CANOPYMLS as Distributed by MLS Grid
- 2024-01-12 Price Changed $172,000 Triad MLS
- 2024-01-12 Price Changed $172,000 CANOPYMLS as Distributed by MLS Grid
- 2024-01-07 Relisted — CANOPYMLS as Distributed by MLS Grid
- 2023-11-01 Pending — CANOPYMLS as Distributed by MLS Grid
- 2023-10-20 Contingent — CANOPYMLS as Distributed by MLS Grid
- 2023-10-13 Listed $177,000 CANOPYMLS as Distributed by MLS Grid
- 2023-09-27 Coming Soon — CANOPYMLS as Distributed by MLS Grid
- 2023-05-11 Sold (Public Records) $71,000 Public Records
- 2023-05-11 Sold (MLS) $71,000 Hive MLS
- 2023-04-22 Pending — Hive MLS
- 2023-03-04 Relisted — Hive MLS
- 2023-03-04 Price Changed $72,900 Hive MLS
- 2023-02-16 Listing Removed — Hive MLS
- 2023-01-23 Price Changed $82,900 Hive MLS
- 2022-11-29 Relisted — Hive MLS
- 2022-09-08 Listed $92,900 Hive MLS
Property tax history
+3.4%/yrLatest (2025): $665 · -2.1% YoY. Source: county tax records.
Cash-flow waterfall
monthlySold comps — $/sqft
last 12 mo · ≤1 miLoading sold comps…