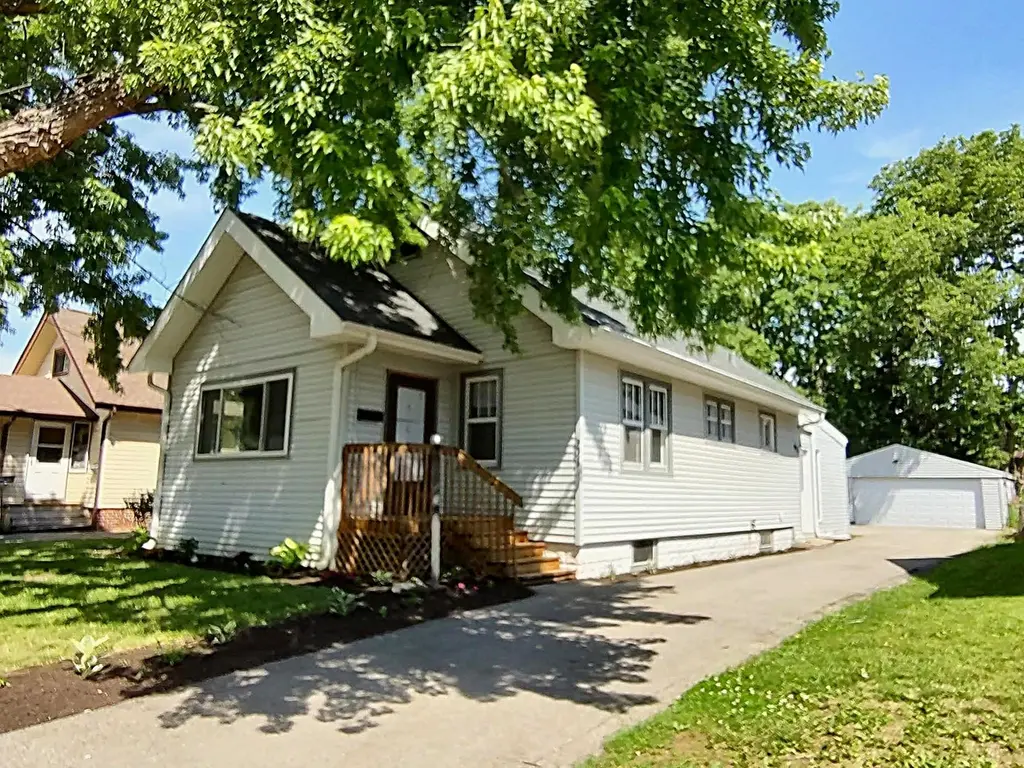
604 Frances Ave · Loves Park, IL
Flood risk 3/10 · Minor
- FEMA flood zone
- X (unshaded)
- Chance of flooding over 30 yrs
- 0.17%
- Est. flood insurance / yr
- $473 – $860
Fire risk 1/10 · Minimal
- Est. fire insurance / yr
- $804 – $1,492
Heat risk 3/10 · Minor
- Hot days now (above 101°F)
- 7 days/yr
- Hot days in 30 yrs
- 15 days/yr
Wind risk 2/10 · Minimal
- Chance of severe wind over 30 yrs
- —
Air-quality risk 2/10 · Minimal
- Unhealthy air days now
- 1 days/yr
- Unhealthy air days in 30 yrs
- 2 days/yr
Risk factors via First Street. Map © Google.
Why this score? — see what drove the B- grade
The composite is a weighted blend of 9 inputs, each scored 0–100. Each bar is that input's sub-score; the figure is the points it added to the 100-point composite (weight × sub-score).
- Cash flow +30.0/30.0
- 1% rule +10.0/10.0
- DSCR +10.0/10.0
- ARV discount +7.5/15.0
- Livability +3.7/5.0
- Rent growth +2.5/5.0
- Condition / age +2.5/5.0
- Schools +1.8/10.0
- Appreciation +0.0/10.0
$180,000
🖨 Deal sheet 📄 Offer letter ✓ Due diligence
Listing remarks
This 3 bedroom 2 bathroom home has vintage charm with some modern updates. Move in ready and available for a quick closing! The freshly landscaped front yard provides cute curb appeal. Updates over the years include remodeled bathrooms, updated kitchen and an addition off the back of the home! The addition has a family room with a large picture window over looking the back yard and a large master bedroom with a slider door. Off the master bedroom is a walk-in closet and private master bathroom. The updated kitchen is light and bright. Enclosed front porch has a nice large picture window and storage. The dining room is open to the living room. Built-in linen storage. Upper level offers ano
Key facts
- Walk-in closet
- Large picture window
- Updated kitchen
Tags
Property features AI
Exterior
- Parking: Detached asphalt parking; Approximately 2.5 garage spaces
- Utilities: Public water; Public sewer
- Home design: Single-family residence (house); One story
- Exterior features: Shingle roof; 0.16-acre lot
Interior
- Kitchen: Electric cooktop; Microwave; Refrigerator
- Bathrooms: 2 full bathrooms; Both full bathrooms on the main level
- Heating & cooling: Forced air heating (natural gas); Central air conditioning
- Interior features: Walk-in closet(s); Full basement
- Laundry & utility: Gas water heater
Neighborhood map
What this means for you Summary
Snapshot
- This is a 3-bed/2.0-bath single-family listed at $180k.
Deal economics
- At list price, monthly cash flow is $988 ($12k/yr) — positive.
- The deal already cash-flows at list — no discount required.
- Meets the 1% rule at list price ($3k rent vs $180k).
- Cap rate 12.9% vs local median 4.9% in Loves Park — top-decile yield for the area; either an underpriced asset or a hidden risk that comps aren't pricing in. Stress-test before assuming the spread holds.
Location & tenants
- Location reads 74/100 on livability (#255 in IL, #4,724 nationally) — a middle-class / working-renter tenant base. Strengths: cost of living A+, housing A+, health & safety A+; Watch: employment D+, commute F.
- Harlem UD 122 (suburban): math 17% / reading 23% proficiency, ranked #418 of 620 in IL (top 67%) — low school quality limits family demand, transient renter base, plan for 1-2y turnover.
- Zoned schools: Loves Park Elem School (math 17% / reading 22%, grade F, #1,054 of 2,056 statewide, top 54%, 351 students, 0% FRL); Harlem High School (math 18% / reading 23%, grade F, #350 of 693 statewide, top 51%, 1,875 students, 0% FRL) — zoned schools average 0% FRL vs 45% district-wide (45 pts lower); this property's tenant base skews higher-income than the district average.
- Market conditions: 91 active listings in the ZIP; 3 comparable units currently listed for rent nearby; rentals leasing fast (median 14d on market — plan ~1-2 weeks tenant-placement turnaround); 285 units permitted in Winnebago County in 2024 (0 in 5+ unit buildings).
Forward outlook
- Local home prices are declining (-3.0%/yr); year-one equity from $1k of loan paydown is wiped out by about $5k of value loss. Plan a longer hold.
- Winnebago County population projected at -20% by 2050 — secular population decline; favor cash flow + early exit over multi-decade hold.
- At projected returns (-3.0% appreciation + 3.0% rent growth), your $50k cash investment doubles in ~6 years — after that, you're playing with house money.
Negotiation context
- Only 3 days on market — expect competitive offers; lowballing is unlikely to land.
- 2 sale attempts with the ask held roughly flat each time — persistent listings suggest the price (not the market) is what's stuck; bring a comps-based counter.
- Current owner paid $69k; list at $180k implies a 161% gain — meaningful room to come down on a strong offer.
Risks & watch-outs
- Watch-outs: built in 1925 — expect roof / HVAC / electrical / plumbing capex.
Questions for the listing agent
- Built in 1925 — when were the roof, HVAC, electrical panel, plumbing, and water heater last replaced?
- Is there a deadline driving the sale (1031 exchange, divorce, estate, relocation)? That informs how much negotiation room exists.
- Schools are F-rated, which usually means shorter tenancies and higher turnover. Who's the typical renter profile here, and what's been the actual vacancy rate?
- What's the average days-on-market for RENTAL listings here right now (not sales)? A rising rental-DOM trend means longer vacancies and softer asking-rent achievability than the comps imply.
- What's the recent tenant-quality profile in this submarket — average credit score on applications, eviction rate, late-payment / NSF rate, and stable-employment percentage? A property-management company in the area should have these aggregated.
- How much new for-sale + rental construction is in the pipeline within 1–3 miles? Heavy new supply typically softens prices + rents 12–24 months out; constrained supply supports both.
Investment metrics
- 1% rule
- 1.59% ✓
- Cap rate
- 12.88%
- Cash-on-cash
- 23.53%
- DSCR
- 2.05
- GRM
- 5.2
CMA / ARV
- ARV (on-the-fly)
- $180,180
- Comps found
- 12
Show comp detail 12 sales within ~0.75 mi
| Address | Dist | Beds/Ba | Sqft | Sold | Price | $/sf | Match |
|---|---|---|---|---|---|---|---|
| 634 River Ln | 0.30mi | 3/1.0 | 1,904 (+5%) | 1mo | $188,500 | $99 | 73 |
| 5143 Illinois St | 0.20mi | 4/2.0 (+1) | 1,750 (-4%) | 9mo | $147,500 | $84 | 72 |
| 602 River Ln | 0.28mi | 3/1.5 | 1,680 (-8%) | 9mo | $200,000 | $119 | 64 |
| 5424 Dale Ave | 0.22mi | 3/2.0 | 1,611 (-12%) | 14mo | $155,000 | $96 | 59 |
| 545 River Park Dr | 0.50mi | 3/1.0 | 2,005 (+10%) | 2mo | $194,900 | $97 | 54 |
| 251 Merrill Ave | 0.51mi | 3/2.0 | 1,548 (-15%) | 2mo | $228,000 | $147 | 50 |
| 3833 Pepper Dr | 0.74mi | 4/3.0 (+1) | 1,918 (+5%) | 1mo | $294,000 | $153 | 47 |
| 834 Grand Ave | 0.50mi | 3/1.5 | 1,557 (-14%) | 9mo | $150,000 | $96 | 43 |
| 4903 Illinois St | 0.38mi | 4/2.0 (+1) | 2,062 (+13%) | 15mo | $191,500 | $93 | 43 |
| 4930 Arlington St | 0.40mi | 2/1.5 (-1) | 1,575 (-14%) | 11mo | $170,000 | $108 | 42 |
| 5523 Forest Hills Rd | 0.48mi | 3/1.0 | 2,080 (+14%) | 10mo | $175,000 | $84 | 41 |
| 4902 Forest Hills Rd | 0.48mi | 4/2.0 (+1) | 2,087 (+15%) | 15mo | $215,000 | $103 | 36 |
Match score weights: distance 35% · size 25% · config 20% · recency 20%. Top-matched comps best support the ARV.
Projected returns pro-forma
-3.0% appreciation · 3.0% rent growth · sell at horizon
- IRR
- 16.7%
- Equity multiple
- 1.67×
- Total profit
- $33,834
- Equity at exit
- $26,839
- IRR
- 25.2%
- Equity multiple
- 3.20×
- Total profit
- $110,749
- Equity at exit
- $15,563
Cash invested: $50,400 (down + closing). Projections, not guarantees.
Landlord ↔ Tenant lean methodology
- Overall (STATE)
- 43 Moderately Tenant-Leaning
- State Illinois
- 43 Moderately Tenant-Leaning · D+7
- County
- — inherits STATE
- City
- — inherits STATE
ZIP-level market 61111
- Active inventory
- 91
- Price-to-rent
- 5.2×
Monthly cashflow live
- Estimated rent
- $2,858 medium interval (Pro) →
- Mortgage (P&I)
- −$944
- Tax from tax record
- −$250 /mo · $3,003/yr
- Insurance
- −$75
- HOA
- −$0
- Vacancy / Maint / Mgmt
- −$600
- Net cashflow
- $988
Break-even live
UW: 25.0% down · 7.5% · 30yr · 1.5% tax · 5.0% vac · 8.0% maint · 8.0% mgmt
Financing live
Cash to close
- Down payment
- $45,000
- Closing costs
- $5,400
- Reserves months
- —
- Total cash needed
- —
Loan-product check · same deal, 3 products live
Conventional
25% down · 7.5% · 30yr
- Down + closing
- —
- Monthly P&I
- —
- Monthly cashflow
- —
- DSCR
- —
- Eligible?
- —
Personal DTI + credit; lowest rate.
DSCR
20% down · 8.5% · 30yr
- Down + closing
- —
- Monthly P&I
- —
- Monthly cashflow
- —
- DSCR
- —
- Eligible?
- —
No personal income docs; deal must DSCR.
Hard money
10% down · 12.0% · 12mo
- Down + closing
- —
- Monthly P&I
- —
- Monthly cashflow
- —
- DSCR
- —
- Eligible?
- —
Short-term bridge; refi at stabilization.
Rent comps 3 comps
| Address | Beds | Baths | Sqft | Rent | $/sqft | DOM | Units | Dist |
|---|---|---|---|---|---|---|---|---|
| 4016 Eaton Dr Unit 1232695P Rockford, IL | 3.0 | 3.0 | 1722 | $4,169 | $2.42 | 13d | 1 | 0.99mi |
| 3422 Fremont St Rockford, IL | 3.0 | 2.0 | 1700 | $1,975 | $1.16 | 13d | 1 | 1.32mi |
| 2308 Fremont St Rockford, IL | 3.0 | 1.0 | 1320 | $1,600 | $1.21 | 44d | 1 | 1.46mi |
Listing history 4 events
-
2026-06-19days on market $180,000 Active 3 DOM
-
2026-06-18days on market $180,000 Active 2 DOM
-
2026-06-17remarks 699-char remark
-
2026-06-17$180,000 Active 1 DOM
ⓘ Source: listings_history table (triggers on properties + properties_extension) + one-shot
backfill from property_details.listing_events for pre-trigger history.
Tax reassessment forecast IL · Partial reset (capped growth)
- Current annual tax
- $3,003 · $250/mo
- Projected year-2 tax
- $3,545 · $295/mo
- Expected delta
- +$541/yr (+$45/mo · 18.0%)
ⓘ Screening estimate from a state-policy table — verify with the county assessor before closing.
Climate risk First Street
- Flood 3/10 Moderate FEMA zone X (unshaded) · 17% chance over 30 yrs
- Wildfire 1/10 Low
- Heat 3/10 Moderate 7 d/yr ≥101°F today · 15 d/yr by 30 yrs out
- Wind 2/10 Low
- Air quality 2/10 Low 1 unhealthy d/yr today · 2 by 30 yrs out
Nearby sold comps map
Loading sold comps map…
Walkable amenities ~0.75 mi
Loading nearby amenities…
Taxation est. · year 1
- Rental income
- $34,291
- − Mortgage interest
- −$10,083
- − Property taxes
- −$3,003
- − Insurance
- −$900
- − Repairs & maintenance
- −$2,743
- − Management
- −$2,743
- − Depreciation
- −$5,236
- Taxable income
- $9,582
- Est. tax owed @ 24.0%
- −$2,300
- After-tax cash flow
- $9,560/yr
For passive investors: Depreciation is non-cash, so a rental often shows a tax loss while cash-flowing — sheltering income. Rental losses are passive: they offset passive income freely, and up to $25,000/yr can offset ordinary (W-2) income if you actively participate and your MAGI is under $100k (phasing out to $0 by $150k); unused losses carry forward. On sale, claimed depreciation is recaptured at up to 25%, and gains may owe capital-gains tax (a 1031 exchange can defer both). Figures are a year-1 estimate at your 24.0% rate — not tax advice; consult a CPA.
Schools (NCES district)
- District
- Harlem UD 122
- NCES district ID
- 1718240
- Math proficiency
- 17% ▼ -8.00%
- Reading proficiency
- 23% ▼ -7.00%
- Median HH income
- $51,228
- Composite
- 18.01/100
- National rank
- #8982
- State rank
- #418 of 620 in IL
Livability — Loves Park
- Score
- 74/100
- State rank
- #255
- US rank
- #4724
Category grades
Schools grade is shown separately in the Schools card above.
Census & demographics
- Census place
- Loves Park, IL
- City population
- 22,838
- Population (ZIP)
- 22,838
Population outlook (Winnebago County) Hauer SSP2
- Today (2025)
- 271,080 people
- By 2030
- 260,684 · -3.8%
- By 2040
- 238,405 · -12.1%
- By 2050
- 216,129 · -20.3%
- By 2075
- 172,882 · -36.2%
- By 2100
- 135,336 · -50.1%
Race, ethnicity, and origin ACS 2023
- Neighborhood character
- Predominantly White (70%)
- Race & ethnicity
- White 70% Two or more races 11% Hispanic / Latino 9% Black 8% Asian 4%
- Hispanic origin (detail)
- Mexican 7% Puerto Rican 1%
- Common ancestry
- Romanian 4% Portuguese 3% Slovak 2%
- Foreign-born
- 8% · Canada, China
- Languages at home
- 89% English-only · Spanish 5% Russian/Polish/Slavic 3% Other Indo-European 1%
Political lean MEDSL · Winnebago
- 2024 margin
- Toss-up / Even · D 49.5% · R 49.0% · Other 1.5%
- 2008→2024 swing
- -12.2pp toward R · 2008: 12.8pp · 2024: 0.6pp
- All cycles
- 2024: D+0.6 2020: D+2.5 2016: R+1.2 2012: D+5.7 2008: D+12.8
Not yet ingested
- Civics
- —
Market trends
- HPI YoY
- ▼ -125.48%
- Current HPI
- 222.3872
- Rent YoY
- —
- Metro
- —
- State GDP YoY
- ▲ 1.59%
- F500 in state
- 60
Industry mix (Fortune 500 HQ in IL)
| Industry | F500 HQs | Revenue |
|---|---|---|
| Insurance | 4 | $201B |
|
||
| Consumer Goods | 4 | $87B |
|
||
| Industrial Machinery | 3 | $64B |
|
||
| Healthcare | 2 | $55B |
|
||
| Retail / Pharmacy | 1 | $148B |
|
||
| Agriculture / Food | 1 | $86B |
|
||
Price history
+160.9% since first listed5 events — show timeline
- 2026-06-16 Listed $180,000 NWIAR
- 2025-03-06 Rental Removed $1,450 APPFOLIO
- 2025-02-14 Listed for Rent $1,450 APPFOLIO
- 2022-05-31 Price Changed $1,450 RENT.
- 2000-03-23 Sold (Public Records) $69,000 Public Records
Property tax history
+1.6%/yrLatest (2025): $3,003 · +9.3% YoY. Source: county tax records.
Cash-flow waterfall
monthlySold comps — $/sqft
last 12 mo · ≤1 miLoading sold comps…