13976 Golden Star Rd · Alta Sierra, CA
Flood risk 1/10 · Minimal
- FEMA flood zone
- X (unshaded)
- Chance of flooding over 30 yrs
- 0.0%
- Est. flood insurance / yr
- $507 – $1,088
Fire risk 9/10 · Severe
- Est. fire insurance / yr
- $659 – $1,223
Heat risk 5/10 · Moderate
- Hot days now (above 96°F)
- 7 days/yr
- Hot days in 30 yrs
- 17 days/yr
Wind risk 1/10 · Minimal
- Chance of severe wind over 30 yrs
- —
Air-quality risk 10/10 · Severe
- Unhealthy air days now
- 33 days/yr
- Unhealthy air days in 30 yrs
- 40 days/yr
Risk factors via First Street. Map © Google.
Why this score? — see what drove the C+ grade
The composite is a weighted blend of 9 inputs, each scored 0–100. Each bar is that input's sub-score; the figure is the points it added to the 100-point composite (weight × sub-score).
- Cash flow +30.0/30.0
- 1% rule +10.0/10.0
- DSCR +10.0/10.0
- Schools +3.7/10.0
- Livability +3.0/5.0
- Rent growth +2.5/5.0
- Condition / age +2.5/5.0
- ARV discount +0.0/15.0
- Appreciation +0.0/10.0
$70,000
🖨 Deal sheet 📄 Offer letter ✓ Due diligence
Listing remarks
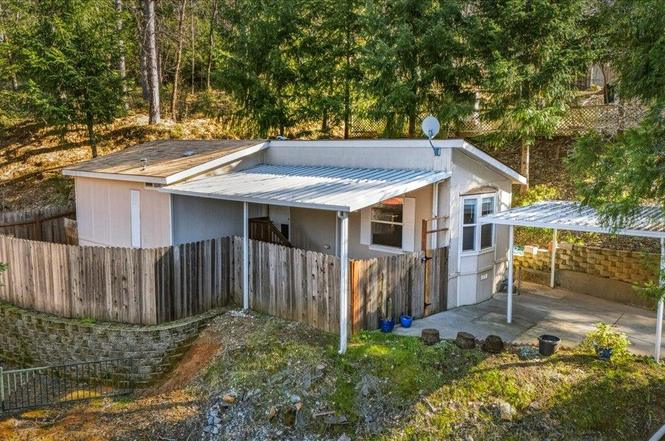
Move in ready with brand NEW carpet!!! 2006 2/2 manufactured home in an ALL AGES park located on a large lot in coveted location close to park entrance though uniquely secluded. In about 707 square feet, this home offers pristine condition with skylights, bay window, natural light and all appliances included. You will enjoy the fenced patio and yard for approved pets and covered carport. The Tall Pines Mobile Estates offers a modern clubhouse offers a pool and large clubhouse. Conveniently located with easy access to highway 49 for easy trips into town. This home offers affordable, low maintenance, easy living at its best! Monthly park space rent is currently $1145, utilities are billed se
Key facts
- Fenced patio
- Modern clubhouse
- Covered carport
Tags
Property features AI
Finance
- Other: Located at 13976 Golden Star Rd, Grass Valley, CA 95949; Directions provided to property
- Financial info: Land lease amount listed (separate amount reported)
- HOA & community: No homeowners association; Not a senior community; Land lease: No (land lease amount listed separately)
Exterior
- Parking: Attached covered parking; No garage
- Utilities: Propane service; Individual electric meter; 220V in laundry; Public water; Septic sewer; Internet available
- Home design: Manufactured home in a park; Double-wide unit; Built in 2006
- Construction: Composition roof; Manufacturer: Champion Home Builders; Model/Make: Lamplighter Infinity II
- Exterior features: Patio awning; Carport awning; Fenced yard; Front yard; Private, secluded setting; Close to clubhouse
Interior
- Kitchen: Free-standing gas range; Free-standing refrigerator; Built-in gas oven; Dishwasher; Garbage disposal; Microwave; Ceramic counters
- Bedrooms: 2 bedrooms
- Flooring: Carpet; Tile; Linoleum
- Bathrooms: 2 full bathrooms; Tubs with shower over
- Heating & cooling: Central heating; Propane and natural gas heating available; Central air; Ceiling fans
- Interior features: Cathedral/vaulted living room ceiling; Porch steps; Covered and enclosed patio; Porch; Patio awning; Carport awning; Fenced yard; Kitchen and family room combined; Ceramic kitchen countertops; Kitchen skylight(s); Pets allowed
- Laundry & utility: Washer and dryer included (stacked); Laundry inside the home / inside room
Neighborhood map
What this means for you Summary
Snapshot
- This is a 2-bed/2.0-bath manufactured listed at $70k.
Deal economics
- At list price, monthly cash flow is $1k ($13k/yr) — positive.
- The deal already cash-flows at list — no discount required.
- Meets the 1% rule at list price ($2k rent vs $70k).
- Recommended offer: $62k (12.0% below list) — sets the bar for market timing.
- Cap rate 25.4% vs local median 3.4% in Alta Sierra — top-decile yield for the area; either an underpriced asset or a hidden risk that comps aren't pricing in. Stress-test before assuming the spread holds.
Location & tenants
- Location reads 59/100 on livability (#662 in CA) — a working-class tenant base; expect higher turnover. Strengths: employment A+, housing A+; Watch: crime C-, schools D+, amenities F.
- Pleasant Ridge Union Elementary (rural): math 33% / reading 49% proficiency, ranked #214 of 517 in CA (top 41%) — families likely to look elsewhere, expect single-tenant / working-renter base with shorter leases.
- Market conditions: 252 active listings in the ZIP; solid renter incomes; 215 units permitted in Nevada County in 2024 (0 in 5+ unit buildings).
Forward outlook
- Local home prices are declining (-3.0%/yr); year-one equity from $484 of loan paydown is wiped out by about $2k of value loss. Plan a longer hold.
- Nevada County population projected at -14% by 2050 — secular population decline; favor cash flow + early exit over multi-decade hold.
- At projected returns (-3.0% appreciation + 3.0% rent growth), your $20k cash investment doubles in ~2 years — after that, you're playing with house money.
Negotiation context
- It's been on market 133 days — a 12% lower offer ($62k) is reasonable based on typical stale-listing flexibility.
Risks & watch-outs
- Climate carrying-cost: severe wildfire risk; extreme-heat days projected 7→17/yr by 2055 (HVAC capex compounding) — expect insurance premiums to compound above CPI over the hold.
Questions for the listing agent
- It's been on market 133 days. Have you received any prior offers? Is the seller open to a 12% concession, seller financing, or rate buy-down credit?
- Why hasn't it sold? Are there any deal-killer items the seller is aware of (foundation, flood, title, zoning, code violations)?
- Is there a deadline driving the sale (1031 exchange, divorce, estate, relocation)? That informs how much negotiation room exists.
- Schools are D-rated, which usually means shorter tenancies and higher turnover. Who's the typical renter profile here, and what's been the actual vacancy rate?
- What's the average days-on-market for RENTAL listings here right now (not sales)? A rising rental-DOM trend means longer vacancies and softer asking-rent achievability than the comps imply.
- What's the recent tenant-quality profile in this submarket — average credit score on applications, eviction rate, late-payment / NSF rate, and stable-employment percentage? A property-management company in the area should have these aggregated.
- How much new for-sale + rental construction is in the pipeline within 1–3 miles? Heavy new supply typically softens prices + rents 12–24 months out; constrained supply supports both.
Investment metrics
- 1% rule
- 2.80% ✓
- Cap rate
- 25.43%
- Cash-on-cash
- 68.34%
- DSCR
- 4.04
- GRM
- 3.0
CMA / ARV
- ARV (on-the-fly)
- $50,197
- Comps found
- 4
Show comp detail 4 sales within ~0.75 mi
| Address | Dist | Beds/Ba | Sqft | Sold | Price | $/sf | Match |
|---|---|---|---|---|---|---|---|
| 14338 State Highway 49 #47 | 0.15mi | 2/1.0 | 660 (-7%) | 8mo | $20,000 | $30 | 72 |
| 14338 State Highway 49 #19 | 0.21mi | 2/1.0 | 800 (+13%) | 5mo | $52,000 | $65 | 60 |
| 10114 Forest Springs Dr | 0.66mi | 2/1.0 | 720 (+2%) | 19mo | $75,000 | $104 | 46 |
| 14338 State Hwy 49 #51 | 0.21mi | 2/1.0 | 800 (+13%) | 22mo | $57,000 | $71 | 46 |
Match score weights: distance 35% · size 25% · config 20% · recency 20%. Top-matched comps best support the ARV.
Projected returns pro-forma
-3.0% appreciation · 3.0% rent growth · sell at horizon
- IRR
- 67.7%
- Equity multiple
- 4.05×
- Total profit
- $59,746
- Equity at exit
- $10,437
- IRR
- 71.9%
- Equity multiple
- 8.32×
- Total profit
- $143,562
- Equity at exit
- $6,052
Cash invested: $19,600 (down + closing). Projections, not guarantees.
Landlord ↔ Tenant lean methodology
- Overall (STATE)
- 18 Strongly Tenant-Friendly
- State California
- 18 Strongly Tenant-Friendly · D+13
- County
- — inherits STATE
- City
- — inherits STATE
ZIP-level market 95949
- Home prices YoY
- -34.7%
- Active inventory
- 252
- Price-to-rent
- 3.0×
Monthly cashflow live
- Estimated rent
- $1,963 medium interval (Pro) →
- Mortgage (P&I)
- −$367
- Tax from tax record
- −$38 /mo · $458/yr
- Insurance
- −$29
- HOA
- −$0
- Vacancy / Maint / Mgmt
- −$412
- Net cashflow
- $1,116
Break-even live
UW: 25.0% down · 7.5% · 30yr · 1.5% tax · 5.0% vac · 8.0% maint · 8.0% mgmt
Financing live
Cash to close
- Down payment
- $17,500
- Closing costs
- $2,100
- Reserves months
- —
- Total cash needed
- —
Loan-product check · same deal, 3 products live
Conventional
25% down · 7.5% · 30yr
- Down + closing
- —
- Monthly P&I
- —
- Monthly cashflow
- —
- DSCR
- —
- Eligible?
- —
Personal DTI + credit; lowest rate.
DSCR
20% down · 8.5% · 30yr
- Down + closing
- —
- Monthly P&I
- —
- Monthly cashflow
- —
- DSCR
- —
- Eligible?
- —
No personal income docs; deal must DSCR.
Hard money
10% down · 12.0% · 12mo
- Down + closing
- —
- Monthly P&I
- —
- Monthly cashflow
- —
- DSCR
- —
- Eligible?
- —
Short-term bridge; refi at stabilization.
Listing history 16 events
-
2026-06-19days on market $70,000 Active 133 DOM
-
2026-06-18days on market $70,000 Active 132 DOM
-
2026-06-17days on market $70,000 Active 131 DOM
-
2026-06-16days on market $70,000 Active 130 DOM
-
2026-06-15days on market $70,000 Active 129 DOM
-
2026-06-13days on market $70,000 Active 127 DOM
-
2026-06-13days on market $70,000 Active 126 DOM
-
2026-06-10days on market $70,000 Active 124 DOM
-
2026-06-09days on market $70,000 Active 123 DOM
-
2026-06-08days on market $70,000 Active 122 DOM
-
2026-06-07pricedays on market $70,000 Active 121 DOM
-
2026-06-05days on market $75,000 Active 118 DOM
-
2026-06-03days on market $75,000 Active 117 DOM
-
2026-06-02days on market $75,000 Active 116 DOM
-
2026-06-01days on market $75,000 Active 115 DOM
-
2026-05-31days on market $75,000 Active 114 DOM
ⓘ Source: listings_history table (triggers on properties + properties_extension) + one-shot
backfill from property_details.listing_events for pre-trigger history.
Tax reassessment forecast CA · Resets to sale price
- Current annual tax
- $458 · $38/mo
- Projected year-2 tax
- $532 · $44/mo
- Expected delta
- +$74/yr (+$6/mo · 16.2%)
ⓘ Screening estimate from a state-policy table — verify with the county assessor before closing.
Climate risk First Street
- Flood 1/10 Low FEMA zone X (unshaded) · 0% chance over 30 yrs
- Wildfire 9/10 Extreme
- Heat 5/10 Major 7 d/yr ≥96°F today · 17 d/yr by 30 yrs out
- Wind 1/10 Low
- Air quality 10/10 Extreme 33 unhealthy d/yr today · 40 by 30 yrs out
Nearby sold comps map
Loading sold comps map…
Walkable amenities ~0.75 mi
Loading nearby amenities…
Taxation est. · year 1
- Rental income
- $23,553
- − Mortgage interest
- −$3,921
- − Property taxes
- −$458
- − Insurance
- −$350
- − Repairs & maintenance
- −$1,884
- − Management
- −$1,884
- − Depreciation
- −$2,036
- Taxable income
- $13,019
- Est. tax owed @ 24.0%
- −$3,125
- After-tax cash flow
- $10,269/yr
For passive investors: Depreciation is non-cash, so a rental often shows a tax loss while cash-flowing — sheltering income. Rental losses are passive: they offset passive income freely, and up to $25,000/yr can offset ordinary (W-2) income if you actively participate and your MAGI is under $100k (phasing out to $0 by $150k); unused losses carry forward. On sale, claimed depreciation is recaptured at up to 25%, and gains may owe capital-gains tax (a 1031 exchange can defer both). Figures are a year-1 estimate at your 24.0% rate — not tax advice; consult a CPA.
Schools (NCES district)
- District
- Pleasant Ridge Union Elementary
- NCES district ID
- 0630930
- Math proficiency
- 33% ▼ -6.00%
- Reading proficiency
- 49% ▬ 0.00%
- Median HH income
- $65,524
- Composite
- 36.75/100
- National rank
- #4580
- State rank
- #214 of 517 in CA
Livability — Alta Sierra
- Score
- 59/100
- State rank
- #662
- US rank
- #20497
Category grades
Schools grade is shown separately in the Schools card above.
Census & demographics
- County
- Nevada County · 85,339 people
- Metro
- Truckee-Grass Valley, CA
- Population (ZIP)
- 20,552
- Household income
- $98,181
- Rent vs Own
- Severe rent burden
- 181.0
Population outlook (Nevada County) Hauer SSP2
- Today (2025)
- 98,490 people
- By 2030
- 97,295 · -1.2%
- By 2040
- 92,041 · -6.5%
- By 2050
- 85,164 · -13.5%
- By 2075
- 68,436 · -30.5%
- By 2100
- 49,536 · -49.7%
Race, ethnicity, and origin ACS 2023
- Neighborhood character
- Predominantly White (84%)
- Race & ethnicity
- White 84% Hispanic / Latino 8% Two or more races 8% Native American 1%
- Hispanic origin (detail)
- Mexican 6%
- Common ancestry
- Lithuanian 4% Italian 4% Slovak 2%
- Foreign-born
- 4% · Canada
- Languages at home
- 94% English-only · Spanish 3% Other Indo-European 1%
Political lean MEDSL · Nevada
- 2024 margin
- D (+12.2) · D 54.4% · R 42.1% · Other 3.5%
- 2008→2024 swing
- +6.9pp toward D · 2008: 5.3pp · 2024: 12.2pp
- All cycles
- 2024: D+12.2 2020: D+14.8 2016: D+4.5 2012: R+4.7 2008: D+5.3
Not yet ingested
- Civics
- —
Market trends
- HPI YoY
- ▼ -122.41%
- Current HPI
- 230.2373
- Rent YoY
- —
- Metro
- Truckee-Grass Valley, CA
- State GDP YoY
- ▲ 3.21%
- F500 in state
- 116
Industry mix (Fortune 500 HQ in CA)
| Industry | F500 HQs | Revenue |
|---|---|---|
| Technology | 27 | $1,492B |
|
||
| Financial Services | 3 | $174B |
|
||
| Retail | 3 | $44B |
|
||
| Insurance | 3 | $26B |
|
||
| Media / Entertainment | 2 | $115B |
|
||
| Pharmaceuticals / Biotech | 2 | $62B |
|
||
Property tax history
-2.0%/yrLatest (2025): $458 · -0.7% YoY. Source: county tax records.
Cash-flow waterfall
monthlySold comps — $/sqft
last 12 mo · ≤1 miLoading sold comps…