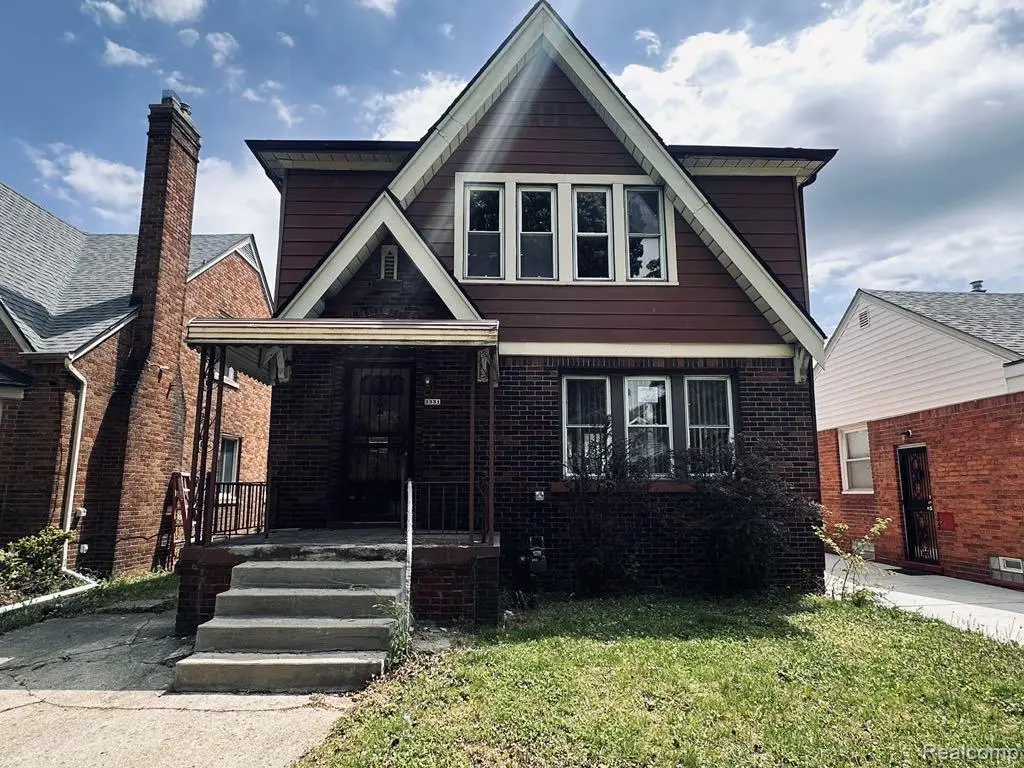
3331 S Liddesdale St · Detroit, MI
Flood risk 1/10 · Minimal
- FEMA flood zone
- X (unshaded)
- Chance of flooding over 30 yrs
- 0.0%
- Est. flood insurance / yr
- $473 – $860
Fire risk 1/10 · Minimal
- Est. fire insurance / yr
- $784 – $1,456
Heat risk 3/10 · Minor
- Hot days now (above 97°F)
- 7 days/yr
- Hot days in 30 yrs
- 15 days/yr
Wind risk 2/10 · Minimal
- Chance of severe wind over 30 yrs
- —
Air-quality risk 3/10 · Minor
- Unhealthy air days now
- 2 days/yr
- Unhealthy air days in 30 yrs
- 4 days/yr
Risk factors via First Street. Map © Google.
Why this score? — see what drove the B grade
The composite is a weighted blend of 9 inputs, each scored 0–100. Each bar is that input's sub-score; the figure is the points it added to the 100-point composite (weight × sub-score).
- Cash flow +30.0/30.0
- 1% rule +10.0/10.0
- DSCR +10.0/10.0
- ARV discount +7.5/15.0
- Appreciation +5.1/10.0
- Livability +3.7/5.0
- Rent growth +2.5/5.0
- Condition / age +2.5/5.0
- Schools +1.3/10.0
$55,000
🖨 Deal sheet 📄 Offer letter ✓ Due diligence
Listing remarks MLS
THIS IS A HUD HOME BEING SOLD AS IS. EXCLUSIVE LISTING. OWNER OCCUPANT BIDS ONLY FOR FIRST 15 DAYS ON MARKET. INVESTORS CAN BID AFTER THIS DATE. SOLID BRICK COLONIAL WITH HARDWOOD FLOORS THROUGOUT. LOCATED CLOSE TO SCHOOLS, SHOPPING, AND MAJOR FREEWAYS. BUYER TO ORDER FINAL WATER READING FROM THE CITY OF DETROIT.
Key facts
- Solid brick colonial
- Close to schools
- Close to shopping
Tags
Property features AI
Exterior
- Parking: No garage
- Utilities: Public water; Public sewer
- Home design: Single-family residence; Two levels; Entry located at lower level with steps; Brick exterior
- Construction: Brick construction
- Exterior features: Paved road access; Lot approximately 0.12 acres (35 x 152)
Interior
- Bathrooms: 1 full bathroom; 1 half bathroom
- Heating & cooling: Forced air heating (natural gas); No central cooling
- Interior features: 6 total rooms; Unfinished basement
Neighborhood map
What this means for you Summary
Snapshot
- This is a 3-bed/1.0-bath single-family listed at $55k.
Deal economics
- At list price, monthly cash flow is $655 ($8k/yr) — positive.
- The deal already cash-flows at list — no discount required.
- Meets the 1% rule at list price ($1k rent vs $55k).
- Recommended offer: $54k (1.5% below list) — sets the bar for market timing.
- Cap rate 20.6% vs local median 10.2% in Detroit — top-decile yield for the area; either an underpriced asset or a hidden risk that comps aren't pricing in. Stress-test before assuming the spread holds.
Location & tenants
- Location reads 73/100 on livability (#218 in MI) — a middle-class / working-renter tenant base. Strengths: amenities A+, commute A+, cost of living A+; Watch: schools F, crime F, employment F.
- Detroit Public Schools Community District (urban): math 10% / reading 24% proficiency, ranked #499 of 540 in MI (top 92%) — low school quality limits family demand, transient renter base, plan for 1-2y turnover; 90% free/reduced lunch — lower-income household profile, screen leases tightly.
- Market conditions: 24 active listings in the ZIP; 15 comparable units currently listed for rent nearby; rentals at typical pace (median 18d on market — plan ~3-4 weeks tenant-placement turnaround); 2,639 units permitted in Wayne County in 2024 (1,216 in 5+ unit buildings).
Forward outlook
- In year one you build about $440 of equity ($380 loan paydown + $60 appreciation (0.1% local appreciation)).
- Wayne County population projected at -17% by 2050 — secular population decline; favor cash flow + early exit over multi-decade hold.
- At projected returns (0.1% appreciation + 3.0% rent growth), your $15k cash investment doubles in ~2 years — after that, you're playing with house money.
Negotiation context
- It's been on market 26 days — a 2% lower offer ($54k) is reasonable based on typical stale-listing flexibility.
- 2 sale attempts with the ask held roughly flat each time — persistent listings suggest the price (not the market) is what's stuck; bring a comps-based counter.
- Current owner paid $32k; list at $55k implies a 72% gain — meaningful room to come down on a strong offer.
Risks & watch-outs
- Watch-outs: built in 1928 — expect roof / HVAC / electrical / plumbing capex.
Questions for the listing agent
- Built in 1928 — when were the roof, HVAC, electrical panel, plumbing, and water heater last replaced?
- Is there a deadline driving the sale (1031 exchange, divorce, estate, relocation)? That informs how much negotiation room exists.
- Schools are F-rated, which usually means shorter tenancies and higher turnover. Who's the typical renter profile here, and what's been the actual vacancy rate?
- Crime grade is F in this area — have there been break-ins, vandalism, or insurance claims at this property in the last 3 years? What carrier currently insures it and at what premium?
- What's the average days-on-market for RENTAL listings here right now (not sales)? A rising rental-DOM trend means longer vacancies and softer asking-rent achievability than the comps imply.
- What's the recent tenant-quality profile in this submarket — average credit score on applications, eviction rate, late-payment / NSF rate, and stable-employment percentage? A property-management company in the area should have these aggregated.
- How much new for-sale + rental construction is in the pipeline within 1–3 miles? Heavy new supply typically softens prices + rents 12–24 months out; constrained supply supports both.
Investment metrics
- 1% rule
- 2.36% ✓
- Cap rate
- 20.57%
- Cash-on-cash
- 51.00%
- DSCR
- 3.27
- GRM
- 3.5
CMA / ARV
- ARV (on-the-fly)
- $117,312
- Comps found
- 12
Show comp detail 12 sales within ~0.75 mi
| Address | Dist | Beds/Ba | Sqft | Sold | Price | $/sf | Match |
|---|---|---|---|---|---|---|---|
| 3430 S Edsel St | 0.19mi | 3/1.5 | 1,248 (0%) | 2mo | $55,000 | $44 | 87 |
| 2955 S Dartmouth St | 0.45mi | 3/1.0 | 1,188 (-5%) | 4mo | $68,000 | $57 | 67 |
| 3846 18th St | 0.40mi | 3/1.5 | 1,168 (-6%) | 3mo | $50,000 | $43 | 66 |
| 1055 Chandler Ave | 0.37mi | 3/1.0 | 1,383 (+11%) | 4mo | $172,500 | $125 | 62 |
| 4133 16th St | 0.62mi | 3/1.0 | 1,174 (-6%) | 2mo | $130,000 | $111 | 60 |
| 2483 S Ethel St | 0.62mi | 3/1.0 | 1,167 (-6%) | 4mo | $80,000 | $69 | 57 |
| 3953 19th St | 0.36mi | 3/1.0 | 1,066 (-15%) | 3mo | $50,000 | $47 | 57 |
| 1576 Morris Ave | 0.75mi | 3/1.0 | 1,292 (+4%) | 5mo | $119,900 | $93 | 55 |
| 1178 Fort Park Blvd | 0.61mi | 3/1.0 | 1,128 (-10%) | 3mo | $165,000 | $146 | 53 |
| 26695 E Outer Dr | 0.59mi | 3/1.5 | 1,104 (-12%) | 4mo | $105,000 | $95 | 47 |
| 1383 Morris Ave | 0.60mi | 4/2.0 (+1) | 1,092 (-12%) | 1mo | $152,000 | $139 | 41 |
| 465 Campbell St | 0.71mi | 3/1.0 | 1,065 (-15%) | 7mo | $99,999 | $94 | 37 |
Match score weights: distance 35% · size 25% · config 20% · recency 20%. Top-matched comps best support the ARV.
Projected returns pro-forma
0.11% appreciation · 3.0% rent growth · sell at horizon
- IRR
- 52.6%
- Equity multiple
- 3.62×
- Total profit
- $40,374
- Equity at exit
- $16,269
- IRR
- 55.0%
- Equity multiple
- 7.26×
- Total profit
- $96,431
- Equity at exit
- $19,796
Cash invested: $15,400 (down + closing). Projections, not guarantees.
Landlord ↔ Tenant lean methodology
- Overall (STATE)
- 62 Landlord-Friendly
- State Michigan
- 62 Landlord-Friendly · EVEN
- County
- — inherits STATE
- City
- — inherits STATE
ZIP-level market 48217
- Home prices YoY
- 0.0%
- Active inventory
- 24
- Price-to-rent
- 3.5×
Monthly cashflow live
- Estimated rent
- $1,300 high interval (Pro) →
- Mortgage (P&I)
- −$288
- Tax from tax record
- −$61 /mo · $731/yr
- Insurance
- −$23
- HOA
- −$0
- Vacancy / Maint / Mgmt
- −$273
- Net cashflow
- $655
Break-even live
UW: 25.0% down · 7.5% · 30yr · 1.5% tax · 5.0% vac · 8.0% maint · 8.0% mgmt
Financing live
Cash to close
- Down payment
- $13,750
- Closing costs
- $1,650
- Reserves months
- —
- Total cash needed
- —
Loan-product check · same deal, 3 products live
Conventional
25% down · 7.5% · 30yr
- Down + closing
- —
- Monthly P&I
- —
- Monthly cashflow
- —
- DSCR
- —
- Eligible?
- —
Personal DTI + credit; lowest rate.
DSCR
20% down · 8.5% · 30yr
- Down + closing
- —
- Monthly P&I
- —
- Monthly cashflow
- —
- DSCR
- —
- Eligible?
- —
No personal income docs; deal must DSCR.
Hard money
10% down · 12.0% · 12mo
- Down + closing
- —
- Monthly P&I
- —
- Monthly cashflow
- —
- DSCR
- —
- Eligible?
- —
Short-term bridge; refi at stabilization.
Rent comps 15 comps
| Address | Beds | Baths | Sqft | Rent | $/sqft | DOM | Units | Dist |
|---|---|---|---|---|---|---|---|---|
| 3575 S Ethel St Detroit, MI | 3.0 | 1.0 | 894 | $1,350 | $1.51 | 17d | 1 | 0.33mi |
| 3801 18th St Ecorse, MI | 3.0 | 1.0 | 1196 | $1,150 | $0.96 | 17d | 1 | 0.47mi |
| 4015 16th St Ecorse, MI | 3.0 | 1.5 | 1170 | $1,300 | $1.11 | 24d | 1 | 0.58mi |
| 1524 Cicotte Ave Lincoln Park, MI | 2.0 | 1.0 | 900 | $1,250 | $1.39 | 14d | 1 | 0.84mi |
| 1537 Chandler Ave Lincoln Park, MI | 2.0 | 1.0 | 725 | $1,100 | $1.52 | 17d | 1 | 0.88mi |
| 1774 Council Ave Lincoln Park, MI | 3.0 | 1.0 | 864 | $1,500 | $1.74 | 1d | 1 | 0.90mi |
| 1473 Empire Ave Lincoln Park, MI | 3.0 | 2.0 | 1342 | $1,700 | $1.27 | 1d | 1 | 0.93mi |
| 1774 College Ave Lincoln Park, MI | 3.0 | 1.0 | 944 | $1,525 | $1.62 | 1d | 1 | 1.00mi |
| 875 Raupp Pl Unit 2 Lincoln Park, MI | 2.0 | 1.0 | 800 | $970 | $1.21 | 16d | 1 | 1.02mi |
| 1532 Euclid St #1 Lincoln Park, MI | 2.0 | 1.0 | 850 | $1,450 | $1.71 | 24d | 1 | 1.02mi |
| 1581 Empire Ave Lincoln Park, MI | 2.0 | 1.0 | 900 | $1,350 | $1.50 | 24d | 1 | 1.04mi |
| 4282 7th St Ecorse, MI | 3.0 | 1.0 | 1144 | $1,250 | $1.09 | 24d | 1 | 1.14mi |
| 1552 Hanover St Lincoln Park, MI | 2.0 | 1.0 | 800 | $1,250 | $1.56 | 24d | 1 | 1.27mi |
| 1139 S Bassett St Detroit, MI | 3.0 | 1.0 | 927 | $1,120 | $1.21 | 43d | 1 | 1.46mi |
| 1139 S Bassett St Detroit, MI | 3.0 | 1.0 | 927 | $1,050 | $1.13 | 24d | 1 | 1.46mi |
Listing history 16 events
-
2026-06-17statusdays on market $55,000 Pending 26 DOM
-
2026-06-15days on market $55,000 Active 25 DOM
-
2026-06-13days on market $55,000 Active 23 DOM
-
2026-06-13days on market $55,000 Active 22 DOM
-
2026-06-09days on market $55,000 Active 19 DOM
-
2026-06-08days on market $55,000 Active 18 DOM
-
2026-06-07days on market $55,000 Active 17 DOM
-
2026-06-04days on market $55,000 Active 14 DOM
-
2026-06-03days on market $55,000 Active 13 DOM
-
2026-06-02days on market $55,000 Active 12 DOM
-
2026-06-01days on market $55,000 Active 11 DOM
-
2026-05-31days on market $55,000 Active 10 DOM
-
2026-05-20$55,000 Active
Show marketing remark (314 chars)
THIS IS A HUD HOME BEING SOLD AS IS. EXCLUSIVE LISTING. OWNER OCCUPANT BIDS ONLY FOR FIRST 15 DAYS ON MARKET. INVESTORS CAN BID AFTER THIS DATE. SOLID BRICK COLONIAL WITH HARDWOOD FLOORS THROUGOUT. LOCATED CLOSE TO SCHOOLS, SHOPPING, AND MAJOR FREEWAYS. BUYER TO ORDER FINAL WATER READING FROM THE CITY OF DETROIT.
-
2026-05-20$55,000 Active 314-char remark
Show marketing remark (314 chars)
THIS IS A HUD HOME BEING SOLD AS IS. EXCLUSIVE LISTING. OWNER OCCUPANT BIDS ONLY FOR FIRST 15 DAYS ON MARKET. INVESTORS CAN BID AFTER THIS DATE. SOLID BRICK COLONIAL WITH HARDWOOD FLOORS THROUGOUT. LOCATED CLOSE TO SCHOOLS, SHOPPING, AND MAJOR FREEWAYS. BUYER TO ORDER FINAL WATER READING FROM THE CITY OF DETROIT.
-
1997-04-22soldstatus $32,000
-
1993-03-10soldstatus $32,000
ⓘ Source: listings_history table (triggers on properties + properties_extension) + one-shot
backfill from property_details.listing_events for pre-trigger history.
Tax reassessment forecast MI · Partial reset (capped growth)
- Current annual tax
- $731 · $61/mo
- Projected year-2 tax
- $789 · $66/mo
- Expected delta
- +$58/yr (+$5/mo · 7.9%)
ⓘ Screening estimate from a state-policy table — verify with the county assessor before closing.
Climate risk First Street
- Flood 1/10 Low FEMA zone X (unshaded) · 0% chance over 30 yrs
- Wildfire 1/10 Low
- Heat 3/10 Moderate 7 d/yr ≥97°F today · 15 d/yr by 30 yrs out
- Wind 2/10 Low
- Air quality 3/10 Moderate 2 unhealthy d/yr today · 4 by 30 yrs out
Nearby sold comps map
Loading sold comps map…
Walkable amenities ~0.75 mi
Loading nearby amenities…
Taxation est. · year 1
- Rental income
- $15,597
- − Mortgage interest
- −$3,081
- − Property taxes
- −$731
- − Insurance
- −$275
- − Repairs & maintenance
- −$1,248
- − Management
- −$1,248
- − Depreciation
- −$1,600
- Taxable income
- $7,415
- Est. tax owed @ 24.0%
- −$1,779
- After-tax cash flow
- $6,075/yr
For passive investors: Depreciation is non-cash, so a rental often shows a tax loss while cash-flowing — sheltering income. Rental losses are passive: they offset passive income freely, and up to $25,000/yr can offset ordinary (W-2) income if you actively participate and your MAGI is under $100k (phasing out to $0 by $150k); unused losses carry forward. On sale, claimed depreciation is recaptured at up to 25%, and gains may owe capital-gains tax (a 1031 exchange can defer both). Figures are a year-1 estimate at your 24.0% rate — not tax advice; consult a CPA.
Schools (NCES district)
- District
- Detroit Public Schools Community District
- NCES district ID
- 2601103
- Math proficiency
- 10% ▼ -2.00%
- Reading proficiency
- 24% ▲ 6.00%
- Median HH income
- $25,815
- Composite
- 13.06/100
- National rank
- #9564
- State rank
- #499 of 540 in MI
Livability — Detroit
- Score
- 73/100
- State rank
- #218
- US rank
- #5427
Category grades
Schools grade is shown separately in the Schools card above.
Census & demographics
- Census place
- Detroit, MI
- City population
- 572,865
- Population (ZIP)
- 6,437
Population outlook (Wayne County) Hauer SSP2
- Today (2025)
- 1,675,273 people
- By 2030
- 1,620,300 · -3.3%
- By 2040
- 1,502,341 · -10.3%
- By 2050
- 1,384,039 · -17.4%
- By 2075
- 1,124,592 · -32.9%
- By 2100
- 881,193 · -47.4%
Race, ethnicity, and origin ACS 2023
- Neighborhood character
- Predominantly Black (78%)
- Race & ethnicity
- Black 78% Hispanic / Latino 12% Two or more races 10% White 4%
- Hispanic origin (detail)
- Mexican 5% Dominican 4%
- Common ancestry
- Lithuanian 6% Romanian 1%
- Foreign-born
- 3% · Canada
- Languages at home
- 94% English-only · Spanish 6%
Political lean MEDSL · Wayne
- 2024 margin
- Strong D (+29.0) · D 62.7% · R 33.7% · Other 3.6%
- 2008→2024 swing
- -20.5pp toward R · 2008: 49.5pp · 2024: 29.0pp
- All cycles
- 2024: D+29.0 2020: D+38.1 2016: D+37.3 2012: D+46.9 2008: D+49.5
Not yet ingested
- Civics
- —
Market trends
- HPI YoY
- ▲ 0.11%
- Current HPI
- 366.479
- Rent YoY
- —
- Metro
- —
- State GDP YoY
- ▲ 1.37%
- F500 in state
- 28
Industry mix (Fortune 500 HQ in MI)
| Industry | F500 HQs | Revenue |
|---|---|---|
| Automotive Parts | 3 | $48B |
|
||
| Automotive | 2 | $372B |
|
||
| Chemicals | 1 | $45B |
|
||
| Automotive Retail | 1 | $29B |
|
||
| Healthcare / Medical Devices | 1 | $23B |
|
||
| Automotive Technology | 1 | $20B |
|
||
Price history
+71.9% since first listed4 events — show timeline
- 2026-05-20 Listed $55,000 MiRealSource-MiMLS
- 2026-05-20 Listed $55,000 REALCOMP
- 1997-04-22 Sold (Public Records) $32,000 Public Records
- 1993-03-10 Sold (Public Records) $32,000 Public Records
Property tax history
-3.9%/yrLatest (2025): $731 · -9.7% YoY. Source: county tax records.
Cash-flow waterfall
monthlySold comps — $/sqft
last 12 mo · ≤1 miLoading sold comps…