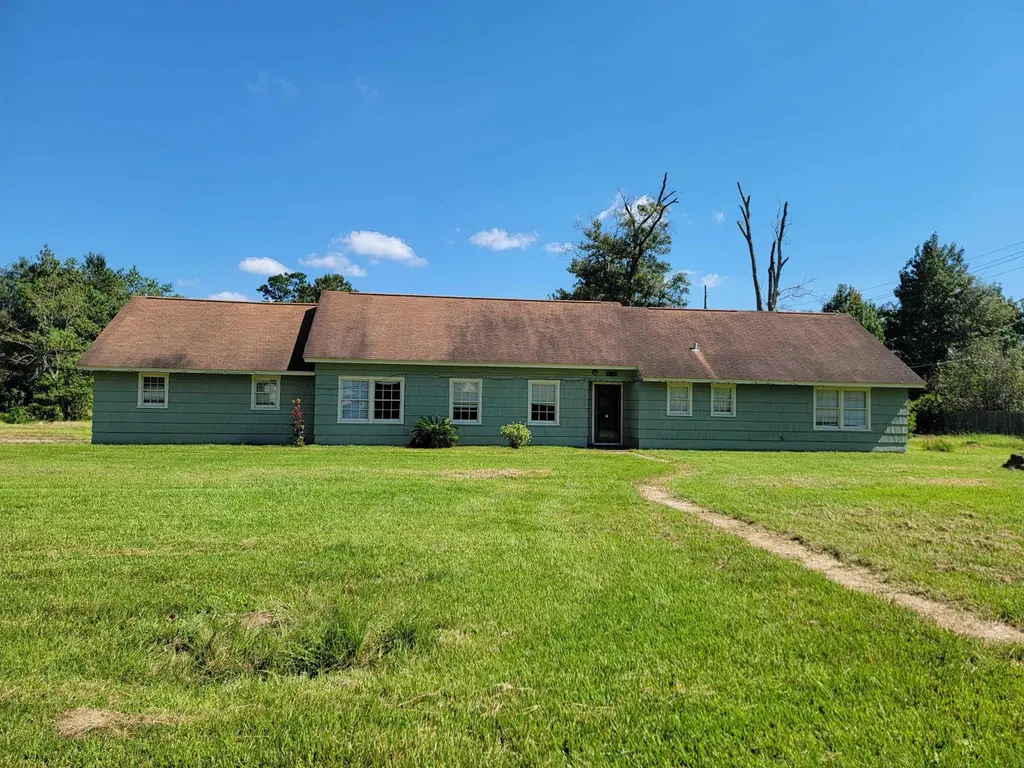
2204 24th St · Orange, TX
Flood risk 6/10 · Moderate
- FEMA flood zone
- X (shaded)
- Chance of flooding over 30 yrs
- 0.57%
- Est. flood insurance / yr
- $507 – $1,088
Fire risk 1/10 · Minimal
- Est. fire insurance / yr
- $1,222 – $2,270
Heat risk 9/10 · Severe
- Hot days now (above 109°F)
- 7 days/yr
- Hot days in 30 yrs
- 23 days/yr
Wind risk 9/10 · Severe
- Chance of severe wind over 30 yrs
- 99.0%
Air-quality risk 2/10 · Minimal
- Unhealthy air days now
- 1 days/yr
- Unhealthy air days in 30 yrs
- 1 days/yr
Risk factors via First Street. Map © Google.
Why this score? — see what drove the B grade
The composite is a weighted blend of 9 inputs, each scored 0–100. Each bar is that input's sub-score; the figure is the points it added to the 100-point composite (weight × sub-score).
- Cash flow +23.8/30.0
- ARV discount +15.0/15.0
- DSCR +7.7/10.0
- 1% rule +6.7/10.0
- Appreciation +5.5/10.0
- Rent growth +3.9/5.0
- Livability +3.6/5.0
- Condition / age +2.5/5.0
- Schools +1.6/10.0
$144,900
🖨 Deal sheet (PDF) 📄 Offer letter ✓ Due diligence
Listing remarks MLS
Large Home On A Big Beautiful Lot Close To The Golf Course! Gutted and ready to build back to your liking. This home has a lot of potential, featuring three bedrooms, a large living area, and sits on almost an acre. Call for your tour today!
Key facts
- Formal dining area
- Formal living room
- Updated kitchen
Tags
Property features AI
Exterior
- Parking: 2-car garage
- Home design: Single-family residence; Residential property
- Exterior features: Located in the John Creamer subdivision; Nearly one acre lot
Interior
- Bathrooms: 3 full bathrooms
- Interior features: Single-story layout
Neighborhood map
What this means for you Summary
Snapshot
- This is a 4-bed/3.0-bath single-family listed at $145k.
Deal economics
- At list price, monthly cash flow is $278 ($3k/yr) — positive.
- The deal already cash-flows at list — no discount required.
- Meets the 1% rule at list price ($2k rent vs $145k).
- Recommended offer: $141k (3.0% below list) — sets the bar for market timing.
- Cap rate 8.6% vs local median 3.8% in Orange — top-decile yield for the area; either an underpriced asset or a hidden risk that comps aren't pricing in. Stress-test before assuming the spread holds.
Location & tenants
- Location reads 71/100 on livability (#286 in TX) — a middle-class / working-renter tenant base. Strengths: cost of living A+, housing A+, health & safety A+; Watch: crime D+, employment D+, amenities F.
- West Orange-Cove CISD (suburban): math 17% / reading 21% proficiency, ranked #784 of 826 in TX (top 95%) — low school quality limits family demand, transient renter base, plan for 1-2y turnover; 79% free/reduced lunch — lower-income household profile, screen leases tightly.
- Zoned schools: West Orange-Stark El (math 14% / reading 17%, grade F, #3,990 of 4,322 statewide, top 93%, 1,130 students, 94% FRL); West Orange-Stark Middle (math 20% / reading 20%, grade F, #1,428 of 1,662 statewide, top 87%, 505 students, 92% FRL); West Orange-Stark H S (math 19% / reading 31%, grade F, #1,250 of 1,632 statewide, top 77%, 660 students, 88% FRL).
- Market conditions: Rents rising fast (+5.7%/yr); 338 active listings in the ZIP; 7 comparable units currently listed for rent nearby; rentals at typical pace (median 23d on market — plan ~3-4 weeks tenant-placement turnaround); 235 units permitted in Orange County in 2024 (50 in 5+ unit buildings).
- This rent runs 32% of the median local income ($64k/yr) — at the standard rent-burdened threshold; future hikes will face affordability resistance.
Forward outlook
- In year one you build about $2k of equity ($1k loan paydown + $1k appreciation (1.0% local appreciation)).
- Orange County population projected at +6% by 2050 — modest demand growth; plan on rents tracking national, not racing it.
- At projected returns (1.0% appreciation + 5.7% rent growth), your $41k cash investment doubles in ~6 years — after that, you're playing with house money.
Negotiation context
- It's been on market 57 days — a 3% lower offer ($141k) is reasonable based on typical stale-listing flexibility.
- 2 sale attempts since 5y ago; this cycle's ask has dropped $10k (6%) from the opening price — seller is motivated, your offer sets the floor, not the list.
Risks & watch-outs
- Watch-outs: built in 1957 — expect roof / HVAC / electrical / plumbing capex.
- Climate carrying-cost: major flood risk; severe wind risk, 99% chance of damaging wind over 30y; extreme-heat days projected 7→23/yr by 2055 (HVAC capex compounding) — expect insurance premiums to compound above CPI over the hold.
Questions for the listing agent
- It's been on market 57 days. Have you received any prior offers? Is the seller open to a 3% concession, seller financing, or rate buy-down credit?
- Built in 1957 — when were the roof, HVAC, electrical panel, plumbing, and water heater last replaced?
- Is there a deadline driving the sale (1031 exchange, divorce, estate, relocation)? That informs how much negotiation room exists.
- Schools are D-rated, which usually means shorter tenancies and higher turnover. Who's the typical renter profile here, and what's been the actual vacancy rate?
- Crime grade is D in this area — have there been break-ins, vandalism, or insurance claims at this property in the last 3 years? What carrier currently insures it and at what premium?
- What's the average days-on-market for RENTAL listings here right now (not sales)? A rising rental-DOM trend means longer vacancies and softer asking-rent achievability than the comps imply.
- What's the recent tenant-quality profile in this submarket — average credit score on applications, eviction rate, late-payment / NSF rate, and stable-employment percentage? A property-management company in the area should have these aggregated.
- How much new for-sale + rental construction is in the pipeline within 1–3 miles? Heavy new supply typically softens prices + rents 12–24 months out; constrained supply supports both.
Investment metrics
- 1% rule
- 1.17% ✓
- Cap rate
- 8.60%
- Cash-on-cash
- 8.22%
- DSCR
- 1.37
- GRM
- 7.1
CMA / ARV
- ARV (median comp)
- $197,603
- List price
- $144,900
- Delta
- -26.67%
- Verdict
- UNDERPRICED
- Comps
- 20 within 1.0 mi
Show comp detail 12 sales within ~0.75 mi
| Address | Dist | Beds/Ba | Sqft | Sold | Price | $/sf | Match |
|---|---|---|---|---|---|---|---|
| 2309 Tilley Cir | 0.34mi | 4/2.0 | 2,121 (+2%) | 5mo | $219,900 | $104 | 73 |
| 2140 Live Oak Rd | 0.20mi | 3/2.5 (-1) | 2,242 (+8%) | 4mo | $259,900 | $116 | 68 |
| 11 Regency | 0.60mi | 3/2.5 (-1) | 2,088 (+1%) | 1mo | $249,900 | $120 | 63 |
| 2600 Country Club Dr | 0.30mi | 4/2.0 | 2,142 (+3%) | 17mo | $249,900 | $117 | 63 |
| 29 Knotty Pine Ln | 0.26mi | 3/2.0 (-1) | 2,318 (+12%) | 1mo | $259,900 | $112 | 58 |
| 2012 Melwood | 0.36mi | 3/2.0 (-1) | 1,840 (-11%) | 9mo | $229,900 | $125 | 48 |
| 2517 Thunderbird Dr | 0.62mi | 3/2.0 (-1) | 2,211 (+7%) | 6mo | $222,500 | $101 | 46 |
| 2308 Tilley Cir | 0.37mi | 3/1.5 (-1) | 2,194 (+6%) | 24mo | $99,500 | $45 | 42 |
| 3117 Pebble Beach Ln | 0.58mi | 3/2.5 (-1) | 1,975 (-5%) | 22mo | $237,000 | $120 | 40 |
| 2514 Thunderbird Dr | 0.65mi | 3/2.0 (-1) | 1,799 (-13%) | 7mo | $214,500 | $119 | 33 |
| 1210 17th St | 0.72mi | 3/2.0 (-1) | 1,877 (-10%) | 15mo | $45,000 | $24 | 29 |
| 1705 Burton Ave | 0.61mi | 3/2.0 (-1) | 2,249 (+8%) | 23mo | $179,900 | $80 | 29 |
Match score weights: distance 35% · size 25% · config 20% · recency 20%. Top-matched comps best support the ARV.
Projected returns pro-forma
1.01% appreciation · 5.71% rent growth · sell at horizon
- IRR
- 12.0%
- Equity multiple
- 1.62×
- Total profit
- $25,286
- Equity at exit
- $49,541
- IRR
- 17.5%
- Equity multiple
- 3.29×
- Total profit
- $92,906
- Equity at exit
- $65,894
Cash invested: $40,572 (down + closing). Projections, not guarantees.
Landlord ↔ Tenant lean methodology
- Overall (STATE)
- 87 Strongly Landlord-Friendly
- State Texas
- 87 Strongly Landlord-Friendly · R+5
- County
- — inherits STATE
- City
- — inherits STATE
ZIP-level market 77630
- Home prices YoY
- 0.4%
- Rents YoY
- 5.7%
- Active inventory
- 338
- Price-to-rent
- 7.1×
Monthly cashflow live
- Estimated rent
- $1,691 high interval (Pro) →
- Mortgage (P&I)
- −$760
- Tax from tax record
- −$237 /mo · $2,848/yr
- Insurance
- −$60
- HOA
- −$0
- Vacancy / Maint / Mgmt
- −$355
- Net cashflow
- $278
Break-even live
Sensitivity live
| Price | -10% $360 | -5% $319 | +0% $278 | +5% $237 | +10% $196 |
|---|---|---|---|---|---|
| Rent | -10% $145 | -5% $211 | +0% $278 | +5% $345 | +10% $412 |
| Rate | -1.0pp $351 | -0.5pp $315 | base $278 | +0.5pp $241 | +1.0pp $202 |
UW: 25.0% down · 7.5% · 30yr · 1.5% tax · 5.0% vac · 8.0% maint · 8.0% mgmt
Financing live
Cash to close
- Down payment
- $36,225
- Closing costs
- $4,347
- Reserves months
- —
- Total cash needed
- —
Loan-product check · same deal, 3 products live
Conventional
25% down · 7.5% · 30yr
- Down + closing
- —
- Monthly P&I
- —
- Monthly cashflow
- —
- DSCR
- —
- Eligible?
- —
Personal DTI + credit; lowest rate.
DSCR
20% down · 8.5% · 30yr
- Down + closing
- —
- Monthly P&I
- —
- Monthly cashflow
- —
- DSCR
- —
- Eligible?
- —
No personal income docs; deal must DSCR.
Hard money
10% down · 12.0% · 12mo
- Down + closing
- —
- Monthly P&I
- —
- Monthly cashflow
- —
- DSCR
- —
- Eligible?
- —
Short-term bridge; refi at stabilization.
Rent comps 7 comps
| Address | Beds | Baths | Sqft | Rent | $/sqft | DOM | Units | Dist |
|---|---|---|---|---|---|---|---|---|
| 2801 W Sunset Dr Orange, TX | 1.0–3.0 | 1.0–2.0 | 1113 | $1,400 | $1.26 | 15d | 27 | 0.33mi |
| 1117 18th St Orange, TX | 4.0 | 2.0 | 1716 | $1,500 | $0.87 | 45d | 1 | 0.70mi |
| 1205 Wrenway Orange, TX | 4.0 | 2.0 | 1551 | $1,775 | $1.14 | 15d | 1 | 0.76mi |
| 20 Pinewood Cir Orange, TX | 3.0 | 2.5 | 2252 | $2,150 | $0.95 | 45d | 1 | 0.79mi |
| 3333 Ridgemont Dr Unit 401 Orange, TX | 3.0 | 2.0 | 1700 | $1,725 | $1.01 | 22d | 1 | 1.17mi |
| 4417 Willowglen St Orange, TX | 3.0 | 2.0 | 1658 | $1,650 | $1.00 | 15d | 1 | 1.28mi |
| 306 Bridal Wreath Ave Orange, TX | 3.0 | 1.0 | 1529 | $1,195 | $0.78 | 22d | 1 | 1.42mi |
Listing history 21 events
-
2026-06-21days on market $144,900 Active 57 DOM
-
2026-06-18days on market $144,900 Active 54 DOM
-
2026-06-17days on market $144,900 Active 53 DOM
-
2026-06-16days on market $144,900 Active 52 DOM
-
2026-06-15days on market $144,900 Active 51 DOM
-
2026-06-14days on market $144,900 Active 49 DOM
-
2026-06-13days on market $144,900 Active 48 DOM
-
2026-06-10days on market $144,900 Active 46 DOM
-
2026-06-09days on market $144,900 Active 45 DOM
-
2026-06-08days on market $144,900 Active 44 DOM
-
2026-06-07pricedays on market $144,900 Active 43 DOM
-
2026-06-03days on market $154,900 Active 39 DOM
-
2026-06-02days on market $154,900 Active 38 DOM
-
2026-06-01days on market $154,900 Active 37 DOM
-
2026-05-31days on market $154,900 Active 36 DOM
-
2026-05-30days on market $154,900 Active 35 DOM
-
2026-04-25$154,900 Active 727-char remark
-
2021-10-29soldstatus 241-char remark
Show marketing remark (241 chars)
Large Home On A Big Beautiful Lot Close To The Golf Course! Gutted and ready to build back to your liking. This home has a lot of potential, featuring three bedrooms, a large living area, and sits on almost an acre. Call for your tour today!
-
2021-10-13$60,000 241-char remark
Show marketing remark (241 chars)
Large Home On A Big Beautiful Lot Close To The Golf Course! Gutted and ready to build back to your liking. This home has a lot of potential, featuring three bedrooms, a large living area, and sits on almost an acre. Call for your tour today!
-
2015-01-20soldstatus
-
2010-06-01soldstatus
ⓘ Source: listings_history table (triggers on properties + properties_extension) + one-shot
backfill from property_details.listing_events for pre-trigger history.
Tax reassessment forecast TX · Resets to sale price
- Current annual tax
- $2,848 · $237/mo
- Projected year-2 tax
- $2,848 · $237/mo
- Expected delta
- $0/yr ($0/mo · -0.0%)
ⓘ Screening estimate from a state-policy table — verify with the county assessor before closing.
Climate risk First Street
- Flood 6/10 Major FEMA zone X (shaded) · 57% chance over 30 yrs
- Wildfire 1/10 Low
- Heat 9/10 Extreme 7 d/yr ≥109°F today · 23 d/yr by 30 yrs out
- Wind 9/10 Extreme 99% chance of damaging wind over 30 yrs
- Air quality 2/10 Low 1 unhealthy d/yr today · 1 by 30 yrs out
Nearby sold comps map
Loading sold comps map…
Walkable amenities ~0.75 mi
Loading nearby amenities…
Taxation est. · year 1
- Rental income
- $20,289
- − Mortgage interest
- −$8,117
- − Property taxes
- −$2,848
- − Insurance
- −$724
- − Repairs & maintenance
- −$1,623
- − Management
- −$1,623
- − Depreciation
- −$4,215
- Taxable income
- $1,138
- Est. tax owed @ 24.0%
- −$273
- After-tax cash flow
- $3,064/yr
For passive investors: Depreciation is non-cash, so a rental often shows a tax loss while cash-flowing — sheltering income. Rental losses are passive: they offset passive income freely, and up to $25,000/yr can offset ordinary (W-2) income if you actively participate and your MAGI is under $100k (phasing out to $0 by $150k); unused losses carry forward. On sale, claimed depreciation is recaptured at up to 25%, and gains may owe capital-gains tax (a 1031 exchange can defer both). Figures are a year-1 estimate at your 24.0% rate — not tax advice; consult a CPA.
Schools (NCES district)
- District
- West Orange-Cove CISD
- NCES district ID
- 4845090
- Math proficiency
- 17% ▼ -7.00%
- Reading proficiency
- 21% ▼ -2.00%
- Median HH income
- $37,329
- Composite
- 15.86/100
- National rank
- #9260
- State rank
- #784 of 826 in TX
Livability — Orange
- Score
- 71/100
- State rank
- #286
- US rank
- #6456
Category grades
Schools grade is shown separately in the Schools card above.
Census & demographics
- Census place
- Orange, TX
- County
- Orange County · 87,112 people
- City population
- 22,976
- Metro
- Beaumont-Port Arthur, TX
- Population (ZIP)
- 28,983
- Household income
- $64,373
- Rent vs Own
- Severe rent burden
- 1018.0
Population outlook (Orange County) Hauer SSP2
- Today (2025)
- 88,065 people
- By 2030
- 89,591 · +1.7%
- By 2040
- 91,982 · +4.4%
- By 2050
- 93,023 · +5.6%
- By 2075
- 94,871 · +7.7%
- By 2100
- 88,155 · +0.1%
Race, ethnicity, and origin ACS 2023
- Neighborhood character
- Majority White (64%)
- Race & ethnicity
- White 64% Black 21% Hispanic / Latino 11% Two or more races 9%
- Hispanic origin (detail)
- Mexican 7%
- Common ancestry
- Lithuanian 13% Italian 1% Slovak 1%
- Foreign-born
- 5% · Canada
- Languages at home
- 91% English-only · Spanish 7% French/Haitian/Cajun 1% Other Asian/Pacific 1%
Political lean MEDSL · Orange
- 2024 margin
- Solid R (+66.8) · D 16.4% · R 83.1%
- 2008→2024 swing
- -19.6pp toward R · 2008: -47.1pp · 2024: -66.8pp
- All cycles
- 2024: R+66.8 2020: R+63.4 2016: R+61.9 2012: R+54.3 2008: R+47.1
Not yet ingested
- Civics
- —
Market trends
- HPI YoY
- ▲ 1.01%
- Current HPI
- 264.14
- Rent YoY
- ▲ 5.71%
- Metro
- Beaumont-Port Arthur, TX
- State GDP YoY
- ▲ 3.95%
- F500 in state
- 110
Industry mix (Fortune 500 HQ in TX)
| Industry | F500 HQs | Revenue |
|---|---|---|
| Energy | 16 | $1,198B |
|
||
| Technology | 5 | $198B |
|
||
| Engineering / Construction | 4 | $72B |
|
||
| Energy Services | 3 | $60B |
|
||
| Utilities | 3 | $41B |
|
||
| Healthcare | 2 | $330B |
|
||
Price history
+141.5% since first listed6 events — show timeline
- 2026-06-04 Price Changed $144,900 BBOR
- 2026-04-25 Listed $154,900 BBOR
- 2021-10-29 Sold (MLS) — BBOR
- 2021-10-13 Listed $60,000 BBOR
- 2015-01-20 Sold (Public Records) — Public Records
- 2010-06-01 Sold (Public Records) — Public Records
Property tax history
-1.6%/yrLatest (2025): $2,848 · +20.0% YoY. Source: county tax records.
Cash-flow waterfall
monthlySold comps — $/sqft
last 12 mo · ≤1 miLoading sold comps…