 🏷️ Likely Rental
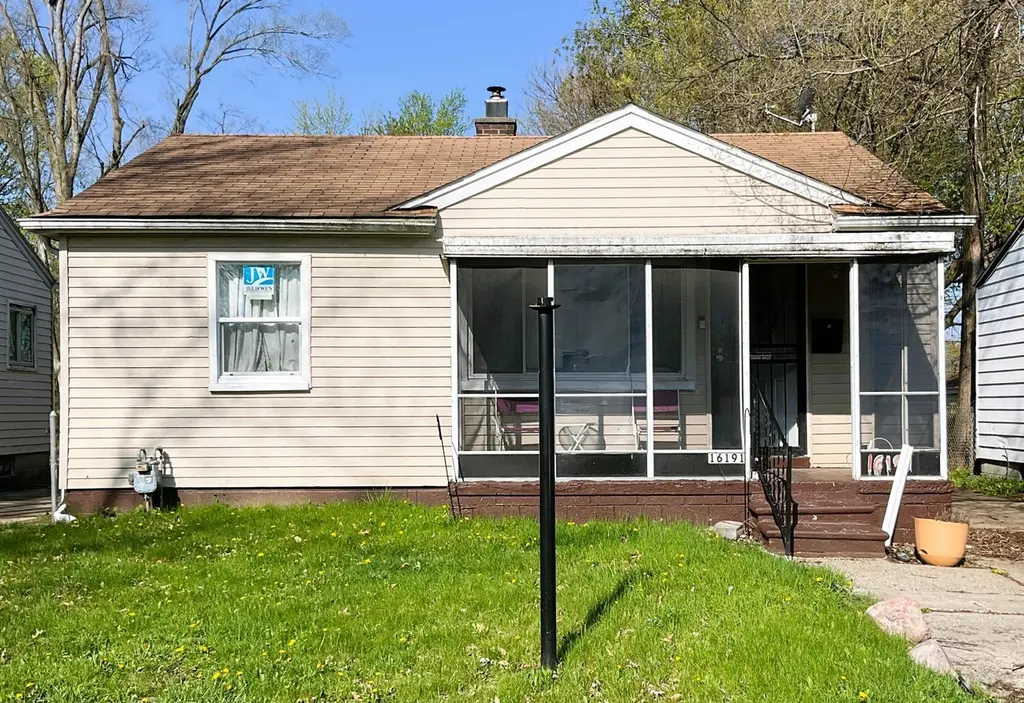
16191 Salem · Detroit, MI
Flood risk 1/10 · Minimal
- FEMA flood zone
- X (unshaded)
- Chance of flooding over 30 yrs
- 0.0%
- Est. flood insurance / yr
- $473 – $860
Fire risk 1/10 · Minimal
- Est. fire insurance / yr
- $784 – $1,456
Heat risk 3/10 · Minor
- Hot days now (above 98°F)
- 7 days/yr
- Hot days in 30 yrs
- 15 days/yr
Wind risk 2/10 · Minimal
- Chance of severe wind over 30 yrs
- —
Air-quality risk 3/10 · Minor
- Unhealthy air days now
- 2 days/yr
- Unhealthy air days in 30 yrs
- 3 days/yr
Risk factors via First Street. Map © Google.
Why this score? — see what drove the C+ grade
The composite is a weighted blend of 9 inputs, each scored 0–100. Each bar is that input's sub-score; the figure is the points it added to the 100-point composite (weight × sub-score).
- Cash flow +20.0/30.0
- ARV discount +15.0/15.0
- 1% rule +7.3/10.0
- DSCR +6.4/10.0
- Rent growth +4.5/5.0
- Livability +3.7/5.0
- Condition / age +2.5/5.0
- Schools +1.3/10.0
- Appreciation +0.0/10.0
$89,900
🖨 Deal sheet 📄 Offer letter ✓ Due diligence
Listing remarks MLS
Well-maintained tenant-occupied home located in a desirable residential neighborhood near schools, parks, shopping, and major roadways. Features a full basement and 2-car garage. Currently rented at $1,000 per month. Showings and inspections will be scheduled only upon acceptance of an offer. BATVAI.
Key facts
- Near schools
- Near shopping
- Full basement
Tags
Property features AI
Exterior
- Parking: Detached 2-car garage
- Utilities: Public water
- Home design: Single-family residence; Residential property; Built in 1950
- Construction: Vinyl siding construction
- Exterior features: Vinyl siding; Lot of 0.16 acres; Public water
Interior
- Bathrooms: 1 full bathroom
- Heating & cooling: Forced air heating
- Interior features: Full basement; Two total rooms
Neighborhood map
What this means for you Summary
Snapshot
- This is a 2-bed/1.0-bath single-family listed at $90k.
Deal economics
- At list price, monthly cash flow is $111 ($1k/yr) — positive.
- The deal already cash-flows at list — no discount required.
- Meets the 1% rule at list price ($1k rent vs $90k).
- Cap rate 7.8% vs local median 10.2% in Detroit — below-typical yield; the buyer is paying a premium for something (appreciation thesis, condition, location) that the cap rate doesn't capture.
Location & tenants
- Location reads 73/100 on livability (#218 in MI) — a middle-class / working-renter tenant base. Strengths: amenities A+, commute A+, cost of living A+; Watch: schools F, crime F, employment F.
- Detroit Public Schools Community District (urban): math 10% / reading 24% proficiency, ranked #499 of 540 in MI (top 92%) — low school quality limits family demand, transient renter base, plan for 1-2y turnover; 90% free/reduced lunch — lower-income household profile, screen leases tightly.
- Market conditions: Rents rising fast (+8.0%/yr); 305 active listings in the ZIP; 40 comparable units currently listed for rent nearby; rentals lingering (median 44d on market — plan ~5-8 weeks vacancy on turnover, expect pricing pressure); 75% of comp listings sitting > 30 days — soft ceiling on asking rent; lower-income renter base — watch delinquency; 2,639 units permitted in Wayne County in 2024 (1,216 in 5+ unit buildings).
- This rent runs 30% of the median local income ($44k/yr) — at the standard rent-burdened threshold; future hikes will face affordability resistance.
Forward outlook
- Local home prices are declining (-3.0%/yr); year-one equity from $622 of loan paydown is wiped out by about $3k of value loss. Plan a longer hold.
- Wayne County population projected at -17% by 2050 — secular population decline; favor cash flow + early exit over multi-decade hold.
- At projected returns (-3.0% appreciation + 8.0% rent growth), your $25k cash investment doubles in ~9 years — after that, you're playing with house money.
Negotiation context
- Only 6 days on market — expect competitive offers; lowballing is unlikely to land.
- 4 sale attempts since 22y ago with the ask held roughly flat each time — persistent listings suggest the price (not the market) is what's stuck; bring a comps-based counter.
Risks & watch-outs
- Watch-outs: property tax is 3.4% of price; built in 1950 — expect roof / HVAC / electrical / plumbing capex.
Questions for the listing agent
- Built in 1950 — when were the roof, HVAC, electrical panel, plumbing, and water heater last replaced?
- Property tax is high relative to price — has the assessment been appealed recently, and will the sale trigger a re-assessment?
- Is there a deadline driving the sale (1031 exchange, divorce, estate, relocation)? That informs how much negotiation room exists.
- Schools are F-rated, which usually means shorter tenancies and higher turnover. Who's the typical renter profile here, and what's been the actual vacancy rate?
- Crime grade is F in this area — have there been break-ins, vandalism, or insurance claims at this property in the last 3 years? What carrier currently insures it and at what premium?
- What's the average days-on-market for RENTAL listings here right now (not sales)? A rising rental-DOM trend means longer vacancies and softer asking-rent achievability than the comps imply.
- What's the recent tenant-quality profile in this submarket — average credit score on applications, eviction rate, late-payment / NSF rate, and stable-employment percentage? A property-management company in the area should have these aggregated.
- How much new for-sale + rental construction is in the pipeline within 1–3 miles? Heavy new supply typically softens prices + rents 12–24 months out; constrained supply supports both.
Investment metrics
- 1% rule
- 1.23% ✓
- Cap rate
- 7.77%
- Cash-on-cash
- 5.28%
- DSCR
- 1.24
- GRM
- 6.8
CMA / ARV
- ARV (on-the-fly)
- $119,427
- Comps found
- 12
Show comp detail 12 sales within ~0.75 mi
| Address | Dist | Beds/Ba | Sqft | Sold | Price | $/sf | Match |
|---|---|---|---|---|---|---|---|
| 16618 Salem St | 0.18mi | 2/1.0 | 833 (-2%) | 4mo | $47,500 | $57 | 85 |
| 24859 Puritan | 0.11mi | 2/1.0 | 768 (-9%) | 2mo | $92,000 | $120 | 78 |
| 25012 Midland | 0.23mi | 2/1.0 | 900 (+6%) | 4mo | $85,000 | $94 | 76 |
| 16230 Winston St | 0.12mi | 3/1.0 (+1) | 917 (+8%) | 1mo | $80,000 | $87 | 75 |
| 15490 Dixie | 0.40mi | 3/1.0 (+1) | 912 (+8%) | 2mo | $135,000 | $148 | 62 |
| 15854 Leona Dr | 0.42mi | 2/1.0 | 768 (-9%) | 5mo | $130,000 | $169 | 60 |
| 15512 Dixie | 0.37mi | 3/1.0 (+1) | 924 (+9%) | 4mo | $130,000 | $141 | 59 |
| 15887 Beech Daly | 0.62mi | 2/1.0 | 898 (+6%) | 4mo | $158,000 | $176 | 58 |
| 16841 Winston St | 0.29mi | 3/1.0 (+1) | 954 (+13%) | 4mo | $95,500 | $100 | 57 |
| 15938 Lola Dr | 0.48mi | 2/1.0 | 950 (+12%) | 3mo | $139,000 | $146 | 55 |
| 25339 Keeler | 0.63mi | 2/1.0 | 768 (-9%) | 3mo | $141,000 | $184 | 53 |
| 17324 Salem St | 0.60mi | 2/1.0 | 954 (+13%) | 2mo | $74,900 | $79 | 49 |
Match score weights: distance 35% · size 25% · config 20% · recency 20%. Top-matched comps best support the ARV.
Projected returns pro-forma
-3.0% appreciation · 8.0% rent growth · sell at horizon
- IRR
- -1.5%
- Equity multiple
- 0.94×
- Total profit
- $-1,560
- Equity at exit
- $13,404
- IRR
- 13.6%
- Equity multiple
- 2.38×
- Total profit
- $34,753
- Equity at exit
- $7,773
Cash invested: $25,172 (down + closing). Projections, not guarantees.
Landlord ↔ Tenant lean methodology
- Overall (STATE)
- 62 Landlord-Friendly
- State Michigan
- 62 Landlord-Friendly · EVEN
- County
- — inherits STATE
- City
- — inherits STATE
ZIP-level market 48219
- Home prices YoY
- -10.3%
- Rents YoY
- 8.0%
- Active inventory
- 305
- Price-to-rent
- 6.8×
Monthly cashflow live
- Estimated rent
- $1,106 high interval (Pro) →
- Mortgage (P&I)
- −$471
- Tax from tax record
- −$254 /mo · $3,046/yr
- Insurance
- −$37
- HOA
- −$0
- Vacancy / Maint / Mgmt
- −$232
- Net cashflow
- $111
Break-even live
UW: 25.0% down · 7.5% · 30yr · 1.5% tax · 5.0% vac · 8.0% maint · 8.0% mgmt
Financing live
Cash to close
- Down payment
- $22,475
- Closing costs
- $2,697
- Reserves months
- —
- Total cash needed
- —
Loan-product check · same deal, 3 products live
Conventional
25% down · 7.5% · 30yr
- Down + closing
- —
- Monthly P&I
- —
- Monthly cashflow
- —
- DSCR
- —
- Eligible?
- —
Personal DTI + credit; lowest rate.
DSCR
20% down · 8.5% · 30yr
- Down + closing
- —
- Monthly P&I
- —
- Monthly cashflow
- —
- DSCR
- —
- Eligible?
- —
No personal income docs; deal must DSCR.
Hard money
10% down · 12.0% · 12mo
- Down + closing
- —
- Monthly P&I
- —
- Monthly cashflow
- —
- DSCR
- —
- Eligible?
- —
Short-term bridge; refi at stabilization.
Rent comps 40 comps
| Address | Beds | Baths | Sqft | Rent | $/sqft | DOM | Units | Dist |
|---|---|---|---|---|---|---|---|---|
| 16581 Wormer St Detroit, MI | 2.0 | 1.0 | 720 | $1,100 | $1.53 | 44d | 1 | 0.33mi |
| 16207 Woodbine St Detroit, MI | 3.0 | 1.0 | 1000 | $1,294 | $1.29 | 5d | 1 | 0.34mi |
| 15490 Dixie Redford, MI | 3.0 | 1.0 | 912 | $1,600 | $1.75 | 5d | 1 | 0.37mi |
| 16800 Wormer St Detroit, MI | 3.0 | 1.0 | 912 | $1,250 | $1.37 | 18d | 1 | 0.41mi |
| 24651 W McNichols Rd Detroit, MI | 1.0 | 1.0 | 700 | $800 | $1.14 | 44d | 4 | 0.41mi |
| 16131 Dale St Detroit, MI | 3.0 | 1.0 | 1100 | $1,500 | $1.36 | 18d | 1 | 0.47mi |
| 24244 Dale St Unit 211 Detroit, MI | 1.0 | 1.0 | 550 | $800 | $1.45 | 24d | 1 | 0.50mi |
| 24235 W McNichols Rd Detroit, MI | 1.0 | 1.0 | 700 | $800 | $1.14 | 44d | 4 | 0.52mi |
| 16800 Telegraph Rd Detroit, MI | 2.0 | 1.0 | 775 | $875 | $1.13 | 44d | 1 | 0.54mi |
| 17324 Salem St Detroit, MI | 2.0 | 1.0 | 989 | $1,200 | $1.21 | 24d | 1 | 0.63mi |
| 15195 Aubrey Redford, MI | 3.0 | 1.0 | 769 | $1,395 | $1.81 | 17d | 1 | 0.71mi |
| 25822 W 6 Mile Rd Redford Township, MI | 2.0 | 2.0 | 1100 | $1,100 | $1.00 | 24d | 1 | 0.75mi |
| 18302 Wormer St Detroit, MI | 3.0 | 1.0 | 1046 | $1,475 | $1.41 | 44d | 1 | 1.08mi |
| 15847 Chatham St Detroit, MI | 3.0 | 1.0 | 909 | $1,325 | $1.46 | 5d | 1 | 1.10mi |
| 18732 Salem Unit 2 Detroit, MI | 2.0 | 1.0 | 925 | $1,050 | $1.14 | 12d | 1 | 1.31mi |
| 14292 Riverview St Detroit, MI | 2.0 | 1.0 | 900 | $900 | $1.00 | 44d | 1 | 1.36mi |
| 14286 Riverview St Unit HF Detroit, MI | 2.0 | 1.0 | 900 | $900 | $1.00 | 44d | 1 | 1.37mi |
| 14302 Riverview St Detroit, MI | 2.0 | 1.0 | 900 | $900 | $1.00 | 44d | 1 | 1.37mi |
| 14298 Riverview St Detroit, MI | 2.0 | 1.0 | 900 | $985 | $1.09 | 44d | 1 | 1.37mi |
| 14294 Riverview St Detroit, MI | 2.0 | 1.0 | 900 | $900 | $1.00 | 44d | 1 | 1.37mi |
| 14300 Riverview St Detroit, MI | 2.0 | 1.0 | 900 | $985 | $1.09 | 44d | 1 | 1.37mi |
| 14290 Riverview St Unit 106 Detroit, MI | 1.0 | 1.0 | 550 | $695 | $1.26 | 44d | 1 | 1.37mi |
| 14290 Riverview St Unit 208 Detroit, MI | 1.0 | 1.0 | 550 | $845 | $1.54 | 44d | 1 | 1.37mi |
| 14296 Riverview St Detroit, MI | 2.0 | 1.0 | 900 | $985 | $1.09 | 44d | 1 | 1.37mi |
| 14310 Riverview St Detroit, MI | 2.0 | 1.0 | 900 | $900 | $1.00 | 44d | 1 | 1.37mi |
| 14284 Riverview St Detroit, MI | 2.0 | 1.0 | 900 | $985 | $1.09 | 44d | 1 | 1.38mi |
| 14282 Riverview St Detroit, MI | 2.0 | 1.0 | 900 | $800 | $0.89 | 44d | 1 | 1.38mi |
| 14283 Riverview St Detroit, MI | 2.0 | 1.0 | 900 | $900 | $1.00 | 44d | 1 | 1.38mi |
| 14252 Riverview St Detroit, MI | 2.0 | 1.0 | 900 | $985 | $1.09 | 44d | 1 | 1.38mi |
| 14250 Riverview St Detroit, MI | 2.0 | 1.0 | 900 | $900 | $1.00 | 44d | 1 | 1.38mi |
| 14262 Riverview St Detroit, MI | 2.0 | 1.0 | 900 | $985 | $1.09 | 44d | 1 | 1.38mi |
| 14272 Riverview St Unit 214 Detroit, MI | 1.0 | 1.0 | 550 | $695 | $1.26 | 44d | 1 | 1.38mi |
| 14260 Riverview St Detroit, MI | 2.0 | 1.0 | 900 | $900 | $1.00 | 44d | 1 | 1.38mi |
| 14272 Riverview St Apt 213 Detroit, MI | 1.0 | 1.0 | 550 | $845 | $1.54 | 44d | 1 | 1.38mi |
| 14264 Riverview St Detroit, MI | 2.0 | 1.0 | 900 | $900 | $1.00 | 44d | 1 | 1.38mi |
| 14272 Riverview St Unit 216 Detroit, MI | 1.0 | 1.0 | 550 | $795 | $1.45 | 44d | 1 | 1.38mi |
| 14266 Riverview St Detroit, MI | 2.0 | 1.0 | 900 | $900 | $1.00 | 44d | 1 | 1.38mi |
| 14268 Riverview St Detroit, MI | 2.0 | 1.0 | 900 | $850 | $0.94 | 44d | 1 | 1.38mi |
| 14246 Riverview St Unit A Detroit, MI | 2.0 | 1.0 | 900 | $985 | $1.09 | 44d | 1 | 1.39mi |
| 14246 Riverview St Unit RB Detroit, MI | 2.0 | 1.0 | 900 | $895 | $0.99 | 44d | 1 | 1.39mi |
Listing history 6 events
-
2026-06-18days on market $89,900 Active 6 DOM
-
2026-06-17days on market $89,900 Active 5 DOM
-
2026-06-16days on market $89,900 Active 4 DOM
-
2026-06-15days on market $89,900 Active 3 DOM
-
2026-06-13remarks 301-char remark
-
2026-06-13$89,900 Active 1 DOM
ⓘ Source: listings_history table (triggers on properties + properties_extension) + one-shot
backfill from property_details.listing_events for pre-trigger history.
Tax reassessment forecast MI · Partial reset (capped growth)
- Current annual tax
- $3,046 · $254/mo
- Projected year-2 tax
- $3,046 · $254/mo
- Expected delta
- $0/yr ($0/mo · 0.0%)
ⓘ Screening estimate from a state-policy table — verify with the county assessor before closing.
Climate risk First Street
- Flood 1/10 Low FEMA zone X (unshaded) · 0% chance over 30 yrs
- Wildfire 1/10 Low
- Heat 3/10 Moderate 7 d/yr ≥98°F today · 15 d/yr by 30 yrs out
- Wind 2/10 Low
- Air quality 3/10 Moderate 2 unhealthy d/yr today · 3 by 30 yrs out
Nearby sold comps map
Loading sold comps map…
Walkable amenities ~0.75 mi
Loading nearby amenities…
Taxation est. · year 1
- Rental income
- $13,270
- − Mortgage interest
- −$5,036
- − Property taxes
- −$3,046
- − Insurance
- −$450
- − Repairs & maintenance
- −$1,062
- − Management
- −$1,062
- − Depreciation
- −$2,615
- Taxable loss
- −$0
- Est. tax savings @ 24.0%
- +$0
- After-tax cash flow
- $1,330/yr
For passive investors: Depreciation is non-cash, so a rental often shows a tax loss while cash-flowing — sheltering income. Rental losses are passive: they offset passive income freely, and up to $25,000/yr can offset ordinary (W-2) income if you actively participate and your MAGI is under $100k (phasing out to $0 by $150k); unused losses carry forward. On sale, claimed depreciation is recaptured at up to 25%, and gains may owe capital-gains tax (a 1031 exchange can defer both). Figures are a year-1 estimate at your 24.0% rate — not tax advice; consult a CPA.
Schools (NCES district)
- District
- Detroit Public Schools Community District
- NCES district ID
- 2601103
- Math proficiency
- 10% ▼ -2.00%
- Reading proficiency
- 24% ▲ 6.00%
- Median HH income
- $25,815
- Composite
- 13.06/100
- National rank
- #9564
- State rank
- #499 of 540 in MI
Livability — Detroit
- Score
- 73/100
- State rank
- #218
- US rank
- #5427
Category grades
Schools grade is shown separately in the Schools card above.
Census & demographics
- Census place
- Detroit, MI
- County
- Wayne County · 1,562,939 people
- City population
- 572,865
- Metro
- Detroit-Warren-Dearborn, MI
- Population (ZIP)
- 47,208
- Household income
- $43,655
- Rent vs Own
- Severe rent burden
- 3584.0
Population outlook (Wayne County) Hauer SSP2
- Today (2025)
- 1,675,273 people
- By 2030
- 1,620,300 · -3.3%
- By 2040
- 1,502,341 · -10.3%
- By 2050
- 1,384,039 · -17.4%
- By 2075
- 1,124,592 · -32.9%
- By 2100
- 881,193 · -47.4%
Race, ethnicity, and origin ACS 2023
- Neighborhood character
- Predominantly Black (88%)
- Race & ethnicity
- Black 88% White 5% Two or more races 4% Hispanic / Latino 1%
- Common ancestry
- Romanian 1% Lithuanian 1%
- Foreign-born
- 2% · Canada
- Languages at home
- 96% English-only · Spanish 1% French/Haitian/Cajun 1%
Political lean MEDSL · Wayne
- 2024 margin
- Strong D (+29.0) · D 62.7% · R 33.7% · Other 3.6%
- 2008→2024 swing
- -20.5pp toward R · 2008: 49.5pp · 2024: 29.0pp
- All cycles
- 2024: D+29.0 2020: D+38.1 2016: D+37.3 2012: D+46.9 2008: D+49.5
Not yet ingested
- Civics
- —
Market trends
- HPI YoY
- ▼ -65.06%
- Current HPI
- 563.3263
- Rent YoY
- ▲ 8.04%
- Metro
- Detroit-Warren-Dearborn, MI
- State GDP YoY
- ▲ 1.37%
- F500 in state
- 28
Industry mix (Fortune 500 HQ in MI)
| Industry | F500 HQs | Revenue |
|---|---|---|
| Automotive Parts | 3 | $48B |
|
||
| Automotive | 2 | $372B |
|
||
| Chemicals | 1 | $45B |
|
||
| Automotive Retail | 1 | $29B |
|
||
| Healthcare / Medical Devices | 1 | $23B |
|
||
| Automotive Technology | 1 | $20B |
|
||
Price history
+12.5% since first listed11 events — show timeline
- 2026-06-12 Listed $89,900 MiRealSource-MiMLS
- 2026-06-12 Listed $89,900 SW Michigan MLS
- 2023-07-05 Sold (Public Records) $305,000 Public Records
- 2023-06-22 Sold (Public Records) $91,000 Public Records
- 2022-09-01 Price Changed $1,200 RENT.
- 2022-07-26 Price Changed $1,200 RENT.
- 2008-01-09 Listing Removed — REALCOMP
- 2007-11-30 Listed $19,900 REALCOMP
- 2006-10-30 Sold (Public Records) $85,600 Public Records
- 2005-06-26 Listing Removed — REALCOMP
- 2004-12-27 Listed $79,900 REALCOMP
Property tax history
+10.6%/yrLatest (2025): $3,046 · +32.4% YoY. Source: county tax records.
Cash-flow waterfall
monthlySold comps — $/sqft
last 12 mo · ≤1 miLoading sold comps…