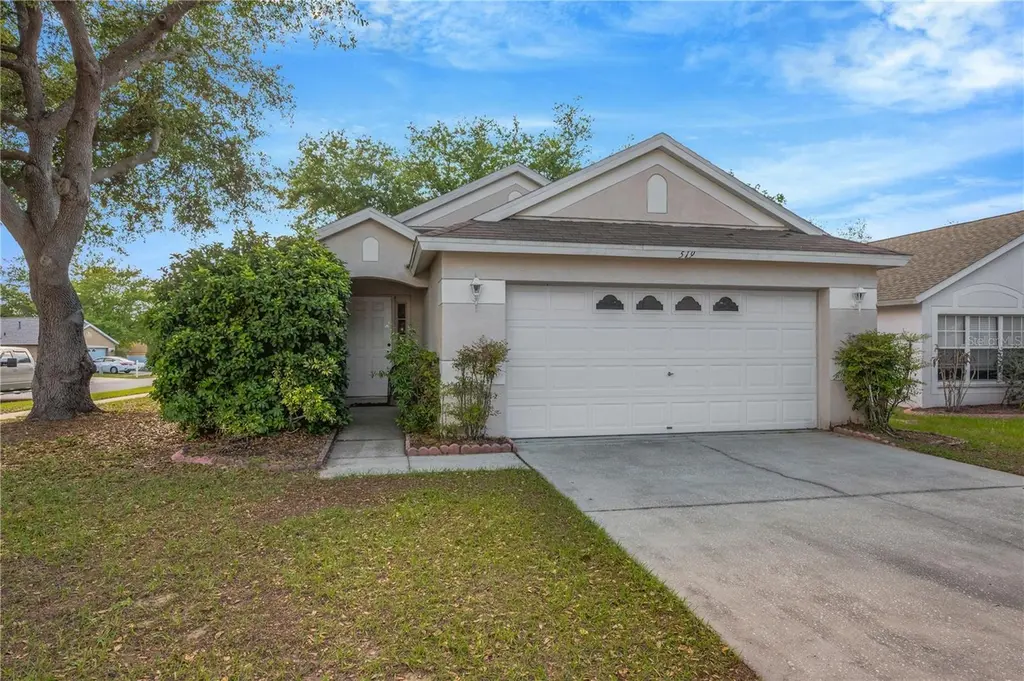
519 Summer Sails Dr · Valrico, FL
Flood risk 1/10 · Minimal
- FEMA flood zone
- X (unshaded)
- Chance of flooding over 30 yrs
- 0.0%
- Est. flood insurance / yr
- $507 – $1,088
Fire risk 4/10 · Minor
- Est. fire insurance / yr
- $947 – $1,759
Heat risk 10/10 · Severe
- Hot days now (above 110°F)
- 7 days/yr
- Hot days in 30 yrs
- 27 days/yr
Wind risk 9/10 · Severe
- Chance of severe wind over 30 yrs
- 99.0%
Air-quality risk 3/10 · Minor
- Unhealthy air days now
- 3 days/yr
- Unhealthy air days in 30 yrs
- 4 days/yr
Risk factors via First Street. Map © Google.
Why this score? — see what drove the C grade
The composite is a weighted blend of 9 inputs, each scored 0–100. Each bar is that input's sub-score; the figure is the points it added to the 100-point composite (weight × sub-score).
- Cash flow +23.8/30.0
- DSCR +7.7/10.0
- ARV discount +7.5/15.0
- 1% rule +5.7/10.0
- Schools +4.2/10.0
- Livability +3.5/5.0
- Rent growth +3.0/5.0
- Condition / age +2.5/5.0
- Appreciation +0.0/10.0
$199,000
🖨 Deal sheet 📄 Offer letter ✓ Due diligence
Listing remarks
CASH ONLY! REHABILITATION REQUIRED. AN INCREDIBLE OPPORTUNITY TO PURCHASE YOUR HOME AT A PRICE BELOW MARKET VALUE! THIS PROPERTY INCLUDES 3 BEDROOMS, 2 BATHROOMS, AND A 2-CAR GARAGE LOCATED ON A CORNER LOT IN THE SOMERSET COMMUNITY OF VALRICO. IT IS WITHIN CLOSE PROXIMITY TO RESTAURANTS, ENTERTAINMENT, AND SHOPPING. COMMUNITY AMENITIES FEATURE A COMMUNITY POOL AND PARK.
Key facts
- Community pool
- Somerset community
- Corner lot
Tags
Neighborhood map
What this means for you Summary
Snapshot
- This is a 3-bed/2.0-bath single-family listed at $199k.
Deal economics
- At list price, monthly cash flow is $383 ($5k/yr) — positive.
- The deal already cash-flows at list — no discount required.
- Meets the 1% rule at list price ($2k rent vs $199k).
Location & tenants
- Location reads 70/100 on livability (#442 in FL) — a middle-class / working-renter tenant base. Strengths: housing A+, crime A, employment A; Watch: amenities F, commute F, health & safety F.
- Hillsborough (suburban): math 47% / reading 50% proficiency, ranked #41 of 73 in FL (top 56%) — families likely to look elsewhere, expect single-tenant / working-renter base with shorter leases.
- Market conditions: Rents rising (+2.2%/yr); 211 active listings in the ZIP; 27 comparable units currently listed for rent nearby; rentals at typical pace (median 18d on market — plan ~3-4 weeks tenant-placement turnaround); solid renter incomes; 9,053 units permitted in Hillsborough County in 2024 (4,555 in 5+ unit buildings).
Forward outlook
- Local home prices are declining (-3.0%/yr); year-one equity from $1k of loan paydown is wiped out by about $6k of value loss. Plan a longer hold.
- Hillsborough County population projected at +37% by 2050 — long-run rental-demand tailwind backs the buy-and-hold thesis.
Negotiation context
- Only 3 days on market — expect competitive offers; lowballing is unlikely to land.
- Current owner paid $116k; list at $199k implies a 72% gain — meaningful room to come down on a strong offer.
Risks & watch-outs
- Climate carrying-cost: severe wind risk, 99% chance of damaging wind over 30y; extreme-heat days projected 7→27/yr by 2055 (HVAC capex compounding) — expect insurance premiums to compound above CPI over the hold.
Questions for the listing agent
- What does the HOA fee cover, when was the last increase, and are there any pending special assessments or reserve-fund shortfalls?
- Is there a deadline driving the sale (1031 exchange, divorce, estate, relocation)? That informs how much negotiation room exists.
- Schools are B-rated — typically a magnet for longer-tenancy family renters. What's the average tenant stay here, and is there a school-zone premium baked into asking?
- What's the average days-on-market for RENTAL listings here right now (not sales)? A rising rental-DOM trend means longer vacancies and softer asking-rent achievability than the comps imply.
- What's the recent tenant-quality profile in this submarket — average credit score on applications, eviction rate, late-payment / NSF rate, and stable-employment percentage? A property-management company in the area should have these aggregated.
- How much new for-sale + rental construction is in the pipeline within 1–3 miles? Heavy new supply typically softens prices + rents 12–24 months out; constrained supply supports both.
Investment metrics
- 1% rule
- 1.07% ✓
- Cap rate
- 8.60%
- Cash-on-cash
- 8.25%
- DSCR
- 1.37
- GRM
- 7.8
CMA / ARV
No comps found within radius.
Projected returns pro-forma
-3.0% appreciation · 2.19% rent growth · sell at horizon
- IRR
- -4.6%
- Equity multiple
- 0.83×
- Total profit
- $-9,583
- Equity at exit
- $29,672
- IRR
- 4.1%
- Equity multiple
- 1.29×
- Total profit
- $16,057
- Equity at exit
- $17,206
Cash invested: $55,720 (down + closing). Projections, not guarantees.
Landlord ↔ Tenant lean methodology
- Overall (STATE)
- 87 Strongly Landlord-Friendly
- State Florida
- 87 Strongly Landlord-Friendly · R+3
- County
- — inherits STATE
- City
- — inherits STATE
ZIP-level market 33594
- Rents YoY
- 2.2%
- Active inventory
- 211
- Price-to-rent
- 7.8×
Monthly cashflow live
- Estimated rent
- $2,137 high interval (Pro) →
- Mortgage (P&I)
- −$1,044
- Tax from tax record
- −$126 /mo · $1,509/yr
- Insurance
- −$83
- HOA
- −$53
- Vacancy / Maint / Mgmt
- −$449
- Net cashflow
- $383
Break-even live
UW: 25.0% down · 7.5% · 30yr · 1.5% tax · 5.0% vac · 8.0% maint · 8.0% mgmt
Financing live
Cash to close
- Down payment
- $49,750
- Closing costs
- $5,970
- Reserves months
- —
- Total cash needed
- —
Loan-product check · same deal, 3 products live
Conventional
25% down · 7.5% · 30yr
- Down + closing
- —
- Monthly P&I
- —
- Monthly cashflow
- —
- DSCR
- —
- Eligible?
- —
Personal DTI + credit; lowest rate.
DSCR
20% down · 8.5% · 30yr
- Down + closing
- —
- Monthly P&I
- —
- Monthly cashflow
- —
- DSCR
- —
- Eligible?
- —
No personal income docs; deal must DSCR.
Hard money
10% down · 12.0% · 12mo
- Down + closing
- —
- Monthly P&I
- —
- Monthly cashflow
- —
- DSCR
- —
- Eligible?
- —
Short-term bridge; refi at stabilization.
Rent comps 27 comps
| Address | Beds | Baths | Sqft | Rent | $/sqft | DOM | Units | Dist |
|---|---|---|---|---|---|---|---|---|
| 545 Summer Sails Dr Valrico, FL | 3.0 | 2.0 | 1334 | $1,995 | $1.50 | 24d | 1 | 0.07mi |
| 3338 Spy Tower Ct Valrico, FL | 3.0 | 2.5 | 1408 | $1,823 | $1.29 | 24d | 1 | 0.16mi |
| 3324 Spy Tower Ct Valrico, FL | 3.0 | 2.5 | 1408 | $1,795 | $1.27 | 16d | 1 | 0.17mi |
| 3419 Dragon View Ct Valrico, FL | 2.0 | 2.5 | 1560 | $1,775 | $1.14 | 24d | 1 | 0.18mi |
| 3425 Dragon View Ct Valrico, FL | 3.0 | 2.5 | 1408 | $1,750 | $1.24 | 24d | 1 | 0.18mi |
| 228 Draw Bridge Ln Valrico, FL | 3.0 | 2.5 | 1408 | $1,871 | $1.33 | 5d | 1 | 0.23mi |
| 727 Somerstone Dr Valrico, FL | 3.0 | 2.0 | 1436 | $2,300 | $1.60 | 24d | 1 | 0.43mi |
| 3126 Pine Top Dr Valrico, FL | 4.0 | 2.0 | 1464 | $1,850 | $1.26 | 24d | 1 | 0.48mi |
| 3126 Pine Top Dr Valrico, FL | 4.0 | 2.0 | 1464 | $1,850 | $1.26 | 5d | 1 | 0.48mi |
| 207 English Channel Pl Dover, FL | 3.0 | 2.0 | 1555 | $2,079 | $1.34 | 5d | 1 | 0.62mi |
| 109 Woodknoll Pl Valrico, FL | 2.0 | 1.5 | 1315 | $2,000 | $1.52 | 18d | 1 | 0.63mi |
| 3510 Petticoat Jct Valrico, FL | 2.0 | 2.0 | 1595 | $1,650 | $1.03 | 24d | 1 | 0.66mi |
| 914 Cape Cod Cir Valrico, FL | 4.0 | 2.0 | 1438 | $2,139 | $1.49 | 22d | 1 | 0.68mi |
| 209 Woodknoll Pl Valrico, FL | 4.0 | 2.5 | 1734 | $2,200 | $1.27 | 24d | 1 | 0.70mi |
| 3406 Palm Beach Dr Valrico, FL | 3.0 | 2.0 | 1272 | $1,910 | $1.50 | 5d | 1 | 0.75mi |
| 840 Rocky Mountain Ct Valrico, FL | 3.0 | 2.0 | 1847 | $2,370 | $1.28 | 2d | 1 | 0.97mi |
| 919 Grand Canyon Dr Valrico, FL | 3.0 | 2.0 | 1700 | $2,300 | $1.35 | 5d | 1 | 1.17mi |
| 918 Grand Canyon Dr Valrico, FL | 3.0 | 2.0 | 1330 | $2,200 | $1.65 | 24d | 1 | 1.18mi |
| 2427 Camden Oaks Pl Valrico, FL | 4.0 | 2.0 | 1734 | $3,250 | $1.87 | 3d | 1 | 1.22mi |
| 4408 Horseshoe Pick Ln Valrico, FL | 3.0 | 2.0 | 1374 | $2,240 | $1.63 | 12d | 1 | 1.24mi |
| 1263 Piney Branch Cir Valrico, FL | 3.0 | 2.0 | 1314 | $1,800 | $1.37 | 14d | 1 | 1.33mi |
| 420 Silver Hill Dr Valrico, FL | 3.0 | 2.0 | 1283 | $2,010 | $1.57 | 18d | 1 | 1.42mi |
| 1102 Lumsden Trace Cir Valrico, FL | 3.0 | 2.0 | 1822 | $2,306 | $1.27 | 24d | 1 | 1.45mi |
| 1209 Hawley Ct Valrico, FL | 3.0 | 2.0 | 1420 | $2,340 | $1.65 | 24d | 1 | 1.45mi |
| 4617 Newbourne Way Valrico, FL | 3.0 | 2.0 | 1516 | $2,100 | $1.39 | 5d | 1 | 1.47mi |
| 1123 Emerald Hill Way Unit A1 Valrico, FL | 2.0 | 2.0 | 1566 | $2,160 | $1.38 | 24d | 1 | 1.49mi |
| 4906 Copper Canyon Blvd Valrico, FL | 3.0 | 2.0 | 1433 | $2,105 | $1.47 | 18d | 1 | 1.50mi |
HOA detail
- Monthly dues
- $53 · $636/yr
- Likely covers
- pool
Listing history 3 events
-
2026-04-14status Pending
-
2026-04-10$199,000 Active
-
2003-05-12soldstatus $116,000
ⓘ Source: listings_history table (triggers on properties + properties_extension) + one-shot
backfill from property_details.listing_events for pre-trigger history.
Tax reassessment forecast FL · Resets to sale price
- Current annual tax
- $1,509 · $126/mo
- Projected year-2 tax
- $1,652 · $138/mo
- Expected delta
- +$142/yr (+$12/mo · 9.4%)
ⓘ Screening estimate from a state-policy table — verify with the county assessor before closing.
Climate risk First Street
- Flood 1/10 Low FEMA zone X (unshaded) · 0% chance over 30 yrs
- Wildfire 4/10 Moderate
- Heat 10/10 Extreme 7 d/yr ≥110°F today · 27 d/yr by 30 yrs out
- Wind 9/10 Extreme 99% chance of damaging wind over 30 yrs
- Air quality 3/10 Moderate 3 unhealthy d/yr today · 4 by 30 yrs out
Nearby sold comps map
Loading sold comps map…
Walkable amenities ~0.75 mi
Loading nearby amenities…
Taxation est. · year 1
- Rental income
- $25,647
- − Mortgage interest
- −$11,147
- − Property taxes
- −$1,509
- − Insurance
- −$995
- − Repairs & maintenance
- −$2,052
- − Management
- −$2,052
- − HOA
- −$636
- − Depreciation
- −$5,789
- Taxable income
- $1,467
- Est. tax owed @ 24.0%
- −$352
- After-tax cash flow
- $4,246/yr
For passive investors: Depreciation is non-cash, so a rental often shows a tax loss while cash-flowing — sheltering income. Rental losses are passive: they offset passive income freely, and up to $25,000/yr can offset ordinary (W-2) income if you actively participate and your MAGI is under $100k (phasing out to $0 by $150k); unused losses carry forward. On sale, claimed depreciation is recaptured at up to 25%, and gains may owe capital-gains tax (a 1031 exchange can defer both). Figures are a year-1 estimate at your 24.0% rate — not tax advice; consult a CPA.
Schools (NCES district)
- District
- Hillsborough
- NCES district ID
- 1200870
- Math proficiency
- 47% ▼ -8.00%
- Reading proficiency
- 50% ▼ -4.00%
- Median HH income
- $50,622
- Composite
- 41.6/100
- National rank
- #3435
- State rank
- #41 of 73 in FL
Livability — Valrico
- Score
- 70/100
- State rank
- #442
- US rank
- #7901
Category grades
Schools grade is shown separately in the Schools card above.
Census & demographics
- Census place
- Valrico, FL
- County
- Hillsborough County · 1,540,968 people
- City population
- 65,118
- Metro
- Tampa-St. Petersburg-Clearwater, FL
- Population (ZIP)
- 37,361
- Household income
- $96,628
- Rent vs Own
- Severe rent burden
- 568.0
Population outlook (Hillsborough County) Hauer SSP2
- Today (2025)
- 1,607,022 people
- By 2030
- 1,733,968 · +7.9%
- By 2040
- 1,979,565 · +23.2%
- By 2050
- 2,203,427 · +37.1%
- By 2075
- 2,667,893 · +66.0%
- By 2100
- 2,891,558 · +79.9%
Race, ethnicity, and origin ACS 2023
- Neighborhood character
- Diverse neighborhood (Simpson 0.65)
- Race & ethnicity
- White 52% Hispanic / Latino 25% Two or more races 17% Black 15% Asian 4%
- Hispanic origin (detail)
- Mexican 4% Puerto Rican 8% Cuban 3% Dominican 2%
- Common ancestry
- Romanian 2% Hispanic 2% Lithuanian 2%
- Foreign-born
- 17% · Canada, Jamaica, Dominican Republic
- Languages at home
- 72% English-only · Spanish 19% Other Indo-European 2% Other Asian/Pacific 2%
Political lean MEDSL · Hillsborough
- 2024 margin
- Toss-up / Even · D 47.8% · R 50.9% · Other 1.3%
- 2008→2024 swing
- -10.2pp toward R · 2008: 7.1pp · 2024: -3.1pp
- All cycles
- 2024: R+3.1 2020: D+6.9 2016: D+6.8 2012: D+6.7 2008: D+7.1
Not yet ingested
- Civics
- —
Market trends
- HPI YoY
- ▼ -226.31%
- Current HPI
- 317.0404
- Rent YoY
- ▲ 2.19%
- Metro
- Tampa-St. Petersburg-Clearwater, FL
- State GDP YoY
- ▲ 3.28%
- F500 in state
- 36
Industry mix (Fortune 500 HQ in FL)
| Industry | F500 HQs | Revenue |
|---|---|---|
| Industrial Technology | 2 | $29B |
|
||
| Insurance | 2 | $17B |
|
||
| Retail | 1 | $60B |
|
||
| Technology Distribution | 1 | $58B |
|
||
| Homebuilding | 1 | $35B |
|
||
| Technology Manufacturing | 1 | $35B |
|
||
Price history
+71.6% since first listed3 events — show timeline
- 2026-04-14 Pending — Stellar MLS as Distributed by MLS Grid
- 2026-04-10 Listed $199,000 Stellar MLS as Distributed by MLS Grid
- 2003-05-12 Sold (Public Records) $116,000 Public Records
Property tax history
+1.3%/yrLatest (2025): $1,509 · +7.1% YoY. Source: county tax records.
Cash-flow waterfall
monthlySold comps — $/sqft
last 12 mo · ≤1 miLoading sold comps…