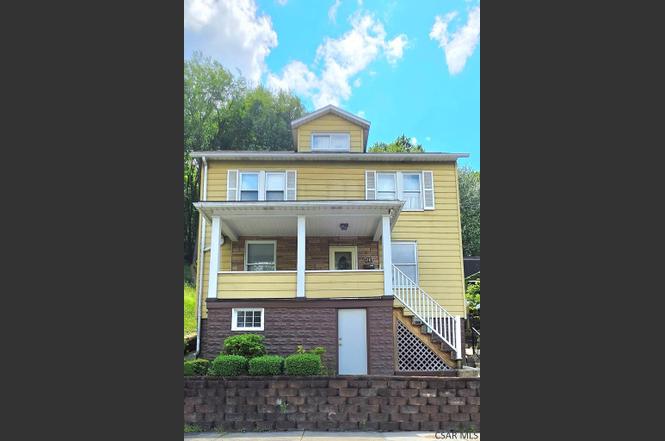
1287 Maryland Ave · Johnstown, PA
Flood risk 1/10 · Minimal
- FEMA flood zone
- X (unshaded)
- Chance of flooding over 30 yrs
- 0.0%
- Est. flood insurance / yr
- $473 – $860
Fire risk 1/10 · Minimal
- Est. fire insurance / yr
- $511 – $949
Heat risk 3/10 · Minor
- Hot days now (above 96°F)
- 7 days/yr
- Hot days in 30 yrs
- 18 days/yr
Wind risk 2/10 · Minimal
- Chance of severe wind over 30 yrs
- —
Air-quality risk 2/10 · Minimal
- Unhealthy air days now
- 1 days/yr
- Unhealthy air days in 30 yrs
- 2 days/yr
Risk factors via First Street. Map © Google.
Why this score? — see what drove the C+ grade
The composite is a weighted blend of 9 inputs, each scored 0–100. Each bar is that input's sub-score; the figure is the points it added to the 100-point composite (weight × sub-score).
- Cash flow +30.0/30.0
- 1% rule +10.0/10.0
- DSCR +10.0/10.0
- Livability +3.9/5.0
- Appreciation +3.4/10.0
- Rent growth +2.5/5.0
- Condition / age +2.5/5.0
- Schools +1.3/10.0
- ARV discount +0.0/15.0
$52,500
🖨 Deal sheet 📄 Offer letter ✓ Due diligence
Listing remarks
Move right into this charming 2-bedroom home in Lower Yoder, ideally situated on a quiet no-outlet street with a wooded setting. Lovingly maintained over the years, this home offers a comfortable living room with carpeting and an open staircase, a separate dining room, and a spacious kitchen with all appliances included. Just off the larger bedroom is an 8x10 bonus room, perfect for a home office, nursery, or walk-in closet. Relax and enjoy the beautiful views from the covered front porch. Featuring a newer boiler and low taxes, this well-cared-for home is ready for its next owner. Call today for your personal tour!
Key facts
- Covered front porch
- Separate dining room
- 8x10 bonus room
Tags
Property features AI
Exterior
- Parking: On-street parking
- Utilities: Public water; Public sewer / sewer available
- Home design: Two-level single family home; Residential property
- Construction: Aluminum siding; Shingle roof
- Exterior features: Covered patio and porch; Rectangular lot
Interior
- Kitchen: Range, oven and refrigerator
- Bathrooms: 1 full bathroom; 1 half bathroom
- Heating & cooling: Hot water heating; Natural gas heating
- Interior features: Includes dryer, range, oven, refrigerator and washer; Full basement
- Laundry & utility: Laundry located in basement; Washer and dryer included
Neighborhood map
What this means for you Summary
Snapshot
- This is a 2-bed/1.5-bath single-family listed at $52k.
Deal economics
- At list price, monthly cash flow is $319 ($4k/yr) — positive.
- The deal already cash-flows at list — no discount required.
- Meets the 1% rule at list price ($848 rent vs $52k).
Location & tenants
- Location reads 77/100 on livability (#363 in PA, #3,168 nationally) — a middle-class / working-renter tenant base. Strengths: amenities A+, commute A+, cost of living A+; Watch: schools D+, crime F, employment F.
- Greater Johnstown SD (urban): math 9% / reading 25% proficiency, ranked #509 of 539 in PA (top 94%) — low school quality limits family demand, transient renter base, plan for 1-2y turnover; 80% free/reduced lunch — lower-income household profile, screen leases tightly.
- Market conditions: 47 active listings in the ZIP; 5 comparable units currently listed for rent nearby; rentals at typical pace (median 24d on market — plan ~3-4 weeks tenant-placement turnaround); 64 units permitted in Cambria County in 2024 (0 in 5+ unit buildings).
Forward outlook
- Local home prices are declining (-3.0%/yr); year-one equity from $363 of loan paydown is wiped out by about $2k of value loss. Plan a longer hold.
- Cambria County population projected at -28% by 2050 — secular population decline; favor cash flow + early exit over multi-decade hold.
- At projected returns (-3.0% appreciation + 3.0% rent growth), your $15k cash investment doubles in ~5 years — after that, you're playing with house money.
Negotiation context
- Only 4 days on market — expect competitive offers; lowballing is unlikely to land.
Questions for the listing agent
- Is there a deadline driving the sale (1031 exchange, divorce, estate, relocation)? That informs how much negotiation room exists.
- Schools are D-rated, which usually means shorter tenancies and higher turnover. Who's the typical renter profile here, and what's been the actual vacancy rate?
- Crime grade is F in this area — have there been break-ins, vandalism, or insurance claims at this property in the last 3 years? What carrier currently insures it and at what premium?
- What's the average days-on-market for RENTAL listings here right now (not sales)? A rising rental-DOM trend means longer vacancies and softer asking-rent achievability than the comps imply.
- What's the recent tenant-quality profile in this submarket — average credit score on applications, eviction rate, late-payment / NSF rate, and stable-employment percentage? A property-management company in the area should have these aggregated.
- How much new for-sale + rental construction is in the pipeline within 1–3 miles? Heavy new supply typically softens prices + rents 12–24 months out; constrained supply supports both.
Investment metrics
- 1% rule
- 1.62% ✓
- Cap rate
- 13.58%
- Cash-on-cash
- 26.01%
- DSCR
- 2.16
- GRM
- 5.2
CMA / ARV
- ARV (on-the-fly)
- $37,376
- Comps found
- 12
Show comp detail 12 sales within ~0.75 mi
| Address | Dist | Beds/Ba | Sqft | Sold | Price | $/sf | Match |
|---|---|---|---|---|---|---|---|
| 48 D St | 0.25mi | 2/1.0 | 1,127 (-4%) | 12mo | $42,500 | $38 | 70 |
| 151 R Stackhouse St | 0.15mi | 2/1.0 | 1,024 (-12%) | 2mo | $39,000 | $38 | 68 |
| 612 Virginia Ave | 0.40mi | 2/1.0 | 1,162 (-0%) | 18mo | $26,500 | $23 | 64 |
| 217 Olds Ave | 0.44mi | 3/2.0 (+1) | 1,148 (-2%) | 8mo | $50,000 | $44 | 63 |
| 153 D St | 0.41mi | 3/2.0 (+1) | 1,250 (+7%) | 15mo | $20,000 | $16 | 50 |
| 86 K St | 0.63mi | 2/1.5 | 1,220 (+4%) | 18mo | $24,900 | $20 | 48 |
| 77 Boyer St | 0.69mi | 3/2.0 (+1) | 1,236 (+6%) | 6mo | $39,500 | $32 | 46 |
| 354 Kennard St | 0.72mi | 2/1.0 | 1,086 (-7%) | 8mo | $35,000 | $32 | 46 |
| 222 Strayer St | 0.73mi | 3/1.0 (+1) | 1,160 (-1%) | 15mo | $34,900 | $30 | 46 |
| 120 D St | 0.34mi | 3/1.0 (+1) | 1,008 (-14%) | 15mo | $27,000 | $27 | 42 |
| 214 Gable St | 0.68mi | 3/1.5 (+1) | 1,280 (+10%) | 11mo | $62,000 | $48 | 38 |
| 192 Beatty Ave | 0.56mi | 2/1.0 | 1,000 (-14%) | 13mo | $33,500 | $34 | 37 |
Match score weights: distance 35% · size 25% · config 20% · recency 20%. Top-matched comps best support the ARV.
Projected returns pro-forma
-3.0% appreciation · 3.0% rent growth · sell at horizon
- IRR
- 19.7%
- Equity multiple
- 1.80×
- Total profit
- $11,793
- Equity at exit
- $7,828
- IRR
- 28.0%
- Equity multiple
- 3.48×
- Total profit
- $36,425
- Equity at exit
- $4,539
Cash invested: $14,700 (down + closing). Projections, not guarantees.
Landlord ↔ Tenant lean methodology
- Overall (STATE)
- 62 Landlord-Friendly
- State Pennsylvania
- 62 Landlord-Friendly · EVEN
- County
- — inherits STATE
- City
- — inherits STATE
ZIP-level market 15906
- Home prices YoY
- -4.0%
- Active inventory
- 47
- Price-to-rent
- 5.2×
Monthly cashflow live
- Estimated rent
- $848 high interval (Pro) →
- Mortgage (P&I)
- −$275
- Tax from tax record
- −$54 /mo · $652/yr
- Insurance
- −$22
- HOA
- −$0
- Vacancy / Maint / Mgmt
- −$178
- Net cashflow
- $319
Break-even live
UW: 25.0% down · 7.5% · 30yr · 1.5% tax · 5.0% vac · 8.0% maint · 8.0% mgmt
Financing live
Cash to close
- Down payment
- $13,125
- Closing costs
- $1,575
- Reserves months
- —
- Total cash needed
- —
Loan-product check · same deal, 3 products live
Conventional
25% down · 7.5% · 30yr
- Down + closing
- —
- Monthly P&I
- —
- Monthly cashflow
- —
- DSCR
- —
- Eligible?
- —
Personal DTI + credit; lowest rate.
DSCR
20% down · 8.5% · 30yr
- Down + closing
- —
- Monthly P&I
- —
- Monthly cashflow
- —
- DSCR
- —
- Eligible?
- —
No personal income docs; deal must DSCR.
Hard money
10% down · 12.0% · 12mo
- Down + closing
- —
- Monthly P&I
- —
- Monthly cashflow
- —
- DSCR
- —
- Eligible?
- —
Short-term bridge; refi at stabilization.
Rent comps 5 comps
| Address | Beds | Baths | Sqft | Rent | $/sqft | DOM | Units | Dist |
|---|---|---|---|---|---|---|---|---|
| 207 Burkhard St Johnstown, PA | 2.0 | 1.0 | 856 | $825 | $0.96 | 23d | 1 | 0.40mi |
| 213 Stone St Johnstown, PA | 2.0 | 1.0 | 989 | $1,100 | $1.11 | 23d | 1 | 0.86mi |
| 444 Stone St Unit 444 Johnstown, PA | 2.0 | 1.0 | 950 | $700 | $0.74 | 23d | 1 | 0.91mi |
| 444 Stone St Johnstown, PA | 2.0 | 1.0 | 908 | $700 | $0.77 | 43d | 1 | 0.93mi |
| 459 Stone St Johnstown, PA | 3.0 | 1.0 | 1120 | $900 | $0.80 | 23d | 1 | 0.94mi |
Listing history 5 events
-
2026-06-19days on market $52,500 Active 4 DOM
-
2026-06-18days on market $52,500 Active 3 DOM
-
2026-06-17days on market $52,500 Active 2 DOM
-
2026-06-16remarks 623-char remark
-
2026-06-16$52,500 Active 1 DOM
ⓘ Source: listings_history table (triggers on properties + properties_extension) + one-shot
backfill from property_details.listing_events for pre-trigger history.
Tax reassessment forecast PA · Partial reset (capped growth)
- Current annual tax
- $652 · $54/mo
- Projected year-2 tax
- $741 · $62/mo
- Expected delta
- +$89/yr (+$7/mo · 13.6%)
ⓘ Screening estimate from a state-policy table — verify with the county assessor before closing.
Climate risk First Street
- Flood 1/10 Low FEMA zone X (unshaded) · 0% chance over 30 yrs
- Wildfire 1/10 Low
- Heat 3/10 Moderate 7 d/yr ≥96°F today · 18 d/yr by 30 yrs out
- Wind 2/10 Low
- Air quality 2/10 Low 1 unhealthy d/yr today · 2 by 30 yrs out
Nearby sold comps map
Loading sold comps map…
Walkable amenities ~0.75 mi
Loading nearby amenities…
Taxation est. · year 1
- Rental income
- $10,180
- − Mortgage interest
- −$2,941
- − Property taxes
- −$652
- − Insurance
- −$262
- − Repairs & maintenance
- −$814
- − Management
- −$814
- − Depreciation
- −$1,527
- Taxable income
- $3,168
- Est. tax owed @ 24.0%
- −$760
- After-tax cash flow
- $3,063/yr
For passive investors: Depreciation is non-cash, so a rental often shows a tax loss while cash-flowing — sheltering income. Rental losses are passive: they offset passive income freely, and up to $25,000/yr can offset ordinary (W-2) income if you actively participate and your MAGI is under $100k (phasing out to $0 by $150k); unused losses carry forward. On sale, claimed depreciation is recaptured at up to 25%, and gains may owe capital-gains tax (a 1031 exchange can defer both). Figures are a year-1 estimate at your 24.0% rate — not tax advice; consult a CPA.
Schools (NCES district)
- District
- Greater Johnstown SD
- NCES district ID
- 4210950
- Math proficiency
- 9% ▼ -6.00%
- Reading proficiency
- 25% ▼ -6.00%
- Median HH income
- $27,890
- Composite
- 13.25/100
- National rank
- #9550
- State rank
- #509 of 539 in PA
Livability — Johnstown
- Score
- 77/100
- State rank
- #363
- US rank
- #3168
Category grades
Schools grade is shown separately in the Schools card above.
Census & demographics
- Population (ZIP)
- 9,654
Population outlook (Cambria County) Hauer SSP2
- Today (2025)
- 122,754 people
- By 2030
- 115,827 · -5.6%
- By 2040
- 101,309 · -17.5%
- By 2050
- 88,379 · -28.0%
- By 2075
- 65,237 · -46.9%
- By 2100
- 46,909 · -61.8%
Race, ethnicity, and origin ACS 2023
- Neighborhood character
- Predominantly White (79%)
- Race & ethnicity
- White 79% Black 11% Two or more races 7% Hispanic / Latino 3%
- Common ancestry
- Romanian 8% Polish 2% Slovak 2%
- Foreign-born
- 1% · Canada
- Languages at home
- 98% English-only · Spanish 1%
Political lean MEDSL · Cambria
- 2024 margin
- Solid R (+39.7) · D 29.8% · R 69.5%
- 2008→2024 swing
- -40.4pp toward R · 2008: 0.7pp · 2024: -39.7pp
- All cycles
- 2024: R+39.7 2020: R+37.3 2016: R+37.8 2012: R+17.8 2008: D+0.7
Not yet ingested
- Civics
- —
Market trends
- HPI YoY
- ▼ -3.26%
- Current HPI
- 77.6797
- Rent YoY
- —
- Metro
- —
- State GDP YoY
- ▲ 1.68%
- F500 in state
- 34
Industry mix (Fortune 500 HQ in PA)
| Industry | F500 HQs | Revenue |
|---|---|---|
| Healthcare | 2 | $309B |
|
||
| Insurance | 2 | $27B |
|
||
| Telecommunications / Media | 1 | $124B |
|
||
| Industrial Distribution | 1 | $22B |
|
||
| Financial Services | 1 | $20B |
|
||
| Chemicals / Materials | 1 | $18B |
|
||
Price history
1 event — show timeline
- 2026-06-15 Listed $52,500 CSMLS
Property tax history
+0.6%/yrLatest (2026): $652 · +0.0% YoY. Source: county tax records.
Cash-flow waterfall
monthlySold comps — $/sqft
last 12 mo · ≤1 miLoading sold comps…