 Triplex
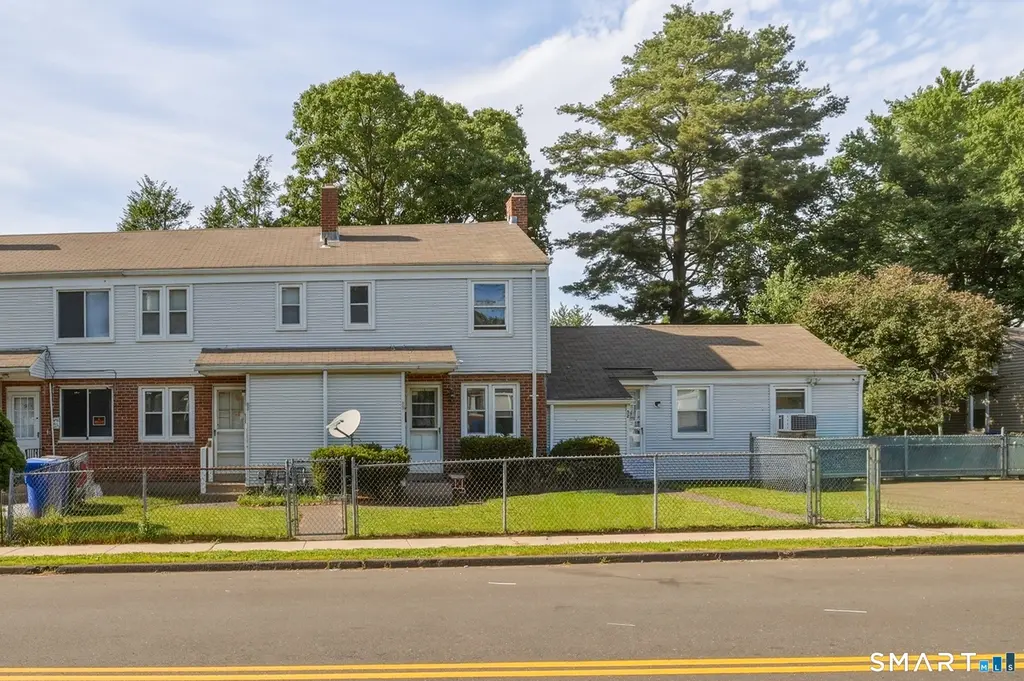
52-56 Great Hill Rd · East Hartford, CT
Flood risk 1/10 · Minimal
- FEMA flood zone
- X (unshaded)
- Chance of flooding over 30 yrs
- 0.0%
- Est. flood insurance / yr
- $507 – $1,088
Fire risk 1/10 · Minimal
- Est. fire insurance / yr
- $829 – $1,539
Heat risk 5/10 · Moderate
- Hot days now (above 97°F)
- 7 days/yr
- Hot days in 30 yrs
- 16 days/yr
Wind risk 6/10 · Moderate
- Chance of severe wind over 30 yrs
- 27.0%
Air-quality risk 3/10 · Minor
- Unhealthy air days now
- 3 days/yr
- Unhealthy air days in 30 yrs
- 4 days/yr
Risk factors via First Street. Map © Google.
Why this score? — see what drove the C grade
The composite is a weighted blend of 9 inputs, each scored 0–100. Each bar is that input's sub-score; the figure is the points it added to the 100-point composite (weight × sub-score).
- Cash flow +24.8/30.0
- ARV discount +8.9/15.0
- DSCR +8.0/10.0
- 1% rule +6.6/10.0
- Livability +3.7/5.0
- Rent growth +2.5/5.0
- Condition / age +2.5/5.0
- Schools +2.1/10.0
- Appreciation +0.0/10.0
$400,000
🖨 Deal sheet 📄 Offer letter ✓ Due diligence
Multi-family units
County records classify this as Multi-Family (2-4 Unit). Listing-text estimate: 3 units. confirmed
Listing remarks
Investment opportunity awaits at 52-56 Great Hill Road in East Hartford's established Mayberry Village neighborhood. This well-maintained multi-family property offers approximately 2,400 square feet of living space with 6 bedrooms and 3 full bathrooms across the three units, making it an excellent option for owner-occupants seeking rental income or investors looking to expand their portfolio. Situated on a level fenced lot, the property provides strong income-producing potential and functional layouts designed for comfortable living. Conveniently located just minutes from Burnside Avenue's shopping, dining, and everyday amenities, residents enjoy easy access to major commuter routes includi
Key facts
- Level fenced lot
- Functional layouts
- 9,147 sq ft lot
Tags
Property features AI
Finance
- Other: Property listed as Multi-Family For Sale
- Financial info: Financial specifics not provided
- HOA & community: HOA/community details not provided
Exterior
- Parking: Driveway parking; 3 total parking spaces
- Security: Security details not provided
- Utilities: Public water connected; Public sewer connected
- Home design: Multi-family property (3-family)
- Construction: Frame construction; Vinyl siding and brick exterior; Asphalt shingle roof; Slab foundation; White and brick exterior color
- Exterior features: Level lot; Private driveway
Interior
- Kitchen: Appliances and specific kitchen details not provided
- Bedrooms: 6 bedrooms (total across units)
- Flooring: Flooring details not provided
- Bathrooms: 3 full bathrooms (total)
- Heating & cooling: Hot air heat; Natural gas heat fuel; 40-gallon natural gas hot water tank
- Interior features: 12 total rooms; No basement
- Laundry & utility: Laundry hookups in all units; Laundry located behind kitchen in mechanical room
Neighborhood map
What this means for you Summary
Snapshot
- This is a 3 × 2-bed/1.0-bath units multifamily listed at $400k.
Deal economics
- At list price, monthly cash flow is $848 ($10k/yr) — positive. Per door: $283/mo.
- The deal already cash-flows at list — no discount required.
- Meets the 1% rule at list price ($5k rent vs $400k).
- Cap rate 8.8% vs local median 4.2% in East Hartford — top-decile yield for the area; either an underpriced asset or a hidden risk that comps aren't pricing in. Stress-test before assuming the spread holds.
Location & tenants
- Location reads 73/100 on livability (#76 in CT) — a middle-class / working-renter tenant base. Strengths: housing A+, crime A, commute A-; Watch: amenities F, health & safety F.
- East Hartford School District (urban): math 17% / reading 30% proficiency, ranked #140 of 153 in CT (top 92%) — low school quality limits family demand, transient renter base, plan for 1-2y turnover.
- Zoned schools: Dr. Franklin H. Mayberry School (math 12% / reading 17%, grade F, #475 of 553 statewide, top 87%, 333 students, 78% FRL); East Hartford High School (math 11% / reading 33%, grade F, #156 of 194 statewide, top 82%, 1,698 students, 63% FRL).
- Market conditions: 47 active listings in the ZIP; 1,867 units permitted in Capitol Planning Region in 2024 (1,399 in 5+ unit buildings).
- At $4,648/mo this rent would consume 98% of the median local household income ($57k/yr) (locally 1205% of renters already pay >50% of income on rent) — very limited rent-growth headroom before tenants either downsize or default.
Forward outlook
- Local home prices are declining (-3.0%/yr); year-one equity from $3k of loan paydown is wiped out by about $12k of value loss. Plan a longer hold.
Negotiation context
- Only 5 days on market — expect competitive offers; lowballing is unlikely to land.
- Current owner paid $175k; list at $400k implies a 129% gain — meaningful room to come down on a strong offer.
Risks & watch-outs
- Watch-outs: built in 1943 — expect roof / HVAC / electrical / plumbing capex.
- Climate carrying-cost: major wind risk, 27% chance of damaging wind over 30y; extreme-heat days projected 7→16/yr by 2055 (HVAC capex compounding) — expect insurance premiums to compound above CPI over the hold.
Questions for the listing agent
- Can we see the unit-by-unit rent roll, current vacancy, and any below-market leases? What's the average tenancy length?
- What capital expenditures (roof, boiler, parking lot, exteriors) have been made in the last 5 years, and what's planned in the next 2?
- Built in 1943 — when were the roof, HVAC, electrical panel, plumbing, and water heater last replaced?
- Is there a deadline driving the sale (1031 exchange, divorce, estate, relocation)? That informs how much negotiation room exists.
- Schools are D-rated, which usually means shorter tenancies and higher turnover. Who's the typical renter profile here, and what's been the actual vacancy rate?
- What's the average days-on-market for RENTAL listings here right now (not sales)? A rising rental-DOM trend means longer vacancies and softer asking-rent achievability than the comps imply.
- What's the recent tenant-quality profile in this submarket — average credit score on applications, eviction rate, late-payment / NSF rate, and stable-employment percentage? A property-management company in the area should have these aggregated.
- How much new apartment / multifamily construction is in the pipeline within 1–3 miles? Heavy new supply (>2% of stock underway) typically softens rents 12–24 months out; light construction supports rent growth.
Investment metrics
- 1% rule
- 1.16% ✓
- Cap rate
- 8.84%
- Cash-on-cash
- 9.08%
- DSCR
- 1.40
- GRM
- 7.2
CMA / ARV
- ARV (on-the-fly)
- $413,144
- Comps found
- 5
Show comp detail 5 sales within ~0.75 mi
| Address | Dist | Beds/Ba | Sqft | Sold | Price | $/sf | Match |
|---|---|---|---|---|---|---|---|
| 19 Outlook St | 0.15mi | 6/3.0 | 2,396 (-0%) | 11mo | $380,000 | $159 | 84 |
| 19-23 Hopewell St | 0.17mi | 6/3.0 | 2,429 (+1%) | 19mo | $417,000 | $172 | 74 |
| 13-17 Hopewell St | 0.17mi | 6/3.0 | 2,429 (+1%) | 19mo | $417,000 | $172 | 74 |
| 26 Casabella Cir | 0.48mi | 6/3.0 | 2,374 (-1%) | 7mo | $415,000 | $175 | 70 |
| 13-15 Burnside Ave | 0.71mi | 6/3.0 | 2,742 (+14%) | 7mo | $181,000 | $66 | 38 |
Match score weights: distance 35% · size 25% · config 20% · recency 20%. Top-matched comps best support the ARV.
Projected returns pro-forma
-3.0% appreciation · 3.0% rent growth · sell at horizon
- IRR
- -2.5%
- Equity multiple
- 0.90×
- Total profit
- $-10,715
- Equity at exit
- $59,641
- IRR
- 7.2%
- Equity multiple
- 1.54×
- Total profit
- $60,632
- Equity at exit
- $34,585
Cash invested: $112,000 (down + closing). Projections, not guarantees.
Landlord ↔ Tenant lean methodology
- Overall (STATE)
- 27 Tenant-Leaning
- State Connecticut
- 27 Tenant-Leaning · D+7
- County
- — inherits STATE
- City
- — inherits STATE
ZIP-level market 06108
- Home prices YoY
- -17.6%
- Active inventory
- 47
- Price-to-rent
- 21.5×
Monthly cashflow live
- Estimated rent
- $4,648 high interval (Pro) →
- Mortgage (P&I)
- −$2,098
- Tax from tax record
- −$560 /mo · $6,718/yr
- Insurance
- −$167
- HOA
- −$0
- Vacancy / Maint / Mgmt
- −$976
- Net cashflow
- $848
Break-even live
3-unit breakdown (identical units grouped — click to expand)
| Units | Beds | Baths | Est. rent |
|---|---|---|---|
| 3× units | 2 | 1 | $4,647 |
| #1 | 2 | 1 | $1,549 |
| #2 | 2 | 1 | $1,549 |
| #3 | 2 | 1 | $1,549 |
| Total (3 units) | $4,648 | ||
UW: 25.0% down · 7.5% · 30yr · 1.5% tax · 5.0% vac · 8.0% maint · 8.0% mgmt
Financing live
Cash to close
- Down payment
- $100,000
- Closing costs
- $12,000
- Reserves months
- —
- Total cash needed
- —
Loan-product check · same deal, 3 products live
Conventional
25% down · 7.5% · 30yr
- Down + closing
- —
- Monthly P&I
- —
- Monthly cashflow
- —
- DSCR
- —
- Eligible?
- —
Personal DTI + credit; lowest rate.
DSCR
20% down · 8.5% · 30yr
- Down + closing
- —
- Monthly P&I
- —
- Monthly cashflow
- —
- DSCR
- —
- Eligible?
- —
No personal income docs; deal must DSCR.
Hard money
10% down · 12.0% · 12mo
- Down + closing
- —
- Monthly P&I
- —
- Monthly cashflow
- —
- DSCR
- —
- Eligible?
- —
Short-term bridge; refi at stabilization.
Listing history 6 events
-
2026-06-17status $400,000 Under Contract 5 DOM
-
2026-06-17days on market $400,000 Active 5 DOM
-
2026-06-16days on market $400,000 Active 4 DOM
-
2026-06-15days on market $400,000 Active 3 DOM
-
2026-06-13remarks 699-char remark
-
2026-06-13$400,000 Active 1 DOM
ⓘ Source: listings_history table (triggers on properties + properties_extension) + one-shot
backfill from property_details.listing_events for pre-trigger history.
Tax reassessment forecast CT · Partial reset (capped growth)
- Current annual tax
- $6,718 · $560/mo
- Projected year-2 tax
- $7,639 · $637/mo
- Expected delta
- +$921/yr (+$77/mo · 13.7%)
ⓘ Screening estimate from a state-policy table — verify with the county assessor before closing.
Climate risk First Street
- Flood 1/10 Low FEMA zone X (unshaded) · 0% chance over 30 yrs
- Wildfire 1/10 Low
- Heat 5/10 Major 7 d/yr ≥97°F today · 16 d/yr by 30 yrs out
- Wind 6/10 Major 27% chance of damaging wind over 30 yrs
- Air quality 3/10 Moderate 3 unhealthy d/yr today · 4 by 30 yrs out
Nearby sold comps map
Loading sold comps map…
Walkable amenities ~0.75 mi
Loading nearby amenities…
Taxation est. · year 1
- Rental income
- $55,776
- − Mortgage interest
- −$22,406
- − Property taxes
- −$6,718
- − Insurance
- −$2,000
- − Repairs & maintenance
- −$4,462
- − Management
- −$4,462
- − Depreciation
- −$11,636
- Taxable income
- $4,091
- Est. tax owed @ 24.0%
- −$982
- After-tax cash flow
- $9,191/yr
For passive investors: Depreciation is non-cash, so a rental often shows a tax loss while cash-flowing — sheltering income. Rental losses are passive: they offset passive income freely, and up to $25,000/yr can offset ordinary (W-2) income if you actively participate and your MAGI is under $100k (phasing out to $0 by $150k); unused losses carry forward. On sale, claimed depreciation is recaptured at up to 25%, and gains may owe capital-gains tax (a 1031 exchange can defer both). Figures are a year-1 estimate at your 24.0% rate — not tax advice; consult a CPA.
Schools (NCES district)
- District
- East Hartford School District
- NCES district ID
- 0901260
- Math proficiency
- 17% ▼ -5.00%
- Reading proficiency
- 30% ▼ -7.00%
- Median HH income
- $49,691
- Composite
- 20.74/100
- National rank
- #8519
- State rank
- #140 of 153 in CT
Livability — East Hartford
- Score
- 73/100
- State rank
- #76
- US rank
- #5527
Category grades
Schools grade is shown separately in the Schools card above.
Census & demographics
- Census place
- East Hartford, CT
- County
- Hartford County · 754,208 people
- City population
- 50,918
- Metro
- Hartford-East Hartford-Middletown, CT
- Population (ZIP)
- 23,499
- Household income
- $56,663
- Rent vs Own
- Severe rent burden
- 1205.0
Population outlook (Capitol County) Hauer SSP2
- By 2040
- 1,063,519
Race, ethnicity, and origin ACS 2023
- Neighborhood character
- Diverse neighborhood (Simpson 0.68)
- Race & ethnicity
- Hispanic / Latino 44% Black 26% White 23% Two or more races 18% Asian 2%
- Hispanic origin (detail)
- Mexican 2% Puerto Rican 28% Dominican 2% Salvadoran 1%
- Common ancestry
- Romanian 4% Lithuanian 4% Estonian 2%
- Foreign-born
- 22% · Canada, Jamaica, Vietnam
- Languages at home
- 55% English-only · Spanish 35% Other Indo-European 3% French/Haitian/Cajun 2%
Political lean MEDSL · Capitol
- 2024 margin
- Strong D (+21.9) · D 60.1% · R 38.2% · Other 1.7%
- All cycles
- 2024: D+21.9
Not yet ingested
- Civics
- —
Market trends
- HPI YoY
- ▼ -65.15%
- Current HPI
- 306.0426
- Rent YoY
- —
- Metro
- Hartford-East Hartford-Middletown, CT
- State GDP YoY
- ▲ 1.06%
- F500 in state
- 38
Industry mix (Fortune 500 HQ in CT)
| Industry | F500 HQs | Revenue |
|---|---|---|
| Industrial Machinery | 4 | $38B |
|
||
| Insurance | 3 | $71B |
|
||
| Financial Services | 2 | $25B |
|
||
| Transportation / Logistics | 2 | $18B |
|
||
| Healthcare | 1 | $247B |
|
||
| Telecommunications | 1 | $55B |
|
||
Price history
+128.6% since first listed3 events — show timeline
- 2026-06-13 Listed $400,000 Smart MLS
- 2026-06-11 Coming Soon $400,000 Smart MLS
- 2013-01-10 Sold (Public Records) $175,000 Public Records
Property tax history
+3.4%/yrLatest (2025): $6,718 · +4.3% YoY. Source: county tax records.
Cash-flow waterfall
monthlySold comps — $/sqft
last 12 mo · ≤1 miLoading sold comps…