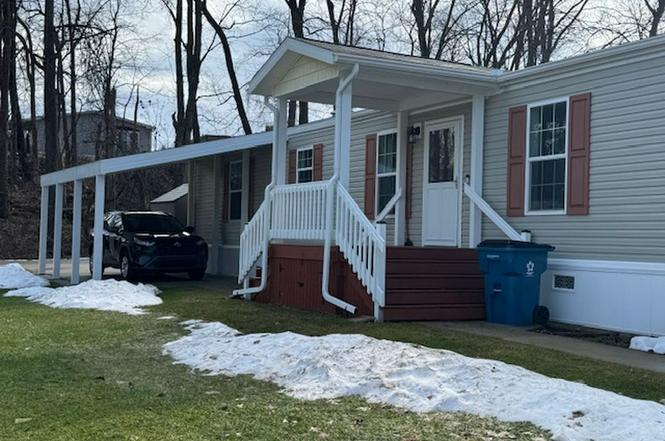
1403 Miss Ellie Dr · Oshtemo, MI
Flood risk No data
- FEMA flood zone
- —
- Chance of flooding over 30 yrs
- —
- Est. flood insurance / yr
- —
Fire risk No data
- Est. fire insurance / yr
- —
Heat risk No data
- Hot days now (above threshold)
- —
- Hot days in 30 yrs
- —
Wind risk No data
- Chance of severe wind over 30 yrs
- —
Air-quality risk No data
- Unhealthy air days now
- —
- Unhealthy air days in 30 yrs
- —
Risk factors via First Street. Map © Google.
Why this score? — see what drove the B- grade
The composite is a weighted blend of 9 inputs, each scored 0–100. Each bar is that input's sub-score; the figure is the points it added to the 100-point composite (weight × sub-score).
- Cash flow +30.0/30.0
- 1% rule +10.0/10.0
- DSCR +10.0/10.0
- ARV discount +7.5/15.0
- Schools +4.7/10.0
- Livability +2.5/5.0
- Condition / age +2.5/5.0
- Rent growth +1.3/5.0
- Appreciation +0.0/10.0
$84,000
🖨 Deal sheet 📄 Offer letter ✓ Due diligence
Listing remarks
You'll love this modern, well-maintained manufactured home located in the beautiful Fountain Springs community in Oshtemo township. Community site rent includes lawn mowing, trimming, seasonal lawn care, pet fees, 2 dog maximum, pool, pickleball court, playground, groomed walking trails, and clubhouse. Fountain Springs is conveniently located near all major highways and shopping. Home includes all major kitchen appliances and the washer/dryer.
Key facts
- Washer dryer
- Built 2020
- Listed 103 days
Tags
Neighborhood map
What this means for you Summary
Snapshot
- This is a 3-bed/1.0-bath single-family listed at $84k.
Deal economics
- At list price, monthly cash flow is $706 ($8k/yr) — positive.
- The deal already cash-flows at list — no discount required.
- Meets the 1% rule at list price ($2k rent vs $84k).
- Recommended offer: $76k (9.0% below list) — sets the bar for market timing.
Location & tenants
- Location reads: area grade B — affects rentability + tenant quality, not the cash-flow math above.
- Kalamazoo Public Schools (urban): math 43% / reading 72% proficiency, ranked #71 of 540 in MI (top 13%) — acceptable for families but not a draw, mixed tenant base, ~2y average lease; 66% free/reduced lunch — lower-income household profile, screen leases tightly.
- Market conditions: Rents falling (-5.0%/yr); 375 active listings in the ZIP; 7 comparable units currently listed for rent nearby; rentals leasing fast (median 13d on market — plan ~1-2 weeks tenant-placement turnaround); solid renter incomes; 339 units permitted in Kalamazoo County in 2024 (22 in 5+ unit buildings).
Forward outlook
- Local home prices are declining (-3.0%/yr); year-one equity from $581 of loan paydown is wiped out by about $3k of value loss. Plan a longer hold.
- Kalamazoo County population projected at +18% by 2050 — long-run rental-demand tailwind backs the buy-and-hold thesis.
- At projected returns (-3.0% appreciation + 0.0% rent growth), your $24k cash investment doubles in ~4 years — after that, you're playing with house money.
Negotiation context
- It's been on market 103 days — a 9% lower offer ($76k) is reasonable based on typical stale-listing flexibility.
Questions for the listing agent
- It's been on market 103 days. Have you received any prior offers? Is the seller open to a 9% concession, seller financing, or rate buy-down credit?
- Why hasn't it sold? Are there any deal-killer items the seller is aware of (foundation, flood, title, zoning, code violations)?
- Is there a deadline driving the sale (1031 exchange, divorce, estate, relocation)? That informs how much negotiation room exists.
- What's the average days-on-market for RENTAL listings here right now (not sales)? A rising rental-DOM trend means longer vacancies and softer asking-rent achievability than the comps imply.
- What's the recent tenant-quality profile in this submarket — average credit score on applications, eviction rate, late-payment / NSF rate, and stable-employment percentage? A property-management company in the area should have these aggregated.
- How much new for-sale + rental construction is in the pipeline within 1–3 miles? Heavy new supply typically softens prices + rents 12–24 months out; constrained supply supports both.
Investment metrics
- 1% rule
- 1.94% ✓
- Cap rate
- 16.39%
- Cash-on-cash
- 36.05%
- DSCR
- 2.60
- GRM
- 4.3
CMA / ARV
No comps found within radius.
Projected returns pro-forma
-3.0% appreciation · 0.0% rent growth · sell at horizon
- IRR
- 28.3%
- Equity multiple
- 2.13×
- Total profit
- $26,636
- Equity at exit
- $12,525
- IRR
- 34.0%
- Equity multiple
- 3.67×
- Total profit
- $62,783
- Equity at exit
- $7,263
Cash invested: $23,520 (down + closing). Projections, not guarantees.
Landlord ↔ Tenant lean methodology
- Overall (STATE)
- 62 Landlord-Friendly
- State Michigan
- 62 Landlord-Friendly · EVEN
- County
- — inherits STATE
- City
- — inherits STATE
ZIP-level market 49009
- Rents YoY
- -5.0%
- Active inventory
- 375
- Price-to-rent
- 4.3×
Monthly cashflow live
- Estimated rent
- $1,629 high interval (Pro) →
- Mortgage (P&I)
- −$441
- Tax est. 1.5%
- −$105 /mo · $1,260/yr
- Insurance
- −$35
- HOA
- −$0
- Vacancy / Maint / Mgmt
- −$342
- Net cashflow
- $706
Break-even live
UW: 25.0% down · 7.5% · 30yr · 1.5% tax · 5.0% vac · 8.0% maint · 8.0% mgmt
Financing live
Cash to close
- Down payment
- $21,000
- Closing costs
- $2,520
- Reserves months
- —
- Total cash needed
- —
Loan-product check · same deal, 3 products live
Conventional
25% down · 7.5% · 30yr
- Down + closing
- —
- Monthly P&I
- —
- Monthly cashflow
- —
- DSCR
- —
- Eligible?
- —
Personal DTI + credit; lowest rate.
DSCR
20% down · 8.5% · 30yr
- Down + closing
- —
- Monthly P&I
- —
- Monthly cashflow
- —
- DSCR
- —
- Eligible?
- —
No personal income docs; deal must DSCR.
Hard money
10% down · 12.0% · 12mo
- Down + closing
- —
- Monthly P&I
- —
- Monthly cashflow
- —
- DSCR
- —
- Eligible?
- —
Short-term bridge; refi at stabilization.
Rent comps 7 comps
| Address | Beds | Baths | Sqft | Rent | $/sqft | DOM | Units | Dist |
|---|---|---|---|---|---|---|---|---|
| 1410 S 9th St Kalamazoo, MI | 2.0–3.0 | 2.0 | 1204 | $1,719 | $1.43 | 20d | 1 | 0.08mi |
| 6065 Fairgrove St Kalamazoo, MI | 3.0 | 3.0 | 1400 | $2,000 | $1.43 | 13d | 1 | 0.78mi |
| 5900 Copper Beech Blvd Kalamazoo, MI | 1.0–4.0 | 1.0–4.5 | 1325 | $916 | $0.69 | 13d | 1 | 0.85mi |
| 5500 W KL Ave Kalamazoo, MI | 1.0–3.0 | 1.0–2.0 | 836 | $1,349 | $1.61 | 13d | 1 | 1.06mi |
| 2487 Chestnut Hills Dr Kalamazoo, MI | 1.0–2.0 | 1.0 | 750 | $1,350 | $1.80 | 13d | 4 | 1.09mi |
| 1800 S 11th St Kalamazoo, MI | 1.0–2.0 | 1.0 | 635 | $999 | $1.57 | 20d | 9 | 1.11mi |
| 690 Dragonfly Rd Kalamazoo, MI | 1.0–3.0 | 1.0–2.0 | 969 | $1,192 | $1.23 | 13d | 32 | 1.36mi |
Listing history 17 events
-
2026-06-18days on market $84,000 Active 103 DOM
-
2026-06-17days on market $84,000 Active 102 DOM
-
2026-06-16days on market $84,000 Active 101 DOM
-
2026-06-15days on market $84,000 Active 100 DOM
-
2026-06-14days on market $84,000 Active 98 DOM
-
2026-06-13days on market $84,000 Active 97 DOM
-
2026-06-10days on market $84,000 Active 95 DOM
-
2026-06-09days on market $84,000 Active 94 DOM
-
2026-06-08days on market $84,000 Active 93 DOM
-
2026-06-07days on market $84,000 Active 92 DOM
-
2026-06-05pricedays on market $84,000 Active 89 DOM
-
2026-06-03days on market $89,000 Active 88 DOM
-
2026-06-02days on market $89,000 Active 87 DOM
-
2026-06-01days on market $89,000 Active 86 DOM
-
2026-05-31days on market $89,000 Active 85 DOM
-
2026-05-30days on market $89,000 Active 84 DOM
-
2026-03-07$89,000 Active
ⓘ Source: listings_history table (triggers on properties + properties_extension) + one-shot
backfill from property_details.listing_events for pre-trigger history.
Nearby sold comps map
Loading sold comps map…
Walkable amenities ~0.75 mi
Loading nearby amenities…
Taxation est. · year 1
- Rental income
- $19,549
- − Mortgage interest
- −$4,705
- − Property taxes
- −$1,260
- − Insurance
- −$420
- − Repairs & maintenance
- −$1,564
- − Management
- −$1,564
- − Depreciation
- −$2,444
- Taxable income
- $7,592
- Est. tax owed @ 24.0%
- −$1,822
- After-tax cash flow
- $6,656/yr
For passive investors: Depreciation is non-cash, so a rental often shows a tax loss while cash-flowing — sheltering income. Rental losses are passive: they offset passive income freely, and up to $25,000/yr can offset ordinary (W-2) income if you actively participate and your MAGI is under $100k (phasing out to $0 by $150k); unused losses carry forward. On sale, claimed depreciation is recaptured at up to 25%, and gains may owe capital-gains tax (a 1031 exchange can defer both). Figures are a year-1 estimate at your 24.0% rate — not tax advice; consult a CPA.
Schools (NCES district)
- District
- Kalamazoo Public Schools
- NCES district ID
- 2619950
- Math proficiency
- 43% ▲ 13.00%
- Reading proficiency
- 72% ▲ 33.00%
- Median HH income
- $35,291
- Composite
- 47.48/100
- National rank
- #2275
- State rank
- #71 of 540 in MI
Livability — Oshtemo
No livability data for this city. (Only ~50 U.S. cities are tracked.)
Census & demographics
- County
- Kalamazoo County · 224,317 people
- Metro
- Kalamazoo-Portage, MI
- Population (ZIP)
- 47,971
- Household income
- $80,930
- Rent vs Own
- Severe rent burden
- 1579.0
Population outlook (Kalamazoo County) Hauer SSP2
- Today (2025)
- 280,982 people
- By 2030
- 292,068 · +3.9%
- By 2040
- 312,191 · +11.1%
- By 2050
- 331,196 · +17.9%
- By 2075
- 379,021 · +34.9%
- By 2100
- 396,579 · +41.1%
Race, ethnicity, and origin ACS 2023
- Neighborhood character
- Predominantly White (75%)
- Race & ethnicity
- White 75% Two or more races 9% Black 8% Asian 5% Hispanic / Latino 4%
- Common ancestry
- Iranian 9% Romanian 6% Lithuanian 2%
- Foreign-born
- 9% · Canada, China
- Languages at home
- 88% English-only · Other Indo-European 3% Arabic 2% Spanish 2%
Political lean MEDSL · Kalamazoo
- 2024 margin
- D (+17.7) · D 58.0% · R 40.3% · Other 1.7%
- 2008→2024 swing
- -1.8pp toward R · 2008: 19.5pp · 2024: 17.7pp
- All cycles
- 2024: D+17.7 2020: D+18.7 2016: D+12.8 2012: D+13.3 2008: D+19.5
Not yet ingested
- Civics
- —
Market trends
- HPI YoY
- ▼ -207.34%
- Current HPI
- 209.5649
- Rent YoY
- ▼ -4.96%
- Metro
- Kalamazoo-Portage, MI
- State GDP YoY
- ▲ 1.37%
- F500 in state
- 28
Industry mix (Fortune 500 HQ in MI)
| Industry | F500 HQs | Revenue |
|---|---|---|
| Automotive Parts | 3 | $48B |
|
||
| Automotive | 2 | $372B |
|
||
| Chemicals | 1 | $45B |
|
||
| Automotive Retail | 1 | $29B |
|
||
| Healthcare / Medical Devices | 1 | $23B |
|
||
| Automotive Technology | 1 | $20B |
|
||
Price history
1 event — show timeline
- 2026-03-07 Listed $89,000 ForSaleByOwner.com
Property tax history
-1.6%/yrLatest (2025): $55 · +2.9% YoY. Source: county tax records.
Cash-flow waterfall
monthlySold comps — $/sqft
last 12 mo · ≤1 miLoading sold comps…