 🏷️ Likely Rental
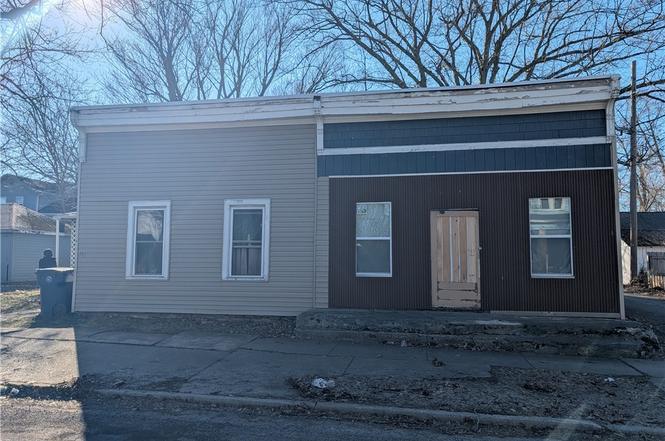
165 Erie St · Lockport, NY
Flood risk 1/10 · Minimal
- FEMA flood zone
- X (unshaded)
- Chance of flooding over 30 yrs
- 0.0%
- Est. flood insurance / yr
- $473 – $860
Fire risk 1/10 · Minimal
- Est. fire insurance / yr
- $691 – $1,283
Heat risk 2/10 · Minimal
- Hot days now (above 94°F)
- 7 days/yr
- Hot days in 30 yrs
- 15 days/yr
Wind risk 1/10 · Minimal
- Chance of severe wind over 30 yrs
- —
Air-quality risk 2/10 · Minimal
- Unhealthy air days now
- 1 days/yr
- Unhealthy air days in 30 yrs
- 2 days/yr
Risk factors via First Street. Map © Google.
Why this score? — see what drove the B- grade
The composite is a weighted blend of 9 inputs, each scored 0–100. Each bar is that input's sub-score; the figure is the points it added to the 100-point composite (weight × sub-score).
- Cash flow +23.5/30.0
- ARV discount +15.0/15.0
- DSCR +7.5/10.0
- 1% rule +5.7/10.0
- Schools +3.9/10.0
- Livability +3.8/5.0
- Rent growth +3.4/5.0
- Condition / age +2.5/5.0
- Appreciation +0.0/10.0
$140,000
🖨 Deal sheet 📄 Offer letter ✓ Due diligence
Listing remarks
165 Erie Street, Lockport, NY Unique mixed-use investment opportunity in the City of Lockport! This zoned mixed-use double offers excellent income potential with flexibility for both residential and commercial use. One side of the property features a large, finished 3-bedroom, 2-bath apartment currently rented for $1,350 per month. The unit offers generous living space and includes the convenience of in-unit laundry, making it very attractive to tenants. The other side is a commercial space that is currently unfinished, providing a blank slate for an owner or investor to customize for a business, office, studio, or additional income-producing use. Additional highlights include a full basem
Key facts
- Income potential
- In-unit laundry
- Full basement
Tags
Property features AI
Finance
- Financial info: Property configured as a 2-unit building; Two separate electric meters; Two separate gas meters; One unit listed with $1,350 monthly rent; Operating expenses include water/sewer; owner pays water
Exterior
- Parking: Two or more parking spaces
- Utilities: Public water connected; Sewer connected
- Home design: Single-story building; Vinyl siding; Resale property
- Construction: Vinyl siding construction; Existing structure (year built: existing)
- Exterior features: Rectangular residential lot; City street frontage; Lot dimensions approximately 74 x 52 feet
Interior
- Kitchen: Appliances include gas water heater
- Bedrooms: Unit with 3 bedrooms (described with living room, porch, laundry in unit)
- Flooring: Laminate flooring; Vinyl flooring; Varied flooring
- Bathrooms: Two full bathrooms
- Heating & cooling: Gas heating; Baseboard heating; Forced air heating
- Interior features: Full basement; Laminate, vinyl, and varied flooring throughout; Gas water heater
- Laundry & utility: In-unit laundry for one unit; Separate gas meters for units
Neighborhood map
What this means for you Summary
Snapshot
- This is a 3-bed/1.0-bath single-family listed at $140k.
Deal economics
- At list price, monthly cash flow is $261 ($3k/yr) — positive.
- The deal already cash-flows at list — no discount required.
- Meets the 1% rule at list price ($2k rent vs $140k).
- Recommended offer: $127k (9.0% below list) — sets the bar for market timing.
- Cap rate 8.5% vs local median 4.5% in Lockport — top-decile yield for the area; either an underpriced asset or a hidden risk that comps aren't pricing in. Stress-test before assuming the spread holds.
Location & tenants
- Location reads 76/100 on livability (#232 in NY, #3,669 nationally) — a middle-class / working-renter tenant base. Strengths: amenities A+, cost of living A+, housing A+; Watch: commute D+, crime F, employment D-.
- Lockport City School District (town): math 44% / reading 49% proficiency, ranked #452 of 590 in NY (top 77%) — families likely to look elsewhere, expect single-tenant / working-renter base with shorter leases.
- Market conditions: Rents rising (+3.7%/yr); 357 active listings in the ZIP; solid renter incomes; 167 units permitted in Niagara County in 2024 (0 in 5+ unit buildings).
Forward outlook
- Local home prices are declining (-3.0%/yr); year-one equity from $968 of loan paydown is wiped out by about $4k of value loss. Plan a longer hold.
- Niagara County population projected at -19% by 2050 — secular population decline; favor cash flow + early exit over multi-decade hold.
Negotiation context
- It's been on market 101 days — a 9% lower offer ($127k) is reasonable based on typical stale-listing flexibility.
- Current owner paid $56k; list at $140k implies a 152% gain — meaningful room to come down on a strong offer.
Risks & watch-outs
- Watch-outs: built in 1900 — expect roof / HVAC / electrical / plumbing capex.
Questions for the listing agent
- It's been on market 101 days. Have you received any prior offers? Is the seller open to a 9% concession, seller financing, or rate buy-down credit?
- Built in 1900 — when were the roof, HVAC, electrical panel, plumbing, and water heater last replaced?
- Why hasn't it sold? Are there any deal-killer items the seller is aware of (foundation, flood, title, zoning, code violations)?
- Is there a deadline driving the sale (1031 exchange, divorce, estate, relocation)? That informs how much negotiation room exists.
- Schools are B-rated — typically a magnet for longer-tenancy family renters. What's the average tenant stay here, and is there a school-zone premium baked into asking?
- Crime grade is F in this area — have there been break-ins, vandalism, or insurance claims at this property in the last 3 years? What carrier currently insures it and at what premium?
- What's the average days-on-market for RENTAL listings here right now (not sales)? A rising rental-DOM trend means longer vacancies and softer asking-rent achievability than the comps imply.
- What's the recent tenant-quality profile in this submarket — average credit score on applications, eviction rate, late-payment / NSF rate, and stable-employment percentage? A property-management company in the area should have these aggregated.
- How much new for-sale + rental construction is in the pipeline within 1–3 miles? Heavy new supply typically softens prices + rents 12–24 months out; constrained supply supports both.
Investment metrics
- 1% rule
- 1.07% ✓
- Cap rate
- 8.53%
- Cash-on-cash
- 7.98%
- DSCR
- 1.35
- GRM
- 7.8
CMA / ARV
- ARV (on-the-fly)
- $239,776
- Comps found
- 12
Show comp detail 12 sales within ~0.75 mi
| Address | Dist | Beds/Ba | Sqft | Sold | Price | $/sf | Match |
|---|---|---|---|---|---|---|---|
| 544 Willow St | 0.47mi | 3/1.5 | 2,124 (+4%) | 4mo | $245,000 | $115 | 65 |
| 391 Walnut St | 0.33mi | 4/1.0 (+1) | 1,856 (-9%) | 2mo | $180,400 | $97 | 64 |
| 250 Pine St | 0.54mi | 3/1.5 | 1,956 (-4%) | 5mo | $260,000 | $133 | 62 |
| 10 Mcintosh Dr | 0.59mi | 3/1.5 | 1,964 (-3%) | 3mo | $330,000 | $168 | 62 |
| 100 Regent St | 0.36mi | 3/2.5 | 1,795 (-12%) | 0mo | $248,000 | $138 | 58 |
| 155 Chestnut St | 0.47mi | 4/1.5 (+1) | 2,212 (+9%) | 2mo | $260,400 | $118 | 55 |
| 26 Maple St | 0.44mi | 3/1.0 | 2,304 (+13%) | 4mo | $235,000 | $102 | 54 |
| 160 Waterman St | 0.52mi | 4/1.5 (+1) | 1,868 (-8%) | 3mo | $150,000 | $80 | 53 |
| 319 Willow St | 0.69mi | 4/1.0 (+1) | 1,912 (-6%) | 2mo | $200,000 | $105 | 52 |
| 105 Park Lane Cir | 0.54mi | 4/2.5 (+1) | 1,886 (-7%) | 6mo | $255,000 | $135 | 47 |
| 535 Willow St St | 0.44mi | 3/2.5 | 2,328 (+15%) | 3mo | $360,000 | $155 | 47 |
| 1 Wilson Pkwy | 0.56mi | 4/1.5 (+1) | 1,728 (-15%) | 4mo | $185,000 | $107 | 39 |
Match score weights: distance 35% · size 25% · config 20% · recency 20%. Top-matched comps best support the ARV.
Projected returns pro-forma
-3.0% appreciation · 3.67% rent growth · sell at horizon
- IRR
- -3.4%
- Equity multiple
- 0.87×
- Total profit
- $-5,072
- Equity at exit
- $20,874
- IRR
- 7.0%
- Equity multiple
- 1.54×
- Total profit
- $21,190
- Equity at exit
- $12,105
Cash invested: $39,200 (down + closing). Projections, not guarantees.
Landlord ↔ Tenant lean methodology
- Overall (STATE)
- 15 Strongly Tenant-Friendly
- State New York
- 15 Strongly Tenant-Friendly · D+10
- County
- — inherits STATE
- City
- — inherits STATE
ZIP-level market 14094
- Rents YoY
- 3.7%
- Active inventory
- 357
- Price-to-rent
- 7.8×
Monthly cashflow live
- Estimated rent
- $1,504 medium interval (Pro) →
- Mortgage (P&I)
- −$734
- Tax from tax record
- −$135 /mo · $1,620/yr
- Insurance
- −$58
- HOA
- −$0
- Vacancy / Maint / Mgmt
- −$316
- Net cashflow
- $261
Break-even live
UW: 25.0% down · 7.5% · 30yr · 1.5% tax · 5.0% vac · 8.0% maint · 8.0% mgmt
Financing live
Cash to close
- Down payment
- $35,000
- Closing costs
- $4,200
- Reserves months
- —
- Total cash needed
- —
Loan-product check · same deal, 3 products live
Conventional
25% down · 7.5% · 30yr
- Down + closing
- —
- Monthly P&I
- —
- Monthly cashflow
- —
- DSCR
- —
- Eligible?
- —
Personal DTI + credit; lowest rate.
DSCR
20% down · 8.5% · 30yr
- Down + closing
- —
- Monthly P&I
- —
- Monthly cashflow
- —
- DSCR
- —
- Eligible?
- —
No personal income docs; deal must DSCR.
Hard money
10% down · 12.0% · 12mo
- Down + closing
- —
- Monthly P&I
- —
- Monthly cashflow
- —
- DSCR
- —
- Eligible?
- —
Short-term bridge; refi at stabilization.
Listing history 18 events
-
2026-06-18days on market $140,000 Active 101 DOM
-
2026-06-17days on market $140,000 Active 100 DOM
-
2026-06-16days on market $140,000 Active 99 DOM
-
2026-06-15days on market $140,000 Active 98 DOM
-
2026-06-13days on market $140,000 Active 96 DOM
-
2026-06-13days on market $140,000 Active 95 DOM
-
2026-06-10days on market $140,000 Active 93 DOM
-
2026-06-09days on market $140,000 Active 92 DOM
-
2026-06-08days on market $140,000 Active 91 DOM
-
2026-06-07days on market $140,000 Active 90 DOM
-
2026-06-05days on market $140,000 Active 87 DOM
-
2026-06-03days on market $140,000 Active 86 DOM
-
2026-06-02days on market $140,000 Active 85 DOM
-
2026-06-01days on market $140,000 Active 84 DOM
-
2026-05-31days on market $140,000 Active 83 DOM
-
2026-03-22price $140,000
-
2026-03-09$150,000 Active
-
1995-06-29soldstatus $55,500
ⓘ Source: listings_history table (triggers on properties + properties_extension) + one-shot
backfill from property_details.listing_events for pre-trigger history.
Tax reassessment forecast NY · Partial reset (capped growth)
- Current annual tax
- $1,620 · $135/mo
- Projected year-2 tax
- $1,993 · $166/mo
- Expected delta
- +$373/yr (+$31/mo · 23.0%)
ⓘ Screening estimate from a state-policy table — verify with the county assessor before closing.
Climate risk First Street
- Flood 1/10 Low FEMA zone X (unshaded) · 0% chance over 30 yrs
- Wildfire 1/10 Low
- Heat 2/10 Low 7 d/yr ≥94°F today · 15 d/yr by 30 yrs out
- Wind 1/10 Low
- Air quality 2/10 Low 1 unhealthy d/yr today · 2 by 30 yrs out
Nearby sold comps map
Loading sold comps map…
Walkable amenities ~0.75 mi
Loading nearby amenities…
Taxation est. · year 1
- Rental income
- $18,047
- − Mortgage interest
- −$7,842
- − Property taxes
- −$1,620
- − Insurance
- −$700
- − Repairs & maintenance
- −$1,444
- − Management
- −$1,444
- − Depreciation
- −$4,073
- Taxable income
- $924
- Est. tax owed @ 24.0%
- −$222
- After-tax cash flow
- $2,905/yr
For passive investors: Depreciation is non-cash, so a rental often shows a tax loss while cash-flowing — sheltering income. Rental losses are passive: they offset passive income freely, and up to $25,000/yr can offset ordinary (W-2) income if you actively participate and your MAGI is under $100k (phasing out to $0 by $150k); unused losses carry forward. On sale, claimed depreciation is recaptured at up to 25%, and gains may owe capital-gains tax (a 1031 exchange can defer both). Figures are a year-1 estimate at your 24.0% rate — not tax advice; consult a CPA.
Schools (NCES district)
- District
- Lockport City School District
- NCES district ID
- 3617670
- Math proficiency
- 44% ▼ -7.00%
- Reading proficiency
- 49% ▲ 3.00%
- Median HH income
- $43,793
- Composite
- 39.28/100
- National rank
- #3997
- State rank
- #452 of 590 in NY
Livability — Lockport
- Score
- 76/100
- State rank
- #232
- US rank
- #3669
Category grades
Schools grade is shown separately in the Schools card above.
Census & demographics
- Census place
- Lockport, NY
- County
- Niagara County · 157,377 people
- Metro
- Buffalo-Cheektowaga, NY
- Population (ZIP)
- 50,153
- Household income
- $75,427
- Rent vs Own
- Severe rent burden
- 1112.0
Population outlook (Niagara County) Hauer SSP2
- Today (2025)
- 204,149 people
- By 2030
- 197,900 · -3.1%
- By 2040
- 182,239 · -10.7%
- By 2050
- 165,198 · -19.1%
- By 2075
- 129,416 · -36.6%
- By 2100
- 96,222 · -52.9%
Race, ethnicity, and origin ACS 2023
- Neighborhood character
- Predominantly White (84%)
- Race & ethnicity
- White 84% Two or more races 6% Black 6% Hispanic / Latino 3%
- Common ancestry
- Romanian 9% Slovak 2% Lithuanian 2%
- Foreign-born
- 3% · Canada
- Languages at home
- 96% English-only · Spanish 1% Russian/Polish/Slavic 1% Other Indo-European 1%
Political lean MEDSL · Niagara
- 2024 margin
- R (+14.9) · D 42.5% · R 57.5%
- 2008→2024 swing
- -15.9pp toward R · 2008: 1.0pp · 2024: -14.9pp
- All cycles
- 2024: R+14.9 2020: R+9.7 2016: R+19.0 2012: D+0.6 2008: D+1.0
Not yet ingested
- Civics
- —
Market trends
- HPI YoY
- ▼ -262.57%
- Current HPI
- 303.6109
- Rent YoY
- ▲ 3.67%
- Metro
- Buffalo-Cheektowaga, NY
- State GDP YoY
- ▲ 2.60%
- F500 in state
- 92
Industry mix (Fortune 500 HQ in NY)
| Industry | F500 HQs | Revenue |
|---|---|---|
| Financial Services | 10 | $950B |
|
||
| Consumer Goods | 9 | $162B |
|
||
| Insurance | 4 | $225B |
|
||
| Telecommunications | 2 | $144B |
|
||
| Pharmaceuticals | 2 | $112B |
|
||
| Media / Entertainment | 2 | $69B |
|
||
Price history
+152.3% since first listed3 events — show timeline
- 2026-03-22 Price Changed $140,000 WNYREIS
- 2026-03-09 Listed $150,000 WNYREIS
- 1995-06-29 Sold (Public Records) $55,500 Public Records
Property tax history
+7.7%/yrLatest (2025): $1,620 · +2.8% YoY. Source: county tax records.
Cash-flow waterfall
monthlySold comps — $/sqft
last 12 mo · ≤1 miLoading sold comps…