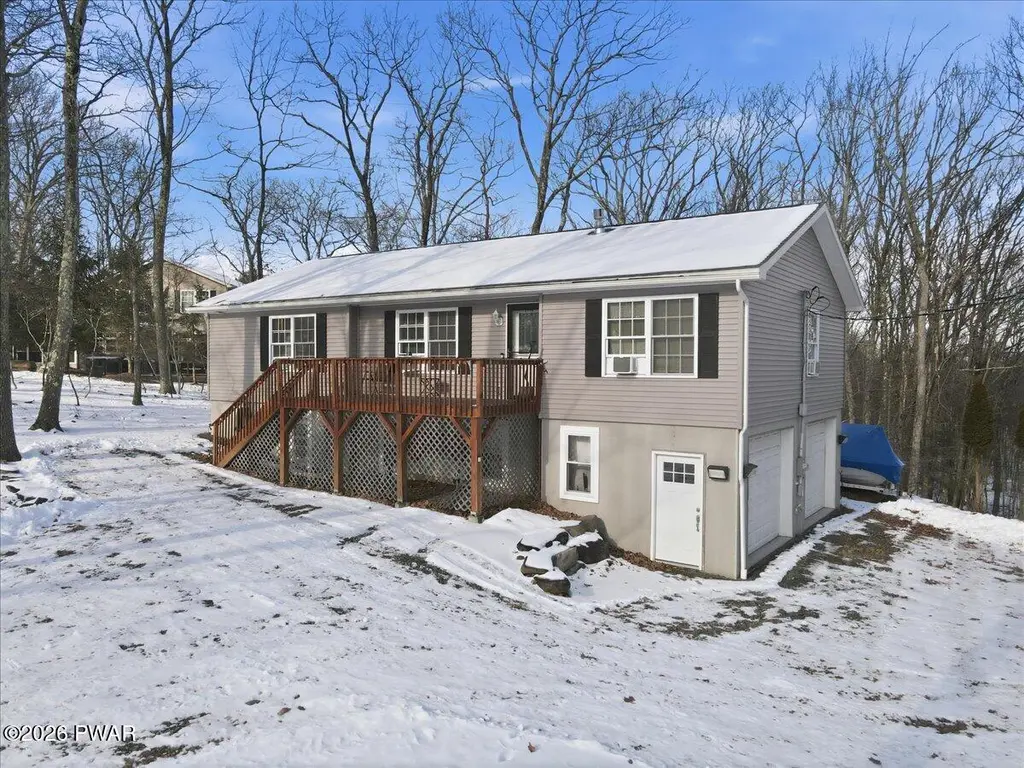
1011 Salem Pl · Wallenpaupack Lake Estates, PA
Flood risk 1/10 · Minimal
- FEMA flood zone
- X (unshaded)
- Chance of flooding over 30 yrs
- 0.0%
- Est. flood insurance / yr
- $473 – $860
Fire risk 3/10 · Minor
- Est. fire insurance / yr
- $511 – $949
Heat risk 2/10 · Minimal
- Hot days now (above 91°F)
- 7 days/yr
- Hot days in 30 yrs
- 15 days/yr
Wind risk 3/10 · Minor
- Chance of severe wind over 30 yrs
- 4.0%
Air-quality risk 2/10 · Minimal
- Unhealthy air days now
- 1 days/yr
- Unhealthy air days in 30 yrs
- 2 days/yr
Risk factors via First Street. Map © Google.
Why this score? — see what drove the D- grade
The composite is a weighted blend of 9 inputs, each scored 0–100. Each bar is that input's sub-score; the figure is the points it added to the 100-point composite (weight × sub-score).
- ARV discount +12.5/15.0
- Appreciation +10.0/10.0
- Schools +4.2/10.0
- Cash flow +3.6/30.0
- Livability +3.4/5.0
- Rent growth +2.5/5.0
- Condition / age +2.5/5.0
- 1% rule +0.0/10.0
- DSCR +0.0/10.0
$419,000
🖨 Deal sheet (PDF) 📄 Offer letter ✓ Due diligence
Listing remarks MLS
Welcome to 1011 Salem Place in Lake Ariel. This three-bedroom, two-and-a-half-bath home is located on a quiet cul-de-sac, offering a peaceful setting with minimal traffic. The home offers a comfortable layout with plenty of potential to make it your own, whether you're planning to live here year-round or use it as a weekend getaway in the Poconos. Furniture and a golf cart are included, making it move-in ready and perfect for enjoying the community right away. Conveniently located near local shops, lakes, and outdoor recreation. Come start enjoying life at the lake!
Key facts
- Move-in ready
- Outdoor recreation
- Quiet cul-de-sac
Tags
Neighborhood map
What this means for you Summary
Snapshot
- This is a 3-bed/2.5-bath single-family listed at $419k.
Deal economics
- At list price, monthly cash flow is $-1k ($-15k/yr) — negative.
- To cash-flow at today's rent, offer at most $199k (52.6% below list).
- To meet the 1% rule (rent ≥ 1% of price), the offer needs to be $209k (50.2% below list).
- Recommended offer: $199k (52.6% below list) — sets the bar for cash-flow.
Location & tenants
- Location reads 68/100 on livability (#896 in PA) — a middle-class / working-renter tenant base. Strengths: crime A+, cost of living A+, employment A; Watch: amenities F, commute F, health & safety F.
- Wallenpaupack Area SD (rural): math 39% / reading 59% proficiency, ranked #192 of 539 in PA (top 36%) — families likely to look elsewhere, expect single-tenant / working-renter base with shorter leases.
- Zoned schools: Wallenpaupack North Intrmd Sch (math 36% / reading 59%, grade D, #733 of 1,518 statewide, top 48%, 471 students, 63% FRL); Wallenpaupack Area Ms (math 23% / reading 57%, grade F, #257 of 512 statewide, top 52%, 644 students, 59% FRL); Wallenpaupack Area Hs (math 74% / reading 67%, grade B+, #48 of 437 statewide, top 11%, 990 students, 62% FRL) — zoned schools average 61% FRL vs 44% district-wide (18 pts higher); higher-poverty schools than district average — tighter screening recommended.
- Market conditions: 341 active listings in the ZIP; 177 units permitted in Wayne County in 2024 (0 in 5+ unit buildings).
Forward outlook
- In year one you build about $45k of equity ($3k loan paydown + $42k appreciation (10.0% local appreciation)).
- Wayne County population projected at -17% by 2050 — secular population decline; favor cash flow + early exit over multi-decade hold.
- By year 2, paydown + projected appreciation supports a ~$72k cash-out refi (75% LTV) — recoverable capital for the next deal without selling this one.
Negotiation context
- It's been on market 145 days — a 12% lower offer ($369k) is reasonable based on typical stale-listing flexibility.
- 2 sale attempts with the ask held roughly flat each time — persistent listings suggest the price (not the market) is what's stuck; bring a comps-based counter.
- Current owner paid $10k; list at $419k implies a 4090% gain — meaningful room to come down on a strong offer.
Questions for the listing agent
- What do current leases actually rent for vs. the listed asking? Can we see a recent rent roll and the last 12 months of T-12 income?
- It's been on market 145 days. Have you received any prior offers? Is the seller open to a 53% concession, seller financing, or rate buy-down credit?
- What does the HOA fee cover, when was the last increase, and are there any pending special assessments or reserve-fund shortfalls?
- Why hasn't it sold? Are there any deal-killer items the seller is aware of (foundation, flood, title, zoning, code violations)?
- Is there a deadline driving the sale (1031 exchange, divorce, estate, relocation)? That informs how much negotiation room exists.
- Schools are D-rated, which usually means shorter tenancies and higher turnover. Who's the typical renter profile here, and what's been the actual vacancy rate?
- The area grade is low — what's the realistic commute time and amenity access for the typical tenant pool here? Any planned neighborhood developments (good or bad) we should know about?
- What's the average days-on-market for RENTAL listings here right now (not sales)? A rising rental-DOM trend means longer vacancies and softer asking-rent achievability than the comps imply.
- What's the recent tenant-quality profile in this submarket — average credit score on applications, eviction rate, late-payment / NSF rate, and stable-employment percentage? A property-management company in the area should have these aggregated.
- How much new for-sale + rental construction is in the pipeline within 1–3 miles? Heavy new supply typically softens prices + rents 12–24 months out; constrained supply supports both.
Investment metrics
- 1% rule
- 0.50% ✗
- Cap rate
- 2.72%
- Cash-on-cash
- -12.76%
- DSCR
- 0.43
- GRM
- 16.7
CMA / ARV
- ARV (median comp)
- $471,736
- List price
- $419,000
- Delta
- -11.18%
- Verdict
- UNDERPRICED
- Comps
- 20 within 1.0 mi
Show comp detail 12 sales within ~0.75 mi
| Address | Dist | Beds/Ba | Sqft | Sold | Price | $/sf | Match |
|---|---|---|---|---|---|---|---|
| 1013 Ski Bluff Ter | 0.14mi | 4/3.0 (+1) | 2,300 (+9%) | 0mo | $475,000 | $207 | 71 |
| 1007 Deer Trail Rd | 0.25mi | 3/2.5 | 2,000 (-5%) | 14mo | $354,000 | $177 | 68 |
| 1115 Mustang Rd | 0.16mi | 4/3.5 (+1) | 2,242 (+6%) | 7mo | $496,500 | $221 | 67 |
| 1096 Aquarius Dr | 0.30mi | 3/2.5 | 2,334 (+11%) | 2mo | $725,000 | $311 | 66 |
| 1151 Mustang Rd | 0.25mi | 3/2.5 | 1,845 (-12%) | 6mo | $420,000 | $228 | 63 |
| 1035 Mustang Rd | 0.41mi | 3/2.0 | 2,061 (-2%) | 17mo | $249,000 | $121 | 61 |
| 1007 Apache Ct | 0.50mi | 3/3.0 | 2,014 (-4%) | 10mo | $395,500 | $196 | 59 |
| 1112 Aquarius Dr | 0.30mi | 3/2.5 | 1,855 (-12%) | 10mo | $609,000 | $328 | 58 |
| 1071 Sunrise Ter | 0.21mi | 3/3.0 | 2,337 (+11%) | 15mo | $440,000 | $188 | 57 |
| 1050 Green Valley Cir | 0.72mi | 3/3.0 | 2,168 (+3%) | 10mo | $315,000 | $145 | 51 |
| 1092 Mohican Rd | 0.49mi | 3/2.0 | 2,352 (+12%) | 9mo | $350,000 | $149 | 48 |
| 1008 Sunset Ct | 0.72mi | 4/3.0 (+1) | 2,400 (+14%) | 19mo | $339,000 | $141 | 20 |
Match score weights: distance 35% · size 25% · config 20% · recency 20%. Top-matched comps best support the ARV.
Projected returns pro-forma
10.0% appreciation · 3.0% rent growth · sell at horizon
- IRR
- 15.4%
- Equity multiple
- 2.27×
- Total profit
- $148,770
- Equity at exit
- $377,468
- IRR
- 15.0%
- Equity multiple
- 5.27×
- Total profit
- $500,654
- Equity at exit
- $814,025
Cash invested: $117,320 (down + closing). Projections, not guarantees.
Landlord ↔ Tenant lean methodology
- Overall (STATE)
- 62 Landlord-Friendly
- State Pennsylvania
- 62 Landlord-Friendly · EVEN
- County
- — inherits STATE
- City
- — inherits STATE
ZIP-level market 18436
- Home prices YoY
- 16.9%
- Active inventory
- 341
- Price-to-rent
- 16.7×
Monthly cashflow live
- Estimated rent
- $2,087 medium interval (Pro) →
- Mortgage (P&I)
- −$2,197
- Tax from tax record
- −$329 /mo · $3,953/yr
- Insurance
- −$175
- HOA
- −$195
- Vacancy / Maint / Mgmt
- −$438
- Net cashflow
- $-1,248
Break-even live
Sensitivity live
| Price | -10% $-1,010 | -5% $-1,129 | +0% $-1,248 | +5% $-1,366 | +10% $-1,485 |
|---|---|---|---|---|---|
| Rent | -10% $-1,412 | -5% $-1,330 | +0% $-1,248 | +5% $-1,165 | +10% $-1,083 |
| Rate | -1.0pp $-1,037 | -0.5pp $-1,141 | base $-1,248 | +0.5pp $-1,356 | +1.0pp $-1,467 |
UW: 25.0% down · 7.5% · 30yr · 1.5% tax · 5.0% vac · 8.0% maint · 8.0% mgmt
Financing live
Cash to close
- Down payment
- $104,750
- Closing costs
- $12,570
- Reserves months
- —
- Total cash needed
- —
Loan-product check · same deal, 3 products live
Conventional
25% down · 7.5% · 30yr
- Down + closing
- —
- Monthly P&I
- —
- Monthly cashflow
- —
- DSCR
- —
- Eligible?
- —
Personal DTI + credit; lowest rate.
DSCR
20% down · 8.5% · 30yr
- Down + closing
- —
- Monthly P&I
- —
- Monthly cashflow
- —
- DSCR
- —
- Eligible?
- —
No personal income docs; deal must DSCR.
Hard money
10% down · 12.0% · 12mo
- Down + closing
- —
- Monthly P&I
- —
- Monthly cashflow
- —
- DSCR
- —
- Eligible?
- —
Short-term bridge; refi at stabilization.
HOA detail
- Monthly dues
- $195 · $2,340/yr
Listing history 18 events
-
2026-06-21days on market $419,000 Active 145 DOM
-
2026-06-18days on market $419,000 Active 142 DOM
-
2026-06-17days on market $419,000 Active 141 DOM
-
2026-06-16days on market $419,000 Active 140 DOM
-
2026-06-15days on market $419,000 Active 139 DOM
-
2026-06-13days on market $419,000 Active 137 DOM
-
2026-06-13days on market $419,000 Active 136 DOM
-
2026-06-09days on market $419,000 Active 133 DOM
-
2026-06-08days on market $419,000 Active 132 DOM
-
2026-06-07days on market $419,000 Active 131 DOM
-
2026-06-04days on market $419,000 Active 128 DOM
-
2026-06-03days on market $419,000 Active 127 DOM
-
2026-06-02days on market $419,000 Active 126 DOM
-
2026-06-01days on market $419,000 Active 125 DOM
-
2026-05-31days on market $419,000 Active 124 DOM
-
2026-01-26$434,000 Active 572-char remark
Show marketing remark (572 chars)
Welcome to 1011 Salem Place in Lake Ariel. This three-bedroom, two-and-a-half-bath home is located on a quiet cul-de-sac, offering a peaceful setting with minimal traffic. The home offers a comfortable layout with plenty of potential to make it your own, whether you're planning to live here year-round or use it as a weekend getaway in the Poconos. Furniture and a golf cart are included, making it move-in ready and perfect for enjoying the community right away. Conveniently located near local shops, lakes, and outdoor recreation. Come start enjoying life at the lake!
-
2025-06-03$439,000 Active
-
2020-10-08soldstatus $10,000
ⓘ Source: listings_history table (triggers on properties + properties_extension) + one-shot
backfill from property_details.listing_events for pre-trigger history.
Tax reassessment forecast PA · Partial reset (capped growth)
- Current annual tax
- $3,953 · $329/mo
- Projected year-2 tax
- $5,287 · $441/mo
- Expected delta
- +$1,333/yr (+$111/mo · 33.7%)
ⓘ Screening estimate from a state-policy table — verify with the county assessor before closing.
Climate risk First Street
- Flood 1/10 Low FEMA zone X (unshaded) · 0% chance over 30 yrs
- Wildfire 3/10 Moderate
- Heat 2/10 Low 7 d/yr ≥91°F today · 15 d/yr by 30 yrs out
- Wind 3/10 Moderate 4% chance of damaging wind over 30 yrs
- Air quality 2/10 Low 1 unhealthy d/yr today · 2 by 30 yrs out
Nearby sold comps map
Loading sold comps map…
Walkable amenities ~0.75 mi
Loading nearby amenities…
Taxation est. · year 1
- Rental income
- $25,044
- − Mortgage interest
- −$23,471
- − Property taxes
- −$3,953
- − Insurance
- −$2,095
- − Repairs & maintenance
- −$2,003
- − Management
- −$2,003
- − HOA
- −$2,340
- − Depreciation
- −$12,189
- Taxable loss
- −$23,011
- Est. tax savings @ 24.0%
- +$5,523
- After-tax cash flow
- $-9,449/yr
For passive investors: Depreciation is non-cash, so a rental often shows a tax loss while cash-flowing — sheltering income. Rental losses are passive: they offset passive income freely, and up to $25,000/yr can offset ordinary (W-2) income if you actively participate and your MAGI is under $100k (phasing out to $0 by $150k); unused losses carry forward. On sale, claimed depreciation is recaptured at up to 25%, and gains may owe capital-gains tax (a 1031 exchange can defer both). Figures are a year-1 estimate at your 24.0% rate — not tax advice; consult a CPA.
Schools (NCES district)
- District
- Wallenpaupack Area SD
- NCES district ID
- 4224750
- Math proficiency
- 39% ▼ -10.00%
- Reading proficiency
- 59% ▼ -5.00%
- Median HH income
- $51,027
- Composite
- 41.97/100
- National rank
- #3345
- State rank
- #192 of 539 in PA
Livability — Wallenpaupack Lake Estates
- Score
- 68/100
- State rank
- #896
- US rank
- #9541
Category grades
Schools grade is shown separately in the Schools card above.
Census & demographics
- Census place
- Wallenpaupack Lake Estates, PA
- Population (ZIP)
- 13,225
Population outlook (Wayne County) Hauer SSP2
- Today (2025)
- 47,924 people
- By 2030
- 46,191 · -3.6%
- By 2040
- 42,815 · -10.7%
- By 2050
- 39,873 · -16.8%
- By 2075
- 34,556 · -27.9%
- By 2100
- 28,358 · -40.8%
Race, ethnicity, and origin ACS 2023
- Neighborhood character
- Predominantly White (95%)
- Race & ethnicity
- White 95% Two or more races 3% Hispanic / Latino 2%
- Common ancestry
- Romanian 9% Scotch-Irish 2% Iranian 2%
- Foreign-born
- 4%
- Languages at home
- 95% English-only · French/Haitian/Cajun 2% Russian/Polish/Slavic 1% Spanish 1%
Political lean MEDSL · Wayne
- 2024 margin
- Solid R (+37.1) · D 31.1% · R 68.2%
- 2008→2024 swing
- -24.8pp toward R · 2008: -12.3pp · 2024: -37.1pp
- All cycles
- 2024: R+37.1 2020: R+33.6 2016: R+39.7 2012: R+20.9 2008: R+12.3
Not yet ingested
- Civics
- —
Market trends
- HPI YoY
- ▲ 47.95%
- Current HPI
- 331.9645
- Rent YoY
- —
- Metro
- —
- State GDP YoY
- ▲ 1.68%
- F500 in state
- 34
Industry mix (Fortune 500 HQ in PA)
| Industry | F500 HQs | Revenue |
|---|---|---|
| Healthcare | 2 | $309B |
|
||
| Insurance | 2 | $27B |
|
||
| Telecommunications / Media | 1 | $124B |
|
||
| Industrial Distribution | 1 | $22B |
|
||
| Financial Services | 1 | $20B |
|
||
| Chemicals / Materials | 1 | $18B |
|
||
Price history
+4240.0% since first listed3 events — show timeline
- 2026-01-26 Listed $434,000 PWMLS
- 2025-06-03 Listed $439,000 PWMLS
- 2020-10-08 Sold (Public Records) $10,000 Public Records
Property tax history
+23.7%/yrLatest (2026): $3,953 · +20.6% YoY. Source: county tax records.
Cash-flow waterfall
monthlySold comps — $/sqft
last 12 mo · ≤1 miLoading sold comps…