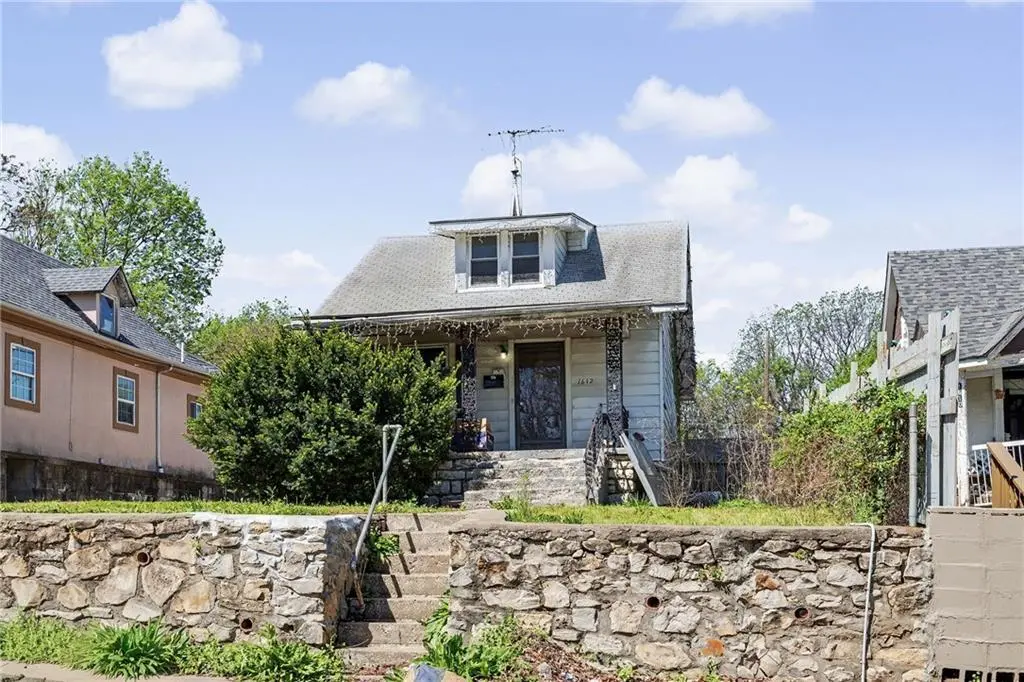
1612 Topping Ave · Kansas City, MO
Flood risk 1/10 · Minimal
- FEMA flood zone
- X (unshaded)
- Chance of flooding over 30 yrs
- 0.0%
- Est. flood insurance / yr
- $473 – $860
Fire risk 1/10 · Minimal
- Est. fire insurance / yr
- $1,054 – $1,958
Heat risk 4/10 · Minor
- Hot days now (above 106°F)
- 7 days/yr
- Hot days in 30 yrs
- 17 days/yr
Wind risk 2/10 · Minimal
- Chance of severe wind over 30 yrs
- —
Air-quality risk 3/10 · Minor
- Unhealthy air days now
- 2 days/yr
- Unhealthy air days in 30 yrs
- 3 days/yr
Risk factors via First Street. Map © Google.
Why this score? — see what drove the A grade
The composite is a weighted blend of 9 inputs, each scored 0–100. Each bar is that input's sub-score; the figure is the points it added to the 100-point composite (weight × sub-score).
- Cash flow +30.0/30.0
- ARV discount +15.0/15.0
- DSCR +10.0/10.0
- Appreciation +10.0/10.0
- 1% rule +9.8/10.0
- Livability +3.9/5.0
- Rent growth +2.5/5.0
- Condition / age +2.5/5.0
- Schools +1.5/10.0
$83,000
🖨 Deal sheet 📄 Offer letter ✓ Due diligence
Listing remarks MLS
SELLING "AS IS" - NO SELLER'S DISCLOSURES. Minimum $1000 certified earnest deposit. Need pre-approval/proof of funds submitted with all offers.
Key facts
- 5,613 sq ft lot
- Built 1910
- Listed 34 days
Property features AI
Exterior
- Parking: Off-street parking
- Utilities: Public water; Public sewer
- Home design: Single-family residence; Residential property; 1.5-story floor plan
- Construction: Frame construction; Composition roof
- Exterior features: Lot approximately 5,613 square feet; Flood plain status unknown
Interior
- Bedrooms: 3 bedrooms
- Bathrooms: 1 full bathroom
- Heating & cooling: Gravity heating; Electric cooling
- Interior features: Concrete basement
- Laundry & utility: Laundry in basement
Neighborhood map
What this means for you Summary
Snapshot
- This is a 3-bed/1.0-bath single-family listed at $83k.
Deal economics
- At list price, monthly cash flow is $455 ($5k/yr) — positive.
- The deal already cash-flows at list — no discount required.
- Meets the 1% rule at list price ($1k rent vs $83k).
- Recommended offer: $81k (3.0% below list) — sets the bar for market timing.
- Cap rate 12.9% vs local median 3.9% in Kansas City — top-decile yield for the area; either an underpriced asset or a hidden risk that comps aren't pricing in. Stress-test before assuming the spread holds.
Location & tenants
- Location reads 78/100 on livability (#28 in MO, #2,671 nationally) — a middle-class / working-renter tenant base. Strengths: amenities A+, commute A+, cost of living A+; Watch: schools C-, crime F.
- Kansas City 33 (urban): math 12% / reading 24% proficiency, ranked #308 of 324 in MO (top 95%) — low school quality limits family demand, transient renter base, plan for 1-2y turnover; 75% free/reduced lunch — lower-income household profile, screen leases tightly.
- Market conditions: 21 active listings in the ZIP; 11 comparable units currently listed for rent nearby; rentals at typical pace (median 17d on market — plan ~3-4 weeks tenant-placement turnaround); 4,002 units permitted in Jackson County in 2024 (2,271 in 5+ unit buildings).
Forward outlook
- In year one you build about $9k of equity ($574 loan paydown + $8k appreciation (10.0% local appreciation)).
- Jackson County population projected at +4% by 2050 — modest demand growth; plan on rents tracking national, not racing it.
- At projected returns (10.0% appreciation + 3.0% rent growth), your $23k cash investment doubles in ~2 years — after that, you're playing with house money.
- By year 4, paydown + projected appreciation supports a ~$31k cash-out refi (75% LTV) — recoverable capital for the next deal without selling this one.
Negotiation context
- It's been on market 35 days — a 3% lower offer ($81k) is reasonable based on typical stale-listing flexibility.
- 3 sale attempts since 17y ago with the ask held roughly flat each time — persistent listings suggest the price (not the market) is what's stuck; bring a comps-based counter.
Risks & watch-outs
- Watch-outs: built in 1910 — expect roof / HVAC / electrical / plumbing capex.
Questions for the listing agent
- It's been on market 35 days. Have you received any prior offers? Is the seller open to a 3% concession, seller financing, or rate buy-down credit?
- Built in 1910 — when were the roof, HVAC, electrical panel, plumbing, and water heater last replaced?
- Is there a deadline driving the sale (1031 exchange, divorce, estate, relocation)? That informs how much negotiation room exists.
- Crime grade is F in this area — have there been break-ins, vandalism, or insurance claims at this property in the last 3 years? What carrier currently insures it and at what premium?
- What's the average days-on-market for RENTAL listings here right now (not sales)? A rising rental-DOM trend means longer vacancies and softer asking-rent achievability than the comps imply.
- What's the recent tenant-quality profile in this submarket — average credit score on applications, eviction rate, late-payment / NSF rate, and stable-employment percentage? A property-management company in the area should have these aggregated.
- How much new for-sale + rental construction is in the pipeline within 1–3 miles? Heavy new supply typically softens prices + rents 12–24 months out; constrained supply supports both.
Investment metrics
- 1% rule
- 1.48% ✓
- Cap rate
- 12.88%
- Cash-on-cash
- 23.51%
- DSCR
- 2.05
- GRM
- 5.6
CMA / ARV
- ARV (median comp)
- $103,587
- List price
- $83,000
- Delta
- -19.87%
- Verdict
- UNDERPRICED
- Comps
- 20 within 1.0 mi
Show comp detail 12 sales within ~0.75 mi
| Address | Dist | Beds/Ba | Sqft | Sold | Price | $/sf | Match |
|---|---|---|---|---|---|---|---|
| 1617 Belmont Ave | 0.28mi | 3/1.5 | 1,240 (-8%) | 7mo | $85,000 | $69 | 66 |
| 5825 E 13th St | 0.25mi | 3/1.0 | 1,471 (+9%) | 9mo | $140,000 | $95 | 65 |
| 6031 E 14th St | 0.28mi | 3/2.0 | 1,236 (-8%) | 8mo | $79,000 | $64 | 63 |
| 6216 E 11th St | 0.60mi | 3/1.0 | 1,440 (+7%) | 7mo | $75,000 | $52 | 54 |
| 1401 Belmont Ave | 0.33mi | 3/2.0 | 1,512 (+12%) | 12mo | $90,000 | $60 | 50 |
| 6625 E 16th St | 0.57mi | 4/1.0 (+1) | 1,492 (+11%) | 1mo | $160,000 | $107 | 49 |
| 812 Beacon Ave | 0.75mi | 4/1.0 (+1) | 1,400 (+4%) | 5mo | $52,000 | $37 | 49 |
| 6325 E 18th Ter | 0.45mi | 4/2.5 (+1) | 1,247 (-7%) | 10mo | $250,000 | $200 | 48 |
| 6011 E 8th St | 0.73mi | 3/1.5 | 1,250 (-7%) | 6mo | $175,000 | $140 | 47 |
| 1301 Bennington Ave | 0.58mi | 4/2.0 (+1) | 1,460 (+9%) | 8mo | $165,000 | $113 | 43 |
| 4711 E 17th St | 0.67mi | 2/1.0 (-1) | 1,155 (-14%) | 3mo | $74,000 | $64 | 38 |
| 6008 E 9th St | 0.67mi | 2/2.0 (-1) | 1,144 (-15%) | 12mo | $160,000 | $140 | 25 |
Match score weights: distance 35% · size 25% · config 20% · recency 20%. Top-matched comps best support the ARV.
Projected returns pro-forma
10.0% appreciation · 3.0% rent growth · sell at horizon
- IRR
- 41.9%
- Equity multiple
- 4.19×
- Total profit
- $74,189
- Equity at exit
- $74,773
- IRR
- 36.2%
- Equity multiple
- 9.42×
- Total profit
- $195,638
- Equity at exit
- $161,251
Cash invested: $23,240 (down + closing). Projections, not guarantees.
Landlord ↔ Tenant lean methodology
- Overall (STATE)
- 81 Strongly Landlord-Friendly
- State Missouri
- 81 Strongly Landlord-Friendly · R+10
- County
- — inherits STATE
- City
- — inherits STATE
ZIP-level market 64126
- Active inventory
- 21
- Price-to-rent
- 5.6×
Monthly cashflow live
- Estimated rent
- $1,232 high interval (Pro) →
- Mortgage (P&I)
- −$435
- Tax from tax record
- −$48 /mo · $578/yr
- Insurance
- −$35
- HOA
- −$0
- Vacancy / Maint / Mgmt
- −$259
- Net cashflow
- $455
Break-even live
UW: 25.0% down · 7.5% · 30yr · 1.5% tax · 5.0% vac · 8.0% maint · 8.0% mgmt
Financing live
Cash to close
- Down payment
- $20,750
- Closing costs
- $2,490
- Reserves months
- —
- Total cash needed
- —
Loan-product check · same deal, 3 products live
Conventional
25% down · 7.5% · 30yr
- Down + closing
- —
- Monthly P&I
- —
- Monthly cashflow
- —
- DSCR
- —
- Eligible?
- —
Personal DTI + credit; lowest rate.
DSCR
20% down · 8.5% · 30yr
- Down + closing
- —
- Monthly P&I
- —
- Monthly cashflow
- —
- DSCR
- —
- Eligible?
- —
No personal income docs; deal must DSCR.
Hard money
10% down · 12.0% · 12mo
- Down + closing
- —
- Monthly P&I
- —
- Monthly cashflow
- —
- DSCR
- —
- Eligible?
- —
Short-term bridge; refi at stabilization.
Rent comps 11 comps
| Address | Beds | Baths | Sqft | Rent | $/sqft | DOM | Units | Dist |
|---|---|---|---|---|---|---|---|---|
| 5852 E 20th St Unit TOP-1724 Kansas City, MO | 3.0 | 1.5 | 1482 | $1,075 | $0.73 | 3d | 1 | 0.37mi |
| 6237 E 12th St Kansas City, MO | 2.0 | 1.0 | 1580 | $1,150 | $0.73 | 44d | 1 | 0.51mi |
| 6011 E 11th St Kansas City, MO | 3.0 | 1.0 | 900 | $1,200 | $1.33 | 16d | 1 | 0.55mi |
| 1603 Elmwood Ave Kansas City, MO | 2.0 | 1.0 | 1064 | $1,031 | $0.97 | 12d | 1 | 0.74mi |
| 1812 Elmwood Ave Kansas City, MO | 3.0 | 1.0 | 1650 | $1,600 | $0.97 | 16d | 1 | 0.79mi |
| 1905 Kensington Ave Kansas City, MO | 3.0 | 2.0 | 1285 | $1,325 | $1.03 | 24d | 1 | 0.90mi |
| 815 Elmwood Ave Kansas City, MO | 3.0 | 1.5 | 1302 | $1,600 | $1.23 | 14d | 1 | 0.99mi |
| 1805 Jackson Ave Kansas City, MO | 4.0 | 2.0 | 1250 | $1,250 | $1.00 | 44d | 1 | 0.99mi |
| 303 White Ave Unit 2 Kansas City, MO | 2.0 | 1.0 | 1060 | $950 | $0.90 | 10d | 1 | 1.27mi |
| 135 Lawndale Ave Kansas City, MO | 3.0 | 2.0 | 920 | $1,500 | $1.63 | 7d | 1 | 1.31mi |
| 2424 Norton Ave Unit B Kansas City, MO | 3.0 | 1.0 | 982 | $1,150 | $1.17 | 16d | 1 | 1.32mi |
Listing history 22 events
-
2026-06-18days on market $83,000 Active 35 DOM
-
2026-06-17days on market $83,000 Active 34 DOM
-
2026-06-16days on market $83,000 Active 33 DOM
-
2026-06-15days on market $83,000 Active 32 DOM
-
2026-06-13days on market $83,000 Active 30 DOM
-
2026-06-09days on market $83,000 Active 26 DOM
-
2026-06-08days on market $83,000 Active 25 DOM
-
2026-06-07days on market $83,000 Active 24 DOM
-
2026-06-05days on market $83,000 Active 21 DOM
-
2026-06-03days on market $83,000 Active 20 DOM
-
2026-06-02days on market $83,000 Active 19 DOM
-
2026-06-01days on market $83,000 Active 18 DOM
-
2026-05-31days on market $83,000 Active 17 DOM
-
2026-05-15$83,000 Active 696-char remark
-
2026-05-15historical $83,000 696-char remark
-
2025-09-30historical
-
2025-06-20price $90,000
-
2025-04-10$93,000 Active
-
2009-06-24soldstatus
Show marketing remark (153 chars)
SELLING "AS IS" - NO SELLER'S DISCLOSURES. Minimum $1000 certified earnest deposit. Need pre-approval/proof of funds submitted with all offers.
-
2009-03-26$18,900
Show marketing remark (153 chars)
SELLING "AS IS" - NO SELLER'S DISCLOSURES. Minimum $1000 certified earnest deposit. Need pre-approval/proof of funds submitted with all offers.
-
2007-09-20soldstatus
-
1990-03-06soldstatus
ⓘ Source: listings_history table (triggers on properties + properties_extension) + one-shot
backfill from property_details.listing_events for pre-trigger history.
Tax reassessment forecast MO · Resets to sale price
- Current annual tax
- $578 · $48/mo
- Projected year-2 tax
- $805 · $67/mo
- Expected delta
- +$227/yr (+$19/mo · 39.3%)
ⓘ Screening estimate from a state-policy table — verify with the county assessor before closing.
Climate risk First Street
- Flood 1/10 Low FEMA zone X (unshaded) · 0% chance over 30 yrs
- Wildfire 1/10 Low
- Heat 4/10 Moderate 7 d/yr ≥106°F today · 17 d/yr by 30 yrs out
- Wind 2/10 Low
- Air quality 3/10 Moderate 2 unhealthy d/yr today · 3 by 30 yrs out
Nearby sold comps map
Loading sold comps map…
Walkable amenities ~0.75 mi
Loading nearby amenities…
Taxation est. · year 1
- Rental income
- $14,785
- − Mortgage interest
- −$4,649
- − Property taxes
- −$578
- − Insurance
- −$415
- − Repairs & maintenance
- −$1,183
- − Management
- −$1,183
- − Depreciation
- −$2,415
- Taxable income
- $4,363
- Est. tax owed @ 24.0%
- −$1,047
- After-tax cash flow
- $4,417/yr
For passive investors: Depreciation is non-cash, so a rental often shows a tax loss while cash-flowing — sheltering income. Rental losses are passive: they offset passive income freely, and up to $25,000/yr can offset ordinary (W-2) income if you actively participate and your MAGI is under $100k (phasing out to $0 by $150k); unused losses carry forward. On sale, claimed depreciation is recaptured at up to 25%, and gains may owe capital-gains tax (a 1031 exchange can defer both). Figures are a year-1 estimate at your 24.0% rate — not tax advice; consult a CPA.
Schools (NCES district)
- District
- Kansas City 33
- NCES district ID
- 2916400
- Math proficiency
- 12% ▼ -8.00%
- Reading proficiency
- 24% ▬ 0.00%
- Median HH income
- $35,227
- Composite
- 14.8/100
- National rank
- #9387
- State rank
- #308 of 324 in MO
Livability — Kansas City
- Score
- 78/100
- State rank
- #28
- US rank
- #2671
Category grades
Schools grade is shown separately in the Schools card above.
Census & demographics
- Census place
- Kansas City, MO
- City population
- 439,467
- Population (ZIP)
- 6,433
Population outlook (Jackson County) Hauer SSP2
- Today (2025)
- 719,589 people
- By 2030
- 731,456 · +1.6%
- By 2040
- 746,689 · +3.8%
- By 2050
- 749,289 · +4.1%
- By 2075
- 736,227 · +2.3%
- By 2100
- 668,210 · -7.1%
Race, ethnicity, and origin ACS 2023
- Neighborhood character
- Diverse neighborhood (Simpson 0.62)
- Race & ethnicity
- Hispanic / Latino 57% Two or more races 29% White 19% Black 14% Asian 3% Native American 2%
- Hispanic origin (detail)
- Mexican 38% Cuban 4%
- Common ancestry
- Slovak 2% Iranian 1% Lithuanian 1%
- Foreign-born
- 36% · Canada
- Languages at home
- 44% English-only · Spanish 50% Vietnamese 1%
Political lean MEDSL · Jackson
- 2024 margin
- D (+19.3) · D 58.9% · R 39.5% · Other 1.6%
- 2008→2024 swing
- -6.1pp toward R · 2008: 25.4pp · 2024: 19.3pp
- All cycles
- 2024: D+19.3 2020: D+22.0 2016: D+16.6 2012: D+19.0 2008: D+25.4
Not yet ingested
- Civics
- —
Market trends
- HPI YoY
- ▲ 100.10%
- Current HPI
- 369.8782
- Rent YoY
- —
- Metro
- —
- State GDP YoY
- ▲ 1.84%
- F500 in state
- 20
Industry mix (Fortune 500 HQ in MO)
| Industry | F500 HQs | Revenue |
|---|---|---|
| Healthcare | 1 | $163B |
|
||
| Insurance | 1 | $21B |
|
||
| Industrial Technology | 1 | $17B |
|
||
| Retail | 1 | $16B |
|
||
| Industrial Distribution | 1 | $10B |
|
||
| Utilities | 1 | $9B |
|
||
Price history
+339.2% since first listed9 events — show timeline
- 2026-05-15 Listed $83,000 Heartland MLS as Distributed by MLS Grid
- 2026-05-15 Coming Soon $83,000 Heartland MLS as Distributed by MLS Grid
- 2025-09-30 Listing Removed — Heartland MLS as Distributed by MLS Grid
- 2025-06-20 Price Changed $90,000 Heartland MLS as Distributed by MLS Grid
- 2025-04-10 Listed $93,000 Heartland MLS as Distributed by MLS Grid
- 2009-06-24 Sold (MLS) — Heartland MLS as Distributed by MLS Grid
- 2009-03-26 Listed $18,900 Heartland MLS as Distributed by MLS Grid
- 2007-09-20 Sold (Public Records) — Public Records
- 1990-03-06 Sold (Public Records) — Public Records
Property tax history
+2.7%/yrLatest (2025): $578 · +22.2% YoY. Source: county tax records.
Cash-flow waterfall
monthlySold comps — $/sqft
last 12 mo · ≤1 miLoading sold comps…