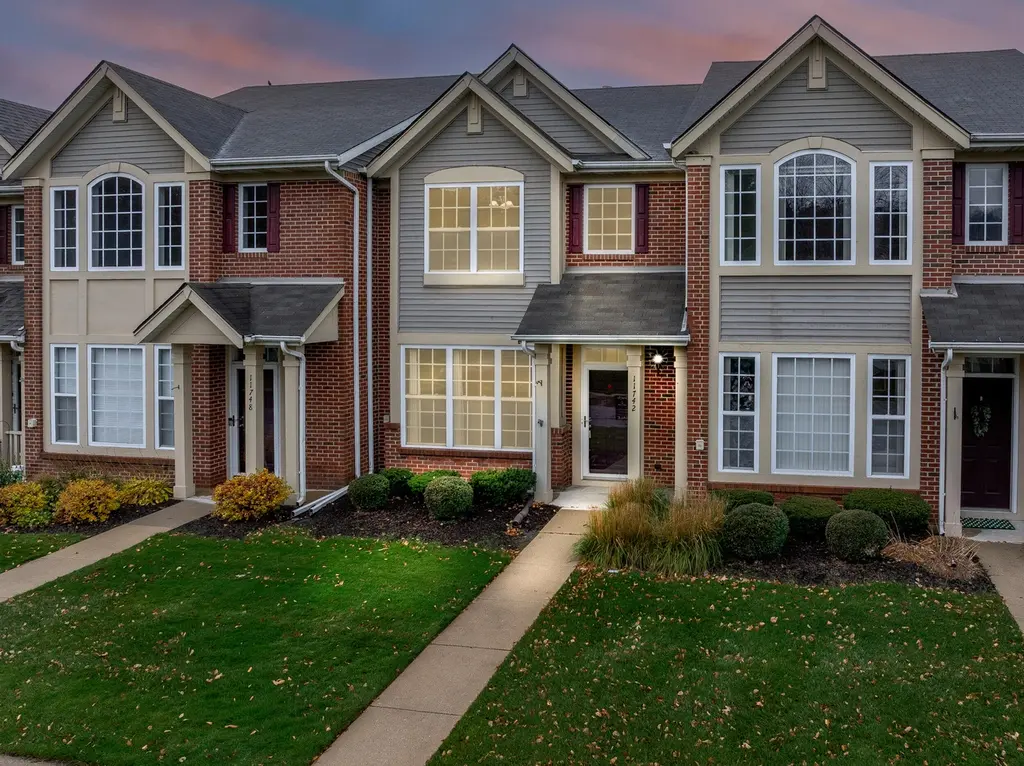
11742 Broadway · Crown Point, IN
Flood risk 1/10 · Minimal
- FEMA flood zone
- X (unshaded)
- Chance of flooding over 30 yrs
- 0.0%
- Est. flood insurance / yr
- $507 – $1,088
Fire risk 1/10 · Minimal
- Est. fire insurance / yr
- $717 – $1,331
Heat risk 3/10 · Minor
- Hot days now (above 102°F)
- 7 days/yr
- Hot days in 30 yrs
- 16 days/yr
Wind risk 2/10 · Minimal
- Chance of severe wind over 30 yrs
- —
Air-quality risk 2/10 · Minimal
- Unhealthy air days now
- 1 days/yr
- Unhealthy air days in 30 yrs
- 3 days/yr
Risk factors via First Street. Map © Google.
Why this score? — see what drove the D grade
The composite is a weighted blend of 9 inputs, each scored 0–100. Each bar is that input's sub-score; the figure is the points it added to the 100-point composite (weight × sub-score).
- ARV discount +15.0/15.0
- Cash flow +8.0/30.0
- Schools +5.0/10.0
- Livability +3.9/5.0
- Rent growth +3.1/5.0
- 1% rule +2.7/10.0
- Condition / age +2.5/5.0
- DSCR +2.0/10.0
- Appreciation +0.0/10.0
$248,000
🖨 Deal sheet (PDF) 📄 Offer letter ✓ Due diligence
Listing remarks
This beautifully maintained 2-bedroom, 1.5-bathroom home is ready to welcome you! As you step inside, you'll find a spacious living room that's ideal for entertaining guests, with large windows that bathe the area in natural light. The dining area, conveniently located adjacent to the kitchen, provides ample space for a sizable table. The kitchen is equipped with 42-inch cabinets and includes all necessary appliances, including a new dishwasher, ensuring plenty of countertop space for your culinary needs. On the main level, you'll also find a half bath, along with storage and utility closets. From the dining room, step out onto your poured concrete patio, perfect for gatherings or enjoying
Key facts
- Large windows
- Dining area
- New dishwasher
Tags
Property features AI
Finance
- Other: Vacant occupant status
- HOA & community: Homeowners association managed by First American Management; Monthly association fee of $150; HOA covers landscaping, trash, snow removal, and grounds maintenance; Association provides landscaping and snow removal
Exterior
- Parking: Detached garage with alley access and garage door opener; Garage faces rear; 2 garage spaces
- Utilities: Public water; Public sewer
- Home design: Two-story property; Attached property; Built in 2006
- Construction: Built in 2006
- Exterior features: Private yard
Interior
- Kitchen: Refrigerator; Microwave; Gas range; Dishwasher; Disposal
- Bedrooms: Primary bedroom; Bedroom 2
- Bathrooms: 2 full bathrooms; 1 half bathroom
- Heating & cooling: Central air conditioning; Forced air heating
- Interior features: Country kitchen; Neighborhood view
- Laundry & utility: Washer; Dryer
Neighborhood map
What this means for you Summary
Snapshot
- This is a 2-bed/2.0-bath townhouse listed at $248k.
Deal economics
- At list price, monthly cash flow is $-256 ($-3k/yr) — negative.
- To cash-flow at today's rent, offer at most $203k (18.2% below list).
- To meet the 1% rule (rent ≥ 1% of price), the offer needs to be $190k (23.3% below list).
- Recommended offer: $190k (23.3% below list) — sets the bar for 1% rule.
- Cap rate 5.1% vs local median 3.4% in Crown Point — top-decile yield for the area; either an underpriced asset or a hidden risk that comps aren't pricing in. Stress-test before assuming the spread holds.
Location & tenants
- Location reads 77/100 on livability (#45 in IN, #3,244 nationally) — a middle-class / working-renter tenant base. Strengths: crime A+, employment A+, cost of living A+; Watch: amenities F, commute F, health & safety D-.
- Crown Point Community School Corporation (suburban): math 51% / reading 61% proficiency, ranked #23 of 301 in IN (top 8%) — acceptable for families but not a draw, mixed tenant base, ~2y average lease; only 18% free/reduced lunch — higher-income household profile.
- Zoned schools: Solon Robinson Elementary School (math 59% / reading 57%, grade C+, #160 of 994 statewide, top 17%, 528 students, 34% FRL); Colonel John Wheeler Middle School (math 39% / reading 53%, grade D+, #76 of 330 statewide, top 23%, 1,046 students, 24% FRL); Crown Point High School (math 51% / reading 80%, grade B, #29 of 369 statewide, top 8%, 2,948 students, 22% FRL).
- Market conditions: Rents rising (+2.5%/yr); 753 active listings in the ZIP; 7 comparable units currently listed for rent nearby; rentals leasing fast (median 5d on market — plan ~1-2 weeks tenant-placement turnaround); solid renter incomes; 1,642 units permitted in Lake County in 2024 (14 in 5+ unit buildings).
Forward outlook
- Local home prices are declining (-3.0%/yr); year-one equity from $2k of loan paydown is wiped out by about $7k of value loss. Plan a longer hold.
- Lake County population projected to shrink 7% by 2050 — rents likely to lag national; underwrite the cash flow, not the appreciation.
Negotiation context
- It's been on market 17 days — a 2% lower offer ($244k) is reasonable based on typical stale-listing flexibility.
- 8 sale attempts since 19y ago with the ask held roughly flat each time — persistent listings suggest the price (not the market) is what's stuck; bring a comps-based counter.
Questions for the listing agent
- What do current leases actually rent for vs. the listed asking? Can we see a recent rent roll and the last 12 months of T-12 income?
- What does the HOA fee cover, when was the last increase, and are there any pending special assessments or reserve-fund shortfalls?
- Is there a deadline driving the sale (1031 exchange, divorce, estate, relocation)? That informs how much negotiation room exists.
- Schools are B-rated — typically a magnet for longer-tenancy family renters. What's the average tenant stay here, and is there a school-zone premium baked into asking?
- The area grade is low — what's the realistic commute time and amenity access for the typical tenant pool here? Any planned neighborhood developments (good or bad) we should know about?
- What's the average days-on-market for RENTAL listings here right now (not sales)? A rising rental-DOM trend means longer vacancies and softer asking-rent achievability than the comps imply.
- What's the recent tenant-quality profile in this submarket — average credit score on applications, eviction rate, late-payment / NSF rate, and stable-employment percentage? A property-management company in the area should have these aggregated.
- How much new for-sale + rental construction is in the pipeline within 1–3 miles? Heavy new supply typically softens prices + rents 12–24 months out; constrained supply supports both.
Investment metrics
- 1% rule
- 0.77% ✗
- Cap rate
- 5.06%
- Cash-on-cash
- -4.42%
- DSCR
- 0.80
- GRM
- 10.9
CMA / ARV
- ARV (median comp)
- $349,188
- List price
- $248,000
- Delta
- -28.98%
- Verdict
- UNDERPRICED
- Comps
- 20 within 1.0 mi
Show comp detail 12 sales within ~0.75 mi
| Address | Dist | Beds/Ba | Sqft | Sold | Price | $/sf | Match |
|---|---|---|---|---|---|---|---|
| 11828 Broadway | 0.10mi | 2/1.5 | 1,380 (0%) | 2mo | $240,000 | $174 | 92 |
| 11610 Broadway | 0.15mi | 3/2.0 (+1) | 1,380 (0%) | 3mo | $265,000 | $192 | 86 |
| 11792 Rhode Island St | 0.56mi | 2/2.0 | 1,377 (-0%) | 3mo | $300,000 | $218 | 71 |
| 11897 Rhode Island St | 0.62mi | 2/1.5 | 1,408 (+2%) | 2mo | $279,900 | $199 | 64 |
| 1003 E 117th Ln | 0.66mi | 2/1.5 | 1,356 (-2%) | 1mo | $289,900 | $214 | 63 |
| 1023 E 117th Ln | 0.67mi | 2/1.5 | 1,408 (+2%) | 4mo | $280,000 | $199 | 60 |
| 11886 Kentucky St | 0.69mi | 3/2.0 (+1) | 1,414 (+2%) | 0mo | $299,900 | $212 | 58 |
| 11803 Rhode Island St | 0.60mi | 2/2.0 | 1,484 (+8%) | 3mo | $273,000 | $184 | 57 |
| 1818 Golden Oak Ct | 0.66mi | 3/2.0 (+1) | 1,280 (-7%) | 0mo | $235,000 | $184 | 52 |
| 1053 E 117th Ln | 0.68mi | 2/2.0 | 1,497 (+8%) | 4mo | $273,000 | $182 | 50 |
| 11789 Kentucky St | 0.71mi | 2/1.5 | 1,222 (-11%) | 0mo | $259,000 | $212 | 45 |
| 970 E 114th Pl | 0.69mi | 2/1.5 | 1,240 (-10%) | 5mo | $230,200 | $186 | 45 |
Match score weights: distance 35% · size 25% · config 20% · recency 20%. Top-matched comps best support the ARV.
Projected returns pro-forma
-3.0% appreciation · 2.53% rent growth · sell at horizon
- IRR
- -24.3%
- Equity multiple
- 0.17×
- Total profit
- $-57,316
- Equity at exit
- $36,978
- IRR
- -21.0%
- Equity multiple
- -0.07×
- Total profit
- $-74,298
- Equity at exit
- $21,443
Cash invested: $69,440 (down + closing). Projections, not guarantees.
Landlord ↔ Tenant lean methodology
- Overall (STATE)
- 90 Strongly Landlord-Friendly
- State Indiana
- 90 Strongly Landlord-Friendly · R+11
- County
- — inherits STATE
- City
- — inherits STATE
ZIP-level market 46307
- Rents YoY
- 2.5%
- Active inventory
- 753
- Price-to-rent
- 10.9×
Monthly cashflow live
- Estimated rent
- $1,902 high interval (Pro) →
- Mortgage (P&I)
- −$1,301
- Tax from tax record
- −$204 /mo · $2,451/yr
- Insurance
- −$103
- HOA
- −$150
- Vacancy / Maint / Mgmt
- −$399
- Net cashflow
- $-256
Break-even live
Sensitivity live
| Price | -10% $-115 | -5% $-186 | +0% $-256 | +5% $-326 | +10% $-396 |
|---|---|---|---|---|---|
| Rent | -10% $-406 | -5% $-331 | +0% $-256 | +5% $-181 | +10% $-106 |
| Rate | -1.0pp $-131 | -0.5pp $-193 | base $-256 | +0.5pp $-320 | +1.0pp $-385 |
UW: 25.0% down · 7.5% · 30yr · 1.5% tax · 5.0% vac · 8.0% maint · 8.0% mgmt
Financing live
Cash to close
- Down payment
- $62,000
- Closing costs
- $7,440
- Reserves months
- —
- Total cash needed
- —
Loan-product check · same deal, 3 products live
Conventional
25% down · 7.5% · 30yr
- Down + closing
- —
- Monthly P&I
- —
- Monthly cashflow
- —
- DSCR
- —
- Eligible?
- —
Personal DTI + credit; lowest rate.
DSCR
20% down · 8.5% · 30yr
- Down + closing
- —
- Monthly P&I
- —
- Monthly cashflow
- —
- DSCR
- —
- Eligible?
- —
No personal income docs; deal must DSCR.
Hard money
10% down · 12.0% · 12mo
- Down + closing
- —
- Monthly P&I
- —
- Monthly cashflow
- —
- DSCR
- —
- Eligible?
- —
Short-term bridge; refi at stabilization.
Rent comps 7 comps
| Address | Beds | Baths | Sqft | Rent | $/sqft | DOM | Units | Dist |
|---|---|---|---|---|---|---|---|---|
| 396 Golden Oak Ct Crown Point, IN | 3.0 | 2.0 | 1670 | $2,300 | $1.38 | 0d | 1 | 0.63mi |
| 930 Cypress Point Dr Crown Point, IN | 1.0–2.0 | 1.0 | 900 | $1,729 | $1.92 | 0d | 10 | 0.91mi |
| 928 Heritage Ct Unit 928-101 Crown Point, IN | 2.0 | 1.0 | 1000 | $1,525 | $1.52 | 4d | 1 | 1.02mi |
| 918 Heritage Ct Unit 918-102 Crown Point, IN | 2.0 | 1.0 | 1000 | $1,550 | $1.55 | 6d | 1 | 1.04mi |
| 905 Heritage Ct Unit 905-204 Crown Point, IN | 2.0 | 1.0 | 1000 | $1,450 | $1.45 | 6d | 1 | 1.05mi |
| 484 E 127th Ave Crown Point, IN | 2.0–3.0 | 2.0–2.5 | 1544 | $2,506 | $1.62 | 0d | 20 | 1.24mi |
| 625 E South St Crown Point, IN | 3.0 | 2.0 | 1700 | $2,400 | $1.41 | 9d | 1 | 1.25mi |
HOA detail
- Monthly dues
- $150 · $1,800/yr
Listing history 29 events
-
2026-06-21days on market $248,000 Active 17 DOM
-
2026-06-18days on market $248,000 Active 14 DOM
-
2026-06-17days on market $248,000 Active 13 DOM
-
2026-06-16days on market $248,000 Active 12 DOM
-
2026-06-15days on market $248,000 Active 11 DOM
-
2026-06-13days on market $248,000 Active 9 DOM
-
2026-06-13days on market $248,000 Active 8 DOM
-
2026-06-09days on market $248,000 Active 5 DOM
-
2026-06-08days on market $248,000 Active 4 DOM
-
2026-06-07days on market $248,000 Active 3 DOM
-
2026-05-31days on market $248,000 Active 115 DOM
-
2026-04-25price $250,000 1257-char remark
-
2026-03-05price $255,000 1257-char remark
-
2026-02-05$260,000 Active 1257-char remark
-
2026-02-01historical
-
2025-12-04price $261,500
-
2025-11-26price $262,500
-
2025-11-20$264,000 Active
-
2023-11-20soldstatus $237,000 Closed
-
2023-10-17historical Active Under Contract
-
2023-10-03$237,000 Active
-
2022-04-15soldstatus $215,000 Closed
-
2022-03-02status Pending
-
2022-03-02price $225,000
-
2022-03-01$220,000 Active
-
2009-06-02$135,000
-
2008-04-03historical
-
2007-09-25$159,000
-
2007-06-18$159,000
ⓘ Source: listings_history table (triggers on properties + properties_extension) + one-shot
backfill from property_details.listing_events for pre-trigger history.
Tax reassessment forecast IN · Partial reset (capped growth)
- Current annual tax
- $2,451 · $204/mo
- Projected year-2 tax
- $2,451 · $204/mo
- Expected delta
- $0/yr ($0/mo · 0.0%)
ⓘ Screening estimate from a state-policy table — verify with the county assessor before closing.
Climate risk First Street
- Flood 1/10 Low FEMA zone X (unshaded) · 0% chance over 30 yrs
- Wildfire 1/10 Low
- Heat 3/10 Moderate 7 d/yr ≥102°F today · 16 d/yr by 30 yrs out
- Wind 2/10 Low
- Air quality 2/10 Low 1 unhealthy d/yr today · 3 by 30 yrs out
Nearby sold comps map
Loading sold comps map…
Walkable amenities ~0.75 mi
Loading nearby amenities…
Taxation est. · year 1
- Rental income
- $22,820
- − Mortgage interest
- −$13,892
- − Property taxes
- −$2,451
- − Insurance
- −$1,240
- − Repairs & maintenance
- −$1,826
- − Management
- −$1,826
- − HOA
- −$1,800
- − Depreciation
- −$7,215
- Taxable loss
- −$7,428
- Est. tax savings @ 24.0%
- +$1,783
- After-tax cash flow
- $-1,287/yr
For passive investors: Depreciation is non-cash, so a rental often shows a tax loss while cash-flowing — sheltering income. Rental losses are passive: they offset passive income freely, and up to $25,000/yr can offset ordinary (W-2) income if you actively participate and your MAGI is under $100k (phasing out to $0 by $150k); unused losses carry forward. On sale, claimed depreciation is recaptured at up to 25%, and gains may owe capital-gains tax (a 1031 exchange can defer both). Figures are a year-1 estimate at your 24.0% rate — not tax advice; consult a CPA.
Schools (NCES district)
- District
- Crown Point Community School Corporation
- NCES district ID
- 1802490
- Math proficiency
- 51% ▼ -9.00%
- Reading proficiency
- 61% ▼ -8.00%
- Median HH income
- $69,148
- Composite
- 49.55/100
- National rank
- #1990
- State rank
- #23 of 301 in IN
Livability — Crown Point
- Score
- 77/100
- State rank
- #45
- US rank
- #3244
Category grades
Schools grade is shown separately in the Schools card above.
Census & demographics
- Census place
- Crown Point, IN
- County
- Lake County · 422,878 people
- City population
- 71,673
- Metro
- Chicago-Naperville-Elgin, IL-IN-WI
- Population (ZIP)
- 71,673
- Household income
- $107,800
- Rent vs Own
- Severe rent burden
- 705.0
Population outlook (Lake County) Hauer SSP2
- Today (2025)
- 484,026 people
- By 2030
- 478,091 · -1.2%
- By 2040
- 462,974 · -4.3%
- By 2050
- 449,894 · -7.1%
- By 2075
- 436,169 · -9.9%
- By 2100
- 426,607 · -11.9%
Race, ethnicity, and origin ACS 2023
- Neighborhood character
- Predominantly White (76%)
- Race & ethnicity
- White 76% Hispanic / Latino 12% Two or more races 10% Black 7% Asian 2%
- Hispanic origin (detail)
- Mexican 9% Puerto Rican 1%
- Common ancestry
- Romanian 12% Iranian 3% Lithuanian 2%
- Foreign-born
- 7% · Canada, Vietnam
- Languages at home
- 88% English-only · Spanish 5% Russian/Polish/Slavic 3% Other Indo-European 1%
Political lean MEDSL · Lake
- 2024 margin
- Lean D (+5.6) · D 52.1% · R 46.5% · Other 1.5%
- 2008→2024 swing
- -28.6pp toward R · 2008: 34.3pp · 2024: 5.6pp
- All cycles
- 2024: D+5.6 2020: D+15.1 2016: D+20.6 2012: D+31.0 2008: D+34.3
Not yet ingested
- Civics
- —
Market trends
- HPI YoY
- ▼ -164.91%
- Current HPI
- 226.0335
- Rent YoY
- ▲ 2.53%
- Metro
- Chicago-Naperville-Elgin, IL-IN-WI
- State GDP YoY
- ▲ 2.90%
- F500 in state
- 18
Industry mix (Fortune 500 HQ in IN)
| Industry | F500 HQs | Revenue |
|---|---|---|
| Industrial Machinery | 2 | $37B |
|
||
| Healthcare | 1 | $177B |
|
||
| Pharmaceuticals | 1 | $45B |
|
||
| Metals / Steel | 1 | $18B |
|
||
| Agriculture | 1 | $17B |
|
||
| Packaging | 1 | $12B |
|
||
Price history
+56.0% since first listed21 events — show timeline
- 2026-06-04 Listed $248,000 NIRA MLS as Distributed by MLS Grid
- 2026-06-01 Listing Removed — NIRA MLS as Distributed by MLS Grid
- 2026-05-26 Price Changed $248,000 NIRA MLS as Distributed by MLS Grid
- 2026-04-25 Price Changed $250,000 NIRA MLS as Distributed by MLS Grid
- 2026-03-05 Price Changed $255,000 NIRA MLS as Distributed by MLS Grid
- 2026-02-05 Listed $260,000 NIRA MLS as Distributed by MLS Grid
- 2026-02-01 Listing Removed — NIRA MLS as Distributed by MLS Grid
- 2025-12-04 Price Changed $261,500 NIRA MLS as Distributed by MLS Grid
- 2025-11-26 Price Changed $262,500 NIRA MLS as Distributed by MLS Grid
- 2025-11-20 Listed $264,000 NIRA MLS as Distributed by MLS Grid
- 2023-11-20 Sold (MLS) $237,000 NIRA MLS as Distributed by MLS Grid
- 2023-10-17 Contingent — NIRA MLS as Distributed by MLS Grid
- 2023-10-03 Listed $237,000 NIRA MLS as Distributed by MLS Grid
- 2022-04-15 Sold (MLS) $215,000 NIRA MLS as Distributed by MLS Grid
- 2022-03-02 Pending — NIRA MLS as Distributed by MLS Grid
- 2022-03-02 Price Changed $225,000 NIRA MLS as Distributed by MLS Grid
- 2022-03-01 Listed $220,000 NIRA MLS as Distributed by MLS Grid
- 2009-06-02 Listed $135,000 NIRA MLS as Distributed by MLS Grid
- 2008-04-03 Listing Removed — NIRA MLS as Distributed by MLS Grid
- 2007-09-25 Listed $159,000 NIRA MLS as Distributed by MLS Grid
- 2007-06-18 Listed $159,000 NIRA MLS as Distributed by MLS Grid
Property tax history
+5.0%/yrLatest (2024): $2,451 · +9.0% YoY. Source: county tax records.
Cash-flow waterfall
monthlySold comps — $/sqft
last 12 mo · ≤1 miLoading sold comps…