2292 N Ironwood Dr #40 · Apache Junction, AZ
Flood risk 1/10 · Minimal
- FEMA flood zone
- X (shaded)
- Chance of flooding over 30 yrs
- 0.0%
- Est. flood insurance / yr
- $507 – $1,088
Fire risk 6/10 · Moderate
- Est. fire insurance / yr
- $610 – $1,132
Heat risk 8/10 · Major
- Hot days now (above 111°F)
- 6 days/yr
- Hot days in 30 yrs
- 16 days/yr
Wind risk 1/10 · Minimal
- Chance of severe wind over 30 yrs
- —
Air-quality risk 3/10 · Minor
- Unhealthy air days now
- 2 days/yr
- Unhealthy air days in 30 yrs
- 3 days/yr
Risk factors via First Street. Map © Google.
Why this score? — see what drove the B grade
The composite is a weighted blend of 9 inputs, each scored 0–100. Each bar is that input's sub-score; the figure is the points it added to the 100-point composite (weight × sub-score).
- Cash flow +30.0/30.0
- ARV discount +11.6/15.0
- 1% rule +10.0/10.0
- DSCR +10.0/10.0
- Condition / age +4.0/5.0
- Livability +3.3/5.0
- Rent growth +1.6/5.0
- Schools +1.5/10.0
- Appreciation +0.0/10.0
$55,000
🖨 Deal sheet (PDF) 📄 Offer letter ✓ Due diligence
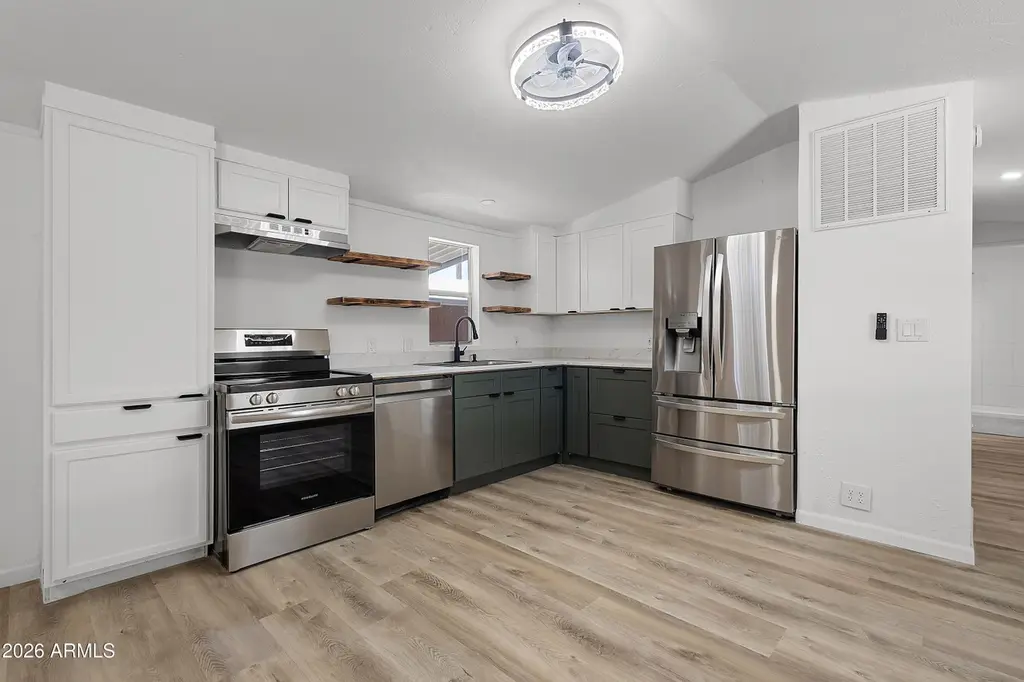
Listing remarks
Beautifully remodeled 2 bed, 2 bath mobile home in Windsong Mobile Home Park. Enjoy community amenities including a pool and clubhouse. This home features fresh interior and exterior paint, laminate wood floors throughout, new kitchen countertops, updated fixtures and hardware, new appliances, AC Unit less than 5 years old. The spacious primary suite offers a great walk-in closet and a large walk-in shower. Move-in ready and full of modern touches and a fences backyard with an amazing mountain view.
Key facts
- Parking
- Community pool
- Built 2000
Property features AI
Finance
- Other: Directions: South on Ironwood, right into Windsong Mobile Home Park
- HOA & community: Land lease community (monthly land lease $715); Association fees include insurance, street maintenance, trash, and water; Community pool; Community spa; Biking/walking path
Exterior
- Parking: 1 covered parking space; 1 carport space
- Utilities: City water; Public sewer
- Home design: Manufactured / Mobile home; Leasehold ownership; Mountain views
- Construction: Vinyl siding; Steel frame construction; Building area reported by builder
- Exterior features: Gravel/stone front yard; Gravel/stone back yard; Chain link fencing; Composition roof
Interior
- Kitchen: Non-laminate counters; Pantry; Refrigerator, Dishwasher, Disposal
- Bedrooms: 2 possible bedrooms
- Flooring: Vinyl
- Bathrooms: 2 full bathrooms
- Heating & cooling: Electric heating; Central air; Ceiling fans
- Interior features: High-speed internet; 9+ foot flat ceilings; Vaulted ceilings; Pantry; Full bathroom in primary bedroom; Refrigerator, Dishwasher, Disposal
- Laundry & utility: Laundry inside
Neighborhood map
What this means for you Summary
Snapshot
- This is a 2-bed/2.0-bath manufactured listed at $55k. Condition is rated good.
Deal economics
- At list price, monthly cash flow is $548 ($7k/yr) — positive.
- The deal already cash-flows at list — no discount required.
- Meets the 1% rule at list price ($1k rent vs $55k).
- Recommended offer: $53k (3.0% below list) — sets the bar for market timing.
- Cap rate 18.3% vs local median 3.5% in Apache Junction — top-decile yield for the area; either an underpriced asset or a hidden risk that comps aren't pricing in. Stress-test before assuming the spread holds.
Location & tenants
- Location reads 66/100 on livability (#70 in AZ) — a middle-class / working-renter tenant base. Strengths: cost of living A+, housing A+; Watch: crime D+, amenities F, commute F.
- Apache Junction Unified District (4443) (suburban): math 15% / reading 20% proficiency, ranked #195 of 249 in AZ (top 78%) — low school quality limits family demand, transient renter base, plan for 1-2y turnover.
- Zoned schools: Desert Vista Elementary School (math 18% / reading 23%, grade F, #729 of 1,109 statewide, top 67%, 536 students, 50% FRL); Cactus Canyon Junior High (math 14% / reading 19%, grade F, #151 of 218 statewide, top 70%, 702 students, 50% FRL); Apache Junction High School (math 12% / reading 17%, grade F, #267 of 381 statewide, top 72%, 999 students, 48% FRL) — zoned schools at 49% FRL track the district average.
- Market conditions: Rents falling (-3.5%/yr); 468 active listings in the ZIP; 5 comparable units currently listed for rent nearby; rentals at typical pace (median 26d on market — plan ~3-4 weeks tenant-placement turnaround); 9,504 units permitted in Pinal County in 2024 (776 in 5+ unit buildings).
Forward outlook
- Local home prices are declining (-3.0%/yr); year-one equity from $380 of loan paydown is wiped out by about $2k of value loss. Plan a longer hold.
- At projected returns (-3.0% appreciation + 0.0% rent growth), your $15k cash investment doubles in ~3 years — after that, you're playing with house money.
Negotiation context
- It's been on market 54 days — a 3% lower offer ($53k) is reasonable based on typical stale-listing flexibility.
Risks & watch-outs
- Climate carrying-cost: major wildfire risk; extreme-heat days projected 6→16/yr by 2055 (HVAC capex compounding) — expect insurance premiums to compound above CPI over the hold.
Questions for the listing agent
- It's been on market 54 days. Have you received any prior offers? Is the seller open to a 3% concession, seller financing, or rate buy-down credit?
- Is there a deadline driving the sale (1031 exchange, divorce, estate, relocation)? That informs how much negotiation room exists.
- Schools are F-rated, which usually means shorter tenancies and higher turnover. Who's the typical renter profile here, and what's been the actual vacancy rate?
- Crime grade is D in this area — have there been break-ins, vandalism, or insurance claims at this property in the last 3 years? What carrier currently insures it and at what premium?
- What's the average days-on-market for RENTAL listings here right now (not sales)? A rising rental-DOM trend means longer vacancies and softer asking-rent achievability than the comps imply.
- What's the recent tenant-quality profile in this submarket — average credit score on applications, eviction rate, late-payment / NSF rate, and stable-employment percentage? A property-management company in the area should have these aggregated.
- How much new for-sale + rental construction is in the pipeline within 1–3 miles? Heavy new supply typically softens prices + rents 12–24 months out; constrained supply supports both.
Investment metrics
- 1% rule
- 2.14% ✓
- Cap rate
- 18.25%
- Cash-on-cash
- 42.72%
- DSCR
- 2.90
- GRM
- 3.9
CMA / ARV
- ARV (on-the-fly)
- $60,480
- Comps found
- 12
Show comp detail 12 sales within ~0.75 mi
| Address | Dist | Beds/Ba | Sqft | Sold | Price | $/sf | Match |
|---|---|---|---|---|---|---|---|
| 2292 N Ironwood Dr #55 | 0.00mi | 2/2.0 | 960 (0%) | 3mo | $57,000 | $59 | 97 |
| 2292 N Ironwood Dr #110 | 0.02mi | 3/2.0 (+1) | 960 (0%) | 0mo | $67,000 | $70 | 94 |
| 2292 N Ironwood Dr #78 | 0.00mi | 3/2.0 (+1) | 960 (0%) | 4mo | $60,000 | $63 | 92 |
| 2292 N Ironwood Dr #56 | 0.08mi | 3/2.0 (+1) | 960 (0%) | 2mo | $59,000 | $61 | 89 |
| 2292 N Ironwood Dr #84 | 0.00mi | 2/2.0 | 1,024 (+7%) | 3mo | $25,000 | $24 | 86 |
| 2292 N Ironwood Dr #103 | 0.12mi | 2/2.0 | 1,008 (+5%) | 5mo | $18,000 | $18 | 82 |
| 2292 N Ironwood Dr #34 | 0.12mi | 3/2.0 (+1) | 1,024 (+7%) | 5mo | $60,000 | $59 | 74 |
| 2292 N Ironwood Dr #41 | 0.12mi | 2/2.0 | 1,080 (+12%) | 3mo | $16,000 | $15 | 71 |
| 1784 N Main Dr | 0.33mi | 2/1.0 | 833 (-13%) | 4mo | $249,995 | $300 | 55 |
| 2200 N Delaware Dr #62 | 0.40mi | 3/2.0 (+1) | 1,100 (+15%) | 2mo | $75,000 | $68 | 50 |
| 1644 N Desert View Dr N | 0.63mi | 2/2.0 | 846 (-12%) | 7mo | $271,500 | $321 | 45 |
| 875 W Smoketree St | 0.67mi | 2/2.0 | 1,080 (+12%) | 7mo | $337,000 | $312 | 42 |
Match score weights: distance 35% · size 25% · config 20% · recency 20%. Top-matched comps best support the ARV.
Projected returns pro-forma
-3.0% appreciation · 0.0% rent growth · sell at horizon
- IRR
- 36.0%
- Equity multiple
- 2.47×
- Total profit
- $22,577
- Equity at exit
- $8,201
- IRR
- 41.2%
- Equity multiple
- 4.34×
- Total profit
- $51,383
- Equity at exit
- $4,755
Cash invested: $15,400 (down + closing). Projections, not guarantees.
Landlord ↔ Tenant lean methodology
- Overall (STATE)
- 87 Strongly Landlord-Friendly
- State Arizona
- 87 Strongly Landlord-Friendly · R+3
- County
- — inherits STATE
- City
- — inherits STATE
ZIP-level market 85120
- Home prices YoY
- -29.0%
- Rents YoY
- -3.5%
- Active inventory
- 468
- Price-to-rent
- 3.9×
Monthly cashflow live
- Estimated rent
- $1,175 high interval (Pro) →
- Mortgage (P&I)
- −$288
- Tax est. 1.5%
- −$69 /mo · $825/yr
- Insurance
- −$23
- HOA
- −$0
- Lot rent leased land?
- −$0
- Vacancy / Maint / Mgmt
- −$247
- Net cashflow
- $548
Break-even live
Sensitivity live
| Price | -10% $586 | -5% $567 | +0% $548 | +5% $529 | +10% $510 |
|---|---|---|---|---|---|
| Rent | -10% $455 | -5% $502 | +0% $548 | +5% $595 | +10% $641 |
| Rate | -1.0pp $576 | -0.5pp $562 | base $548 | +0.5pp $534 | +1.0pp $519 |
UW: 25.0% down · 7.5% · 30yr · 1.5% tax · 5.0% vac · 8.0% maint · 8.0% mgmt
Financing live
Cash to close
- Down payment
- $13,750
- Closing costs
- $1,650
- Reserves months
- —
- Total cash needed
- —
Loan-product check · same deal, 3 products live
Conventional
25% down · 7.5% · 30yr
- Down + closing
- —
- Monthly P&I
- —
- Monthly cashflow
- —
- DSCR
- —
- Eligible?
- —
Personal DTI + credit; lowest rate.
DSCR
20% down · 8.5% · 30yr
- Down + closing
- —
- Monthly P&I
- —
- Monthly cashflow
- —
- DSCR
- —
- Eligible?
- —
No personal income docs; deal must DSCR.
Hard money
10% down · 12.0% · 12mo
- Down + closing
- —
- Monthly P&I
- —
- Monthly cashflow
- —
- DSCR
- —
- Eligible?
- —
Short-term bridge; refi at stabilization.
Rent comps 5 comps
| Address | Beds | Baths | Sqft | Rent | $/sqft | DOM | Units | Dist |
|---|---|---|---|---|---|---|---|---|
| 2185 W Ohio St Apache Junction, AZ | 2.0 | 1.0 | 1000 | $1,295 | $1.29 | 6d | 1 | 1.10mi |
| 455 N Delaware Dr Unit 7 Apache Junction, AZ | 2.0 | 2.0 | 1060 | $1,900 | $1.79 | 26d | 1 | 1.17mi |
| 1440 N Idaho Rd Apache Junction, AZ | 1.0–2.0 | 1.0–1.5 | 1010 | $1,900 | $1.88 | 26d | 3 | 1.24mi |
| 135 N Palo Verde Dr Apache Junction, AZ | 1.0 | 1.0 | 750 | $915 | $1.22 | 22d | 1 | 1.36mi |
| 135 N Palo Verde Dr Unit 8 Apache Junction, AZ | 1.0 | 1.0 | 750 | $925 | $1.23 | 26d | 1 | 1.36mi |
Listing history 17 events
-
2026-06-22days on market $55,000 Active 54 DOM
-
2026-06-21days on market $55,000 Active 53 DOM
-
2026-06-18days on market $55,000 Active 50 DOM
-
2026-06-17days on market $55,000 Active 49 DOM
-
2026-06-16days on market $55,000 Active 48 DOM
-
2026-06-15days on market $55,000 Active 47 DOM
-
2026-06-13days on market $55,000 Active 45 DOM
-
2026-06-09days on market $55,000 Active 41 DOM
-
2026-06-08days on market $55,000 Active 40 DOM
-
2026-06-07days on market $55,000 Active 39 DOM
-
2026-06-04days on market $55,000 Active 36 DOM
-
2026-06-03days on market $55,000 Active 35 DOM
-
2026-06-02days on market $55,000 Active 34 DOM
-
2026-06-01days on market $55,000 Active 33 DOM
-
2026-05-31days on market $55,000 Active 32 DOM
-
2026-05-22price $55,000
-
2026-04-29$57,200 Active
ⓘ Source: listings_history table (triggers on properties + properties_extension) + one-shot
backfill from property_details.listing_events for pre-trigger history.
Climate risk First Street
- Flood 1/10 Low FEMA zone X (shaded) · 0% chance over 30 yrs
- Wildfire 6/10 Major
- Heat 8/10 Severe 6 d/yr ≥111°F today · 16 d/yr by 30 yrs out
- Wind 1/10 Low
- Air quality 3/10 Moderate 2 unhealthy d/yr today · 3 by 30 yrs out
Nearby sold comps map
Loading sold comps map…
Walkable amenities ~0.75 mi
Loading nearby amenities…
Taxation est. · year 1
- Rental income
- $14,101
- − Mortgage interest
- −$3,081
- − Property taxes
- −$825
- − Insurance
- −$275
- − Repairs & maintenance
- −$1,128
- − Management
- −$1,128
- − Depreciation
- −$1,600
- Taxable income
- $6,064
- Est. tax owed @ 24.0%
- −$1,455
- After-tax cash flow
- $5,123/yr
For passive investors: Depreciation is non-cash, so a rental often shows a tax loss while cash-flowing — sheltering income. Rental losses are passive: they offset passive income freely, and up to $25,000/yr can offset ordinary (W-2) income if you actively participate and your MAGI is under $100k (phasing out to $0 by $150k); unused losses carry forward. On sale, claimed depreciation is recaptured at up to 25%, and gains may owe capital-gains tax (a 1031 exchange can defer both). Figures are a year-1 estimate at your 24.0% rate — not tax advice; consult a CPA.
Condition & rehab AI · 12 photos
This beautifully remodeled mobile home in Windsong Mobile Home Park is move-in ready with fresh paint, new appliances, and a fenced backyard with a mountain view.
Value-add opportunities
- Both landscaping — enhances curb appeal and adds value
- Both furniture — improves living space and adds value
- Both smart home integration — increases appeal to tech-savvy buyers
Renovation cost estimate screening
Value-add ROI direction
- Both landscaping — enhances curb appeal and adds value ↑
- Both furniture — improves living space and adds value ↑
- Both smart home integration — increases appeal to tech-savvy buyers ↑
ⓘ Cost ranges are severity-bucket heuristics (US national rule-of-thumb). Get contractor quotes + a written scope before underwriting a rehab budget.
Schools (NCES district)
- District
- Apache Junction Unified District (4443)
- NCES district ID
- 0400790
- Math proficiency
- 15% ▼ -17.00%
- Reading proficiency
- 20% ▼ -13.00%
- Median HH income
- $44,930
- Composite
- 15.34/100
- National rank
- #9325
- State rank
- #195 of 249 in AZ
Livability — Apache Junction
- Score
- 66/100
- State rank
- #70
- US rank
- #11242
Category grades
Schools grade is shown separately in the Schools card above.
Census & demographics
- Census place
- Apache Junction, AZ
- County
- Pinal County · 399,947 people
- City population
- 56,611
- Metro
- Phoenix-Mesa-Chandler, AZ
- Population (ZIP)
- 31,191
- Household income
- $57,786
- Rent vs Own
- Severe rent burden
- 686.0
Population outlook (Pinal County) Hauer SSP2
- Today (2025)
- 437,574 people
- By 2030
- 446,903 · +2.1%
- By 2040
- 452,589 · +3.4%
- By 2050
- 444,126 · +1.5%
- By 2075
- 430,300 · -1.7%
- By 2100
- 393,536 · -10.1%
Race, ethnicity, and origin ACS 2023
- Neighborhood character
- Predominantly White (77%)
- Race & ethnicity
- White 77% Hispanic / Latino 16% Two or more races 10% Asian 1%
- Hispanic origin (detail)
- Mexican 13%
- Common ancestry
- Romanian 3% Lithuanian 3% Portuguese 3%
- Foreign-born
- 7% · Canada
- Languages at home
- 89% English-only · Spanish 8% Tagalog/Filipino 1%
Political lean MEDSL · Pinal
- 2024 margin
- Strong R (+22.1) · D 38.5% · R 60.6%
- 2008→2024 swing
- -7.6pp toward R · 2008: -14.5pp · 2024: -22.1pp
- All cycles
- 2024: R+22.1 2020: R+17.3 2016: R+19.3 2012: R+17.1 2008: R+14.5
Not yet ingested
- Civics
- —
Market trends
- HPI YoY
- ▼ -128.31%
- Current HPI
- 313.4666
- Rent YoY
- ▼ -3.50%
- Metro
- Phoenix-Mesa-Chandler, AZ
- State GDP YoY
- ▲ 4.54%
- F500 in state
- 20
Industry mix (Fortune 500 HQ in AZ)
| Industry | F500 HQs | Revenue |
|---|---|---|
| Technology | 2 | $13B |
|
||
| Mining / Metals | 1 | $23B |
|
||
| Environmental Services | 1 | $16B |
|
||
| Metals / Steel | 1 | $14B |
|
||
| Technology Distribution | 1 | $9B |
|
||
| Homebuilding | 1 | $8B |
|
||
Price history
-3.8% since first listed2 events — show timeline
- 2026-05-22 Price Changed $55,000 ARMLS
- 2026-04-29 Listed $57,200 ARMLS
Cash-flow waterfall
monthlySold comps — $/sqft
last 12 mo · ≤1 miLoading sold comps…