 Duplex
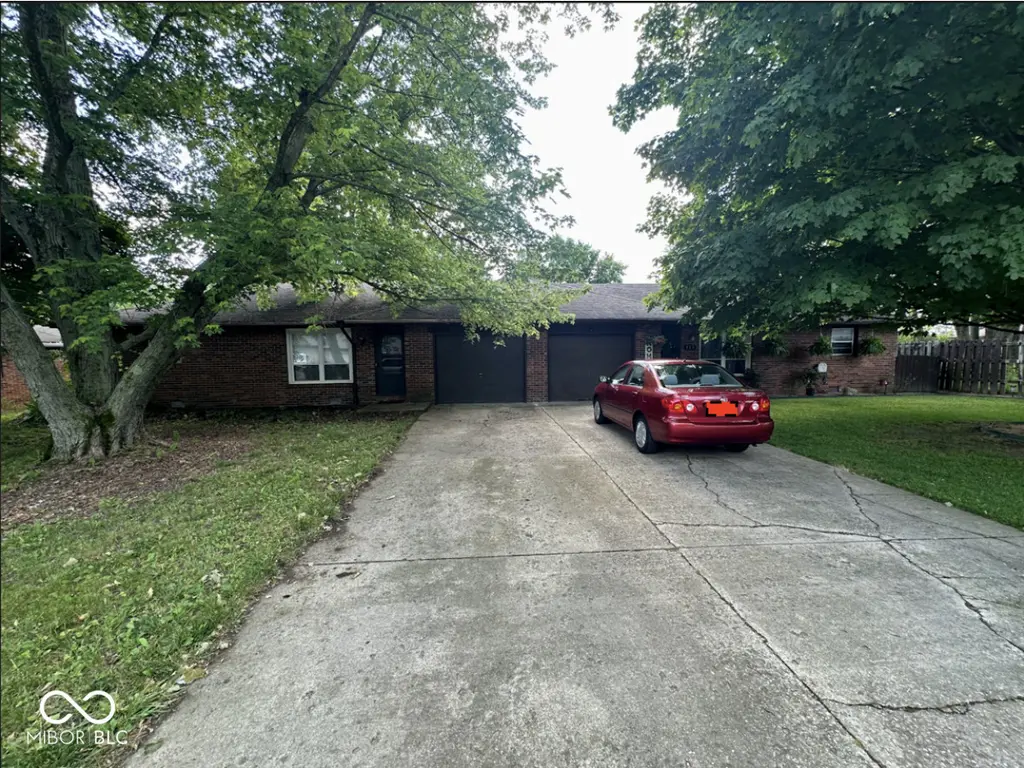
111 Darin Ct · Anderson, IN
Flood risk 1/10 · Minimal
- FEMA flood zone
- X (unshaded)
- Chance of flooding over 30 yrs
- 0.0%
- Est. flood insurance / yr
- $507 – $1,088
Fire risk 1/10 · Minimal
- Est. fire insurance / yr
- $717 – $1,331
Heat risk 3/10 · Minor
- Hot days now (above 100°F)
- 7 days/yr
- Hot days in 30 yrs
- 18 days/yr
Wind risk 2/10 · Minimal
- Chance of severe wind over 30 yrs
- 1.0%
Air-quality risk 3/10 · Minor
- Unhealthy air days now
- 2 days/yr
- Unhealthy air days in 30 yrs
- 3 days/yr
Risk factors via First Street. Map © Google.
Why this score? — see what drove the D grade
The composite is a weighted blend of 9 inputs, each scored 0–100. Each bar is that input's sub-score; the figure is the points it added to the 100-point composite (weight × sub-score).
- Cash flow +17.8/30.0
- DSCR +5.6/10.0
- 1% rule +5.0/10.0
- ARV discount +3.8/15.0
- Rent growth +3.0/5.0
- Livability +3.0/5.0
- Condition / age +2.5/5.0
- Schools +1.6/10.0
- Appreciation +0.0/10.0
$195,000
🖨 Deal sheet (PDF) 📄 Offer letter ✓ Due diligence
Multi-family units
County records classify this as Multi-Family (2-4 Unit). Listing-text estimate: 2 units. confirmed
Listing remarks
Turnkey Duplex - Owner Occupy or Value-Add Investment Fully renovated in 2025, this solid brick duplex offers the perfect blend of durability, functionality, and long-term upside. Featuring two spacious 2 bed / 1 bath units (4 bed, 2 bath total), the property also includes a 2-car garage, utility shed, and a large yard. Both units are currently occupied, providing immediate income, with rents below market-leaving room for future increases and improved returns. The recent interior renovations make this a low-maintenance option for investors or an ideal setup for an owner-occupant looking to offset their mortgage with rental income. Priced in line with recent duplex sales in the immediate ar
Key facts
- Clean updated duplex
- Fully renovated
- Utility shed
Tags
Property features AI
Finance
- Other: Lot size approximately 0.37 acres (about 1/4–1/2 acre)
- Financial info: Gross annual income reported: $21,300; Reported expenses: $250; Unit rents: one unit at $825/month, another at $950/month
Exterior
- Parking: Attached garage; 3 garage spaces
- Utilities: Solid waste service available
- Home design: Residential income property (duplex); One story
- Construction: Brick construction
- Exterior features: Frontage road access; Property currently used as apartments (fewer than 20 units)
Interior
- Kitchen: Kitchen details not provided
- Bedrooms: Both units are 2-bedroom (each on one level)
- Heating & cooling: Wall unit(s) for cooling
- Interior features: Two 2-bedroom units; One-level units
Neighborhood map
What this means for you Summary
Snapshot
- This is a 2 × 2-bed/1.0-bath units multifamily listed at $195k.
Deal economics
- At list price, monthly cash flow is $160 ($2k/yr) — positive. Per door: $80/mo.
- The deal already cash-flows at list — no discount required.
- Meets the 1% rule at list price ($2k rent vs $195k).
- Recommended offer: $192k (1.5% below list) — sets the bar for market timing.
Location & tenants
- Location reads 60/100 on livability (#521 in IN) — a middle-class / working-renter tenant base. Strengths: cost of living A+, housing A+; Watch: schools F, crime D-, amenities F.
- Anderson Community School Corporation (urban): math 15% / reading 23% proficiency, ranked #280 of 301 in IN (top 93%) — low school quality limits family demand, transient renter base, plan for 1-2y turnover; 70% free/reduced lunch — lower-income household profile, screen leases tightly.
- Market conditions: Rents rising (+1.8%/yr); 162 active listings in the ZIP; 184 units permitted in Madison County in 2024 (0 in 5+ unit buildings).
- This rent runs 40% of the median local income ($58k/yr) — at the standard rent-burdened threshold; future hikes will face affordability resistance.
Forward outlook
- Local home prices are declining (-3.0%/yr); year-one equity from $1k of loan paydown is wiped out by about $6k of value loss. Plan a longer hold.
- Madison County population projected at -14% by 2050 — secular population decline; favor cash flow + early exit over multi-decade hold.
Negotiation context
- It's been on market 19 days — a 2% lower offer ($192k) is reasonable based on typical stale-listing flexibility.
- 4 sale attempts with the ask held roughly flat each time — persistent listings suggest the price (not the market) is what's stuck; bring a comps-based counter.
Questions for the listing agent
- Can we see the unit-by-unit rent roll, current vacancy, and any below-market leases? What's the average tenancy length?
- What capital expenditures (roof, boiler, parking lot, exteriors) have been made in the last 5 years, and what's planned in the next 2?
- Is there a deadline driving the sale (1031 exchange, divorce, estate, relocation)? That informs how much negotiation room exists.
- Schools are F-rated, which usually means shorter tenancies and higher turnover. Who's the typical renter profile here, and what's been the actual vacancy rate?
- Crime grade is D in this area — have there been break-ins, vandalism, or insurance claims at this property in the last 3 years? What carrier currently insures it and at what premium?
- The area grade is low — what's the realistic commute time and amenity access for the typical tenant pool here? Any planned neighborhood developments (good or bad) we should know about?
- What's the average days-on-market for RENTAL listings here right now (not sales)? A rising rental-DOM trend means longer vacancies and softer asking-rent achievability than the comps imply.
- What's the recent tenant-quality profile in this submarket — average credit score on applications, eviction rate, late-payment / NSF rate, and stable-employment percentage? A property-management company in the area should have these aggregated.
- How much new apartment / multifamily construction is in the pipeline within 1–3 miles? Heavy new supply (>2% of stock underway) typically softens rents 12–24 months out; light construction supports rent growth.
Investment metrics
- 1% rule
- 1.00% ✓
- Cap rate
- 7.28%
- Cash-on-cash
- 3.52%
- DSCR
- 1.16
- GRM
- 8.3
CMA / ARV
- ARV (median comp)
- $180,000
- List price
- $195,000
- Delta
- 11.11%
- Verdict
- OVERPRICED
- Comps
- 1 within 2.0 mi
Projected returns pro-forma
-3.0% appreciation · 1.82% rent growth · sell at horizon
- IRR
- -12.1%
- Equity multiple
- 0.57×
- Total profit
- $-23,648
- Equity at exit
- $29,075
- IRR
- -4.9%
- Equity multiple
- 0.70×
- Total profit
- $-16,448
- Equity at exit
- $16,860
Cash invested: $54,600 (down + closing). Projections, not guarantees.
Landlord ↔ Tenant lean methodology
- Overall (STATE)
- 90 Strongly Landlord-Friendly
- State Indiana
- 90 Strongly Landlord-Friendly · R+11
- County
- — inherits STATE
- City
- — inherits STATE
ZIP-level market 46012
- Home prices YoY
- -18.6%
- Rents YoY
- 1.8%
- Active inventory
- 162
- Price-to-rent
- 16.6×
Monthly cashflow live
- Estimated rent
- $1,954 medium interval (Pro) →
- Mortgage (P&I)
- −$1,023
- Tax from tax record
- −$280 /mo · $3,357/yr
- Insurance
- −$81
- HOA
- −$0
- Vacancy / Maint / Mgmt
- −$410
- Net cashflow
- $160
Break-even live
Sensitivity live
| Price | -10% $270 | -5% $215 | +0% $160 | +5% $105 | +10% $50 |
|---|---|---|---|---|---|
| Rent | -10% $6 | -5% $83 | +0% $160 | +5% $237 | +10% $314 |
| Rate | -1.0pp $258 | -0.5pp $210 | base $160 | +0.5pp $109 | +1.0pp $58 |
2-unit breakdown (identical units grouped — click to expand)
| Units | Beds | Baths | Est. rent |
|---|---|---|---|
| 2× units | 2 | 1 | $1,954 |
| #1 | 2 | 1 | $977 |
| #2 | 2 | 1 | $977 |
| Total (2 units) | $1,954 | ||
UW: 25.0% down · 7.5% · 30yr · 1.5% tax · 5.0% vac · 8.0% maint · 8.0% mgmt
Financing live
Cash to close
- Down payment
- $48,750
- Closing costs
- $5,850
- Reserves months
- —
- Total cash needed
- —
Loan-product check · same deal, 3 products live
Conventional
25% down · 7.5% · 30yr
- Down + closing
- —
- Monthly P&I
- —
- Monthly cashflow
- —
- DSCR
- —
- Eligible?
- —
Personal DTI + credit; lowest rate.
DSCR
20% down · 8.5% · 30yr
- Down + closing
- —
- Monthly P&I
- —
- Monthly cashflow
- —
- DSCR
- —
- Eligible?
- —
No personal income docs; deal must DSCR.
Hard money
10% down · 12.0% · 12mo
- Down + closing
- —
- Monthly P&I
- —
- Monthly cashflow
- —
- DSCR
- —
- Eligible?
- —
Short-term bridge; refi at stabilization.
Listing history 18 events
-
2026-06-21days on market $195,000 Active 19 DOM
-
2026-06-18days on market $195,000 Active 16 DOM
-
2026-06-17days on market $195,000 Active 15 DOM
-
2026-06-16days on market $195,000 Active 14 DOM
-
2026-06-15days on market $195,000 Active 13 DOM
-
2026-06-13days on market $195,000 Active 11 DOM
-
2026-06-09days on market $195,000 Active 7 DOM
-
2026-06-08days on market $195,000 Active 6 DOM
-
2026-06-07days on market $195,000 Active 5 DOM
-
2026-06-05days on market $195,000 Active 2 DOM
-
2026-06-03pricedays on market $195,000 Active 1 DOM
-
2026-05-31days on market $200,000 Active 64 DOM
-
2026-05-17status Active 993-char remark
-
2026-05-05status Pending 993-char remark
-
2026-04-17price $200,000 993-char remark
-
2026-03-17$210,000 Active 993-char remark
-
2025-08-16historical $950
-
2025-06-10$950
ⓘ Source: listings_history table (triggers on properties + properties_extension) + one-shot
backfill from property_details.listing_events for pre-trigger history.
Tax reassessment forecast IN · Partial reset (capped growth)
- Current annual tax
- $3,357 · $280/mo
- Projected year-2 tax
- $3,357 · $280/mo
- Expected delta
- $0/yr ($0/mo · 0.0%)
ⓘ Screening estimate from a state-policy table — verify with the county assessor before closing.
Climate risk First Street
- Flood 1/10 Low FEMA zone X (unshaded) · 0% chance over 30 yrs
- Wildfire 1/10 Low
- Heat 3/10 Moderate 7 d/yr ≥100°F today · 18 d/yr by 30 yrs out
- Wind 2/10 Low 100% chance of damaging wind over 30 yrs
- Air quality 3/10 Moderate 2 unhealthy d/yr today · 3 by 30 yrs out
Nearby sold comps map
Loading sold comps map…
Walkable amenities ~0.75 mi
Loading nearby amenities…
Taxation est. · year 1
- Rental income
- $23,448
- − Mortgage interest
- −$10,923
- − Property taxes
- −$3,357
- − Insurance
- −$975
- − Repairs & maintenance
- −$1,876
- − Management
- −$1,876
- − Depreciation
- −$5,673
- Taxable loss
- −$1,232
- Est. tax savings @ 24.0%
- +$296
- After-tax cash flow
- $2,216/yr
For passive investors: Depreciation is non-cash, so a rental often shows a tax loss while cash-flowing — sheltering income. Rental losses are passive: they offset passive income freely, and up to $25,000/yr can offset ordinary (W-2) income if you actively participate and your MAGI is under $100k (phasing out to $0 by $150k); unused losses carry forward. On sale, claimed depreciation is recaptured at up to 25%, and gains may owe capital-gains tax (a 1031 exchange can defer both). Figures are a year-1 estimate at your 24.0% rate — not tax advice; consult a CPA.
Schools (NCES district)
- District
- Anderson Community School Corporation
- NCES district ID
- 1800150
- Math proficiency
- 15% ▼ -14.00%
- Reading proficiency
- 23% ▼ -7.00%
- Median HH income
- $38,208
- Composite
- 15.93/100
- National rank
- #9250
- State rank
- #280 of 301 in IN
Livability — Anderson
- Score
- 60/100
- State rank
- #521
- US rank
- #18709
Category grades
Schools grade is shown separately in the Schools card above.
Census & demographics
- County
- Madison County · 69,445 people
- City population
- 57,762
- Metro
- Indianapolis-Carmel-Anderson, IN
- Population (ZIP)
- 20,855
- Household income
- $58,041
- Rent vs Own
- Severe rent burden
- 987.0
Population outlook (Madison County) Hauer SSP2
- Today (2025)
- 125,800 people
- By 2030
- 122,640 · -2.5%
- By 2040
- 115,420 · -8.3%
- By 2050
- 108,148 · -14.0%
- By 2075
- 91,838 · -27.0%
- By 2100
- 75,670 · -39.8%
Race, ethnicity, and origin ACS 2023
- Neighborhood character
- Predominantly White (85%)
- Race & ethnicity
- White 85% Hispanic / Latino 5% Two or more races 4% Black 4%
- Hispanic origin (detail)
- Mexican 4%
- Common ancestry
- Slovak 3% Serbian 2% Italian 1%
- Foreign-born
- 2% · Canada, Vietnam
- Languages at home
- 96% English-only · Spanish 3%
Political lean MEDSL · Madison
- 2024 margin
- Strong R (+26.9) · D 35.6% · R 62.5% · Other 1.9%
- 2008→2024 swing
- -33.5pp toward R · 2008: 6.5pp · 2024: -26.9pp
- All cycles
- 2024: R+26.9 2020: R+22.6 2016: R+25.7 2012: R+4.5 2008: D+6.5
Not yet ingested
- Civics
- —
Market trends
- HPI YoY
- ▼ -61.16%
- Current HPI
- 266.9819
- Rent YoY
- ▲ 1.82%
- Metro
- Indianapolis-Carmel-Anderson, IN
- State GDP YoY
- ▲ 2.90%
- F500 in state
- 18
Industry mix (Fortune 500 HQ in IN)
| Industry | F500 HQs | Revenue |
|---|---|---|
| Industrial Machinery | 2 | $37B |
|
||
| Healthcare | 1 | $177B |
|
||
| Pharmaceuticals | 1 | $45B |
|
||
| Metals / Steel | 1 | $18B |
|
||
| Agriculture | 1 | $17B |
|
||
| Packaging | 1 | $12B |
|
||
Price history
-7.1% since first listed8 events — show timeline
- 2026-06-02 Listed $195,000 MIBOR as Distributed by MLS Grid
- 2026-05-31 Listing Removed — MIBOR as Distributed by MLS Grid
- 2026-05-17 Relisted — MIBOR as Distributed by MLS Grid
- 2026-05-05 Pending — MIBOR as Distributed by MLS Grid
- 2026-04-17 Price Changed $200,000 MIBOR as Distributed by MLS Grid
- 2026-03-17 Listed $210,000 MIBOR as Distributed by MLS Grid
- 2025-08-16 Rental Removed $950 APPFOLIO
- 2025-06-10 Listed for Rent $950 APPFOLIO
Property tax history
+4.4%/yrLatest (2024): $3,357 · +15.6% YoY. Source: county tax records.
Cash-flow waterfall
monthlySold comps — $/sqft
last 12 mo · ≤1 miLoading sold comps…