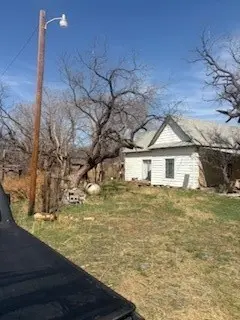
895 Fm 1085 · Trent, TX
Flood risk 6/10 · Moderate
- FEMA flood zone
- A
- Chance of flooding over 30 yrs
- 0.75%
- Est. flood insurance / yr
- $1,009 – $1,996
Fire risk 7/10 · Major
- Est. fire insurance / yr
- $1,222 – $2,270
Heat risk 6/10 · Moderate
- Hot days now (above 105°F)
- 3 days/yr
- Hot days in 30 yrs
- 11 days/yr
Wind risk 4/10 · Minor
- Chance of severe wind over 30 yrs
- 11.0%
Air-quality risk 1/10 · Minimal
- Unhealthy air days now
- 0 days/yr
- Unhealthy air days in 30 yrs
- 0 days/yr
Risk factors via First Street. Map © Google.
Why this score? — see what drove the D+ grade
The composite is a weighted blend of 9 inputs, each scored 0–100. Each bar is that input's sub-score; the figure is the points it added to the 100-point composite (weight × sub-score).
- Cash flow +14.6/30.0
- ARV discount +8.0/15.0
- Appreciation +7.9/10.0
- DSCR +4.5/10.0
- Schools +3.2/10.0
- Livability +3.1/5.0
- 1% rule +3.0/10.0
- Rent growth +2.5/5.0
- Condition / age +2.5/5.0
$150,000
🖨 Deal sheet (PDF) 📄 Offer letter ✓ Due diligence
Listing remarks MLS
33.37 Acres | 3 Bed / 2 Bath | 1,472 Sqft | Built 1935 The market already proved this corridor out — 25 acres directly across the road is pending at a high price , in a flood zone, with no home. This property offers more acreage, an existing 3/2 home, and FM road frontage at a much lower price Flood zone designation on record — this area of West TX is not known to flood. Ideal for subdivision, ranch development, buy-and-hold land investment, or live-in/rental with room to grow. FM road access, wide open usable acreage.
Key facts
- 33.37 acre lot
- Built 1935
- Listed 55 days
Neighborhood map
What this means for you Summary
Snapshot
- This is a 3-bed/2.0-bath single-family listed at $150k.
Deal economics
- At list price, monthly cash flow is $-89 ($-1k/yr) — negative.
- To cash-flow at today's rent, offer at most $134k (10.4% below list).
- To meet the 1% rule (rent ≥ 1% of price), the offer needs to be $120k (20.1% below list).
- Recommended offer: $120k (20.1% below list) — sets the bar for 1% rule.
Location & tenants
- Location reads 61/100 on livability (#988 in TX) — a middle-class / working-renter tenant base. Strengths: cost of living A+, employment B+, housing B; Watch: health & safety C-, schools D-, crime F.
- Trent ISD (rural): math 40% / reading 30% proficiency, ranked #900 of 1,141 in TX (top 79%) — families likely to look elsewhere, expect single-tenant / working-renter base with shorter leases.
- Market conditions: 14 active listings in the ZIP; 508 units permitted in Taylor County in 2024 (0 in 5+ unit buildings).
Forward outlook
- In year one you build about $10k of equity ($1k loan paydown + $9k appreciation (5.8% local appreciation)).
- Taylor County population projected at +16% by 2050 — long-run rental-demand tailwind backs the buy-and-hold thesis.
- By year 4, paydown + projected appreciation supports a ~$33k cash-out refi (75% LTV) — recoverable capital for the next deal without selling this one.
Negotiation context
- It's been on market 56 days — a 3% lower offer ($146k) is reasonable based on typical stale-listing flexibility.
Risks & watch-outs
- Watch-outs: flood insurance adds $125/mo; built in 1935 — expect roof / HVAC / electrical / plumbing capex.
- Climate carrying-cost: in FEMA flood zone A (mandatory federal flood insurance); major wildfire risk; extreme-heat days projected 3→11/yr by 2055 (HVAC capex compounding) — expect insurance premiums to compound above CPI over the hold.
Questions for the listing agent
- What do current leases actually rent for vs. the listed asking? Can we see a recent rent roll and the last 12 months of T-12 income?
- It's been on market 56 days. Have you received any prior offers? Is the seller open to a 20% concession, seller financing, or rate buy-down credit?
- Built in 1935 — when were the roof, HVAC, electrical panel, plumbing, and water heater last replaced?
- What's the actual annual flood-insurance premium (NFIP or private), and is the property in a SFHA with mandatory coverage?
- Is there a deadline driving the sale (1031 exchange, divorce, estate, relocation)? That informs how much negotiation room exists.
- Schools are D-rated, which usually means shorter tenancies and higher turnover. Who's the typical renter profile here, and what's been the actual vacancy rate?
- Crime grade is F in this area — have there been break-ins, vandalism, or insurance claims at this property in the last 3 years? What carrier currently insures it and at what premium?
- The area grade is low — what's the realistic commute time and amenity access for the typical tenant pool here? Any planned neighborhood developments (good or bad) we should know about?
- What's the average days-on-market for RENTAL listings here right now (not sales)? A rising rental-DOM trend means longer vacancies and softer asking-rent achievability than the comps imply.
- What's the recent tenant-quality profile in this submarket — average credit score on applications, eviction rate, late-payment / NSF rate, and stable-employment percentage? A property-management company in the area should have these aggregated.
- How much new for-sale + rental construction is in the pipeline within 1–3 miles? Heavy new supply typically softens prices + rents 12–24 months out; constrained supply supports both.
Investment metrics
- 1% rule
- 0.80% ✗
- Cap rate
- 6.59%
- Cash-on-cash
- 1.05%
- DSCR
- 1.05
- GRM
- 10.4
CMA / ARV
- ARV (median comp)
- $151,776
- List price
- $150,000
- Delta
- -1.17%
- Verdict
- FAIR
- Comps
- 8 within 1.0 mi
Show comp detail 1 sale within ~0.75 mi
| Address | Dist | Beds/Ba | Sqft | Sold | Price | $/sf | Match |
|---|---|---|---|---|---|---|---|
| 218 N Oak St | 0.62mi | 3/2.0 | 1,494 (+2%) | 8mo | $128,900 | $86 | 62 |
Match score weights: distance 35% · size 25% · config 20% · recency 20%. Top-matched comps best support the ARV.
Projected returns pro-forma
5.84% appreciation · 3.0% rent growth · sell at horizon
- IRR
- 12.9%
- Equity multiple
- 1.86×
- Total profit
- $36,244
- Equity at exit
- $92,762
- IRR
- 13.6%
- Equity multiple
- 3.65×
- Total profit
- $111,451
- Equity at exit
- $166,910
Cash invested: $42,000 (down + closing). Projections, not guarantees.
Landlord ↔ Tenant lean methodology
- Overall (STATE)
- 87 Strongly Landlord-Friendly
- State Texas
- 87 Strongly Landlord-Friendly · R+5
- County
- — inherits STATE
- City
- — inherits STATE
ZIP-level market 79561
- Home prices YoY
- 4.6%
- Active inventory
- 14
- Price-to-rent
- 10.4×
Monthly cashflow live
- Estimated rent
- $1,198 medium interval (Pro) →
- Mortgage (P&I)
- −$787
- Tax from tax record
- −$61 /mo · $731/yr
- Insurance
- −$62
- Flood insurance flood zone
- −$125 /mo · $1,502/yr
- HOA
- −$0
- Vacancy / Maint / Mgmt
- −$252
- Net cashflow
- $-89
Break-even live
Sensitivity live
| Price | -10% $-4 | -5% $-46 | +0% $-89 | +5% $-131 | +10% $-173 |
|---|---|---|---|---|---|
| Rent | -10% $-183 | -5% $-136 | +0% $-89 | +5% $-41 | +10% $6 |
| Rate | -1.0pp $-13 | -0.5pp $-50 | base $-89 | +0.5pp $-127 | +1.0pp $-167 |
UW: 25.0% down · 7.5% · 30yr · 1.5% tax · 5.0% vac · 8.0% maint · 8.0% mgmt
Financing live
Cash to close
- Down payment
- $37,500
- Closing costs
- $4,500
- Reserves months
- —
- Total cash needed
- —
Loan-product check · same deal, 3 products live
Conventional
25% down · 7.5% · 30yr
- Down + closing
- —
- Monthly P&I
- —
- Monthly cashflow
- —
- DSCR
- —
- Eligible?
- —
Personal DTI + credit; lowest rate.
DSCR
20% down · 8.5% · 30yr
- Down + closing
- —
- Monthly P&I
- —
- Monthly cashflow
- —
- DSCR
- —
- Eligible?
- —
No personal income docs; deal must DSCR.
Hard money
10% down · 12.0% · 12mo
- Down + closing
- —
- Monthly P&I
- —
- Monthly cashflow
- —
- DSCR
- —
- Eligible?
- —
Short-term bridge; refi at stabilization.
Listing history 7 events
-
2026-06-01days on market $150,000 Active 56 DOM
-
2026-05-31days on market $150,000 Active 55 DOM
-
2026-05-06price $150,000 547-char remark
Show marketing remark (547 chars)
33.37 Acres | 3 Bed / 2 Bath | 1,472 Sqft | Built 1935 The market already proved this corridor out — 25 acres directly across the road is pending at a high price , in a flood zone, with no home. This property offers more acreage, an existing 3/2 home, and FM road frontage at a much lower price Flood zone designation on record — this area of West TX is not known to flood. Ideal for subdivision, ranch development, buy-and-hold land investment, or live-in/rental with room to grow. FM road access, wide open usable acreage.
-
2026-04-13price $185,000 547-char remark
Show marketing remark (547 chars)
33.37 Acres | 3 Bed / 2 Bath | 1,472 Sqft | Built 1935 The market already proved this corridor out — 25 acres directly across the road is pending at a high price , in a flood zone, with no home. This property offers more acreage, an existing 3/2 home, and FM road frontage at a much lower price Flood zone designation on record — this area of West TX is not known to flood. Ideal for subdivision, ranch development, buy-and-hold land investment, or live-in/rental with room to grow. FM road access, wide open usable acreage.
-
2026-04-07price $215,000 547-char remark
Show marketing remark (547 chars)
33.37 Acres | 3 Bed / 2 Bath | 1,472 Sqft | Built 1935 The market already proved this corridor out — 25 acres directly across the road is pending at a high price , in a flood zone, with no home. This property offers more acreage, an existing 3/2 home, and FM road frontage at a much lower price Flood zone designation on record — this area of West TX is not known to flood. Ideal for subdivision, ranch development, buy-and-hold land investment, or live-in/rental with room to grow. FM road access, wide open usable acreage.
-
2026-04-06$21,500 Active 547-char remark
Show marketing remark (547 chars)
33.37 Acres | 3 Bed / 2 Bath | 1,472 Sqft | Built 1935 The market already proved this corridor out — 25 acres directly across the road is pending at a high price , in a flood zone, with no home. This property offers more acreage, an existing 3/2 home, and FM road frontage at a much lower price Flood zone designation on record — this area of West TX is not known to flood. Ideal for subdivision, ranch development, buy-and-hold land investment, or live-in/rental with room to grow. FM road access, wide open usable acreage.
-
2009-10-27soldstatus
ⓘ Source: listings_history table (triggers on properties + properties_extension) + one-shot
backfill from property_details.listing_events for pre-trigger history.
Tax reassessment forecast TX · Resets to sale price
- Current annual tax
- $731 · $61/mo
- Projected year-2 tax
- $2,745 · $229/mo
- Expected delta
- +$2,014/yr (+$168/mo · 275.4%)
ⓘ Screening estimate from a state-policy table — verify with the county assessor before closing.
Climate risk First Street
- Flood 6/10 Major FEMA zone A · 75% chance over 30 yrs
- Wildfire 7/10 Severe
- Heat 6/10 Major 3 d/yr ≥105°F today · 11 d/yr by 30 yrs out
- Wind 4/10 Moderate 11% chance of damaging wind over 30 yrs
- Air quality 1/10 Low 0 unhealthy d/yr today · 0 by 30 yrs out
Nearby sold comps map
Loading sold comps map…
Walkable amenities ~0.75 mi
Loading nearby amenities…
Taxation est. · year 1
- Rental income
- $14,380
- − Mortgage interest
- −$8,402
- − Property taxes
- −$731
- − Insurance
- −$2,252
- − Repairs & maintenance
- −$1,150
- − Management
- −$1,150
- − Depreciation
- −$4,364
- Taxable loss
- −$3,670
- Est. tax savings @ 24.0%
- +$881
- After-tax cash flow
- $-182/yr
For passive investors: Depreciation is non-cash, so a rental often shows a tax loss while cash-flowing — sheltering income. Rental losses are passive: they offset passive income freely, and up to $25,000/yr can offset ordinary (W-2) income if you actively participate and your MAGI is under $100k (phasing out to $0 by $150k); unused losses carry forward. On sale, claimed depreciation is recaptured at up to 25%, and gains may owe capital-gains tax (a 1031 exchange can defer both). Figures are a year-1 estimate at your 24.0% rate — not tax advice; consult a CPA.
Schools (NCES district)
- District
- Trent ISD
- NCES district ID
- 4843110
- Math proficiency
- 40% ▲ 10.00%
- Reading proficiency
- 30% ▼ -20.00%
- Median HH income
- $43,381
- Composite
- 32.37/100
- National rank
- #10882
- State rank
- #900 of 1141 in TX
Livability — Trent
- Score
- 61/100
- State rank
- #988
- US rank
- #17631
Category grades
Schools grade is shown separately in the Schools card above.
Census & demographics
- Population (ZIP)
- 556
Population outlook (Taylor County) Hauer SSP2
- Today (2025)
- 145,270 people
- By 2030
- 150,050 · +3.3%
- By 2040
- 159,417 · +9.7%
- By 2050
- 168,883 · +16.3%
- By 2075
- 194,436 · +33.8%
- By 2100
- 203,163 · +39.9%
Race, ethnicity, and origin ACS 2023
- Neighborhood character
- Predominantly White (80%)
- Race & ethnicity
- White 80% Black 6% Hispanic / Latino 6% Two or more races 5% Asian 4%
- Hispanic origin (detail)
- Mexican 6%
- Common ancestry
- Italian 8% Slovak 3% Serbian 3%
- Foreign-born
- 4% · Canada
- Languages at home
- 95% English-only · Spanish 2% Tagalog/Filipino 2% Vietnamese 1%
Political lean MEDSL · Taylor
- 2024 margin
- Solid R (+49.8) · D 24.6% · R 74.4% · Other 1.0%
- 2008→2024 swing
- -4.2pp toward R · 2008: -45.6pp · 2024: -49.8pp
- All cycles
- 2024: R+49.8 2020: R+45.3 2016: R+51.1 2012: R+53.6 2008: R+45.6
Not yet ingested
- Civics
- —
Market trends
- HPI YoY
- ▲ 5.84%
- Current HPI
- 132.735
- Rent YoY
- —
- Metro
- —
- State GDP YoY
- ▲ 3.95%
- F500 in state
- 110
Industry mix (Fortune 500 HQ in TX)
| Industry | F500 HQs | Revenue |
|---|---|---|
| Energy | 16 | $1,198B |
|
||
| Technology | 5 | $198B |
|
||
| Engineering / Construction | 4 | $72B |
|
||
| Energy Services | 3 | $60B |
|
||
| Utilities | 3 | $41B |
|
||
| Healthcare | 2 | $330B |
|
||
Price history
+597.7% since first listed5 events — show timeline
- 2026-05-06 Price Changed $150,000 HARMLS
- 2026-04-13 Price Changed $185,000 HARMLS
- 2026-04-07 Price Changed $215,000 HARMLS
- 2026-04-06 Listed $21,500 HARMLS
- 2009-10-27 Sold (Public Records) — Public Records
Property tax history
+12.4%/yrLatest (2025): $731 · +262.0% YoY. Source: county tax records.
Cash-flow waterfall
monthlySold comps — $/sqft
last 12 mo · ≤1 miLoading sold comps…