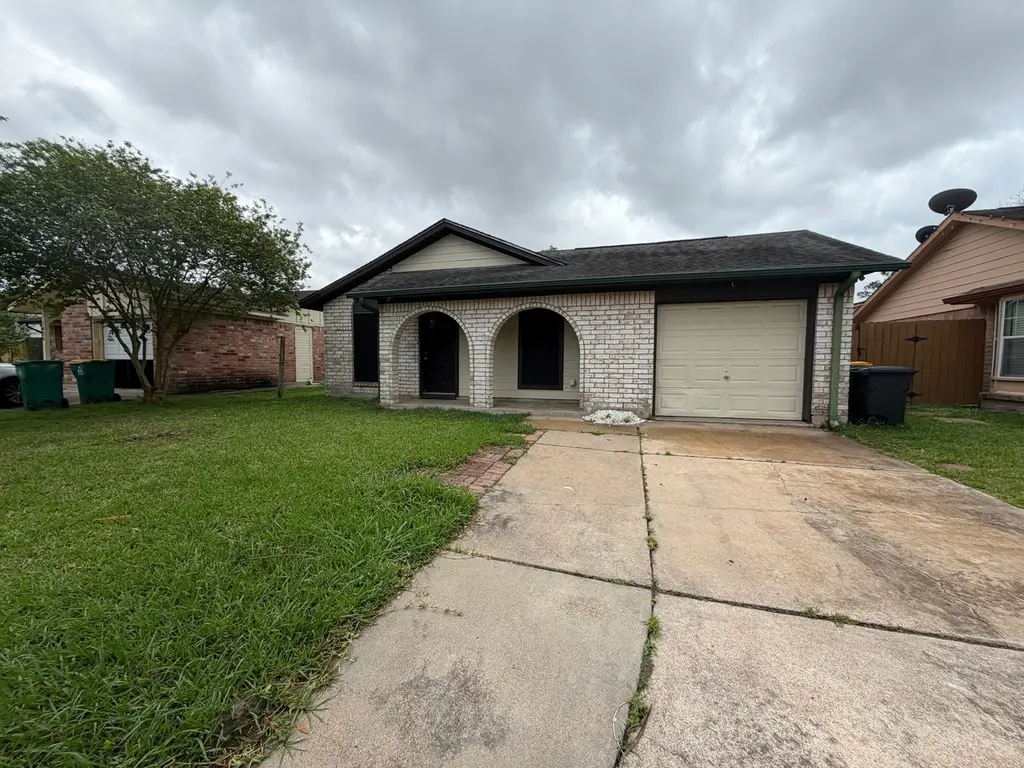
1422 Kappa St · Pasadena, TX
Flood risk 6/10 · Moderate
- FEMA flood zone
- X (unshaded)
- Chance of flooding over 30 yrs
- 0.66%
- Est. flood insurance / yr
- $507 – $1,088
Fire risk 1/10 · Minimal
- Est. fire insurance / yr
- $1,222 – $2,270
Heat risk 10/10 · Severe
- Hot days now (above 109°F)
- 7 days/yr
- Hot days in 30 yrs
- 24 days/yr
Wind risk 9/10 · Severe
- Chance of severe wind over 30 yrs
- 99.0%
Air-quality risk 2/10 · Minimal
- Unhealthy air days now
- 1 days/yr
- Unhealthy air days in 30 yrs
- 2 days/yr
Risk factors via First Street. Map © Google.
Why this score? — see what drove the D grade
The composite is a weighted blend of 9 inputs, each scored 0–100. Each bar is that input's sub-score; the figure is the points it added to the 100-point composite (weight × sub-score).
- ARV discount +13.1/15.0
- Cash flow +9.7/30.0
- 1% rule +4.5/10.0
- Livability +3.3/5.0
- Rent growth +2.8/5.0
- DSCR +2.7/10.0
- Schools +2.6/10.0
- Condition / age +2.5/5.0
- Appreciation +0.0/10.0
$159,900
🖨 Deal sheet (PDF) 📄 Offer letter ✓ Due diligence
Listing remarks
Three-bedroom, two bath home with a one car garage. “This property is eligible under the Freddie Mac First Look Initiative through 05/30/2026.”
Key facts
- 4,691 sq ft lot
- 2 garage spots
- Built 1971
Property features AI
Exterior
- Parking: Attached garage with 2 parking spaces
- Utilities: Public water; Public sewer
- Home design: Residential property; Single-story entry (first-floor living areas)
- Construction: Brick construction; Built in 1971; Slab foundation
- Exterior features: Located in a subdivision
Interior
- Bedrooms: Primary bedroom on the first floor (approx. 12 x 14); Second bedroom on the first floor (approx. 10 x 13); Third bedroom on the first floor (approx. 9 x 10)
- Bathrooms: 1 full bathroom; 1 half bathroom
- Heating & cooling: Central electric heating; Central electric cooling (Central Air)
- Interior features: 3 total rooms
Neighborhood map
What this means for you Summary
Snapshot
- This is a 3-bed/1.5-bath single-family listed at $160k.
Deal economics
- At list price, monthly cash flow is $-106 ($-1k/yr) — negative.
- To cash-flow at today's rent, offer at most $141k (11.7% below list).
- To meet the 1% rule (rent ≥ 1% of price), the offer needs to be $152k (5.1% below list).
- Recommended offer: $141k (11.7% below list) — sets the bar for cash-flow.
- Cap rate 5.5% vs local median 3.5% in Pasadena — top-decile yield for the area; either an underpriced asset or a hidden risk that comps aren't pricing in. Stress-test before assuming the spread holds.
Location & tenants
- Location reads 66/100 on livability (#600 in TX) — a middle-class / working-renter tenant base. Strengths: cost of living A+, housing A+; Watch: employment D+, crime F, amenities F.
- Pasadena ISD (suburban): math 29% / reading 32% proficiency, ranked #612 of 826 in TX (top 74%) — families likely to look elsewhere, expect single-tenant / working-renter base with shorter leases; 71% free/reduced lunch — lower-income household profile, screen leases tightly.
- Zoned schools: Teague El (math 21% / reading 23%, grade F, #3,333 of 4,322 statewide, top 80%, 758 students, 78% FRL); Carter Lomax Middle (math 32% / reading 39%, grade F, #827 of 1,662 statewide, top 51%, 632 students, 74% FRL); Pasadena H S (math 41% / reading 31%, grade F, #930 of 1,632 statewide, top 57%, 2,221 students, 90% FRL).
- Market conditions: Rents rising (+1.3%/yr); 80 active listings in the ZIP; 19 comparable units currently listed for rent nearby; rentals leasing fast (median 8d on market — plan ~1-2 weeks tenant-placement turnaround); 29,883 units permitted in Harris County in 2024 (8,621 in 5+ unit buildings).
- This rent runs 35% of the median local income ($51k/yr) — at the standard rent-burdened threshold; future hikes will face affordability resistance.
Forward outlook
- Local home prices are declining (-3.0%/yr); year-one equity from $1k of loan paydown is wiped out by about $5k of value loss. Plan a longer hold.
- Harris County population projected at +47% by 2050 — long-run rental-demand tailwind backs the buy-and-hold thesis.
Negotiation context
- It's been on market 33 days — a 3% lower offer ($155k) is reasonable based on typical stale-listing flexibility.
- 8 sale attempts since 8y ago with the ask held roughly flat each time — persistent listings suggest the price (not the market) is what's stuck; bring a comps-based counter.
Risks & watch-outs
- Watch-outs: property tax is 3.0% of price.
- Climate carrying-cost: major flood risk; severe wind risk, 99% chance of damaging wind over 30y; extreme-heat days projected 7→24/yr by 2055 (HVAC capex compounding) — expect insurance premiums to compound above CPI over the hold.
Questions for the listing agent
- What do current leases actually rent for vs. the listed asking? Can we see a recent rent roll and the last 12 months of T-12 income?
- It's been on market 33 days. Have you received any prior offers? Is the seller open to a 12% concession, seller financing, or rate buy-down credit?
- Built in 1971 — when were the roof, HVAC, electrical panel, plumbing, and water heater last replaced?
- Property tax is high relative to price — has the assessment been appealed recently, and will the sale trigger a re-assessment?
- Is there a deadline driving the sale (1031 exchange, divorce, estate, relocation)? That informs how much negotiation room exists.
- Schools are D-rated, which usually means shorter tenancies and higher turnover. Who's the typical renter profile here, and what's been the actual vacancy rate?
- Crime grade is F in this area — have there been break-ins, vandalism, or insurance claims at this property in the last 3 years? What carrier currently insures it and at what premium?
- The area grade is low — what's the realistic commute time and amenity access for the typical tenant pool here? Any planned neighborhood developments (good or bad) we should know about?
- What's the average days-on-market for RENTAL listings here right now (not sales)? A rising rental-DOM trend means longer vacancies and softer asking-rent achievability than the comps imply.
- What's the recent tenant-quality profile in this submarket — average credit score on applications, eviction rate, late-payment / NSF rate, and stable-employment percentage? A property-management company in the area should have these aggregated.
- How much new for-sale + rental construction is in the pipeline within 1–3 miles? Heavy new supply typically softens prices + rents 12–24 months out; constrained supply supports both.
Investment metrics
- 1% rule
- 0.95% ✗
- Cap rate
- 5.50%
- Cash-on-cash
- -2.85%
- DSCR
- 0.87
- GRM
- 8.8
CMA / ARV
- ARV (median comp)
- $182,460
- List price
- $159,900
- Delta
- -12.36%
- Verdict
- UNDERPRICED
- Comps
- 20 within 1.0 mi
Show comp detail 12 sales within ~0.75 mi
| Address | Dist | Beds/Ba | Sqft | Sold | Price | $/sf | Match |
|---|---|---|---|---|---|---|---|
| 1411 Pi Cir | 0.17mi | 3/1.5 | 1,084 (+3%) | 7mo | $220,000 | $203 | 82 |
| 1414 N Circle Park St | 0.10mi | 3/1.5 | 1,128 (+7%) | 8mo | $139,000 | $123 | 77 |
| 1231 Gamma St | 0.15mi | 3/1.5 | 1,082 (+2%) | 14mo | $214,900 | $199 | 77 |
| 1402 S Circle Park St | 0.20mi | 3/1.5 | 1,133 (+7%) | 9mo | $214,900 | $190 | 71 |
| 1422 Kenwick Pl | 0.41mi | 3/1.5 | 992 (-6%) | 2mo | $224,999 | $227 | 68 |
| 1411 Epsilon St | 0.12mi | 3/2.0 | 1,138 (+8%) | 14mo | $214,850 | $189 | 68 |
| 1218 Gamma St | 0.17mi | 3/1.5 | 950 (-10%) | 11mo | $215,000 | $226 | 66 |
| 1406 Chippawa Ln | 0.37mi | 3/2.0 | 1,100 (+4%) | 11mo | $210,000 | $191 | 64 |
| 1210 Kenwick Pl | 0.45mi | 3/1.5 | 997 (-6%) | 7mo | $214,900 | $216 | 64 |
| 1602 Wentwood Dr | 0.47mi | 3/2.0 | 1,013 (-4%) | 7mo | $239,800 | $237 | 63 |
| 1706 Chippawa Ln | 0.41mi | 3/2.0 | 1,175 (+11%) | 6mo | $219,990 | $187 | 55 |
| 1215 Kenwick Pl | 0.47mi | 3/1.5 | 1,168 (+10%) | 9mo | $220,000 | $188 | 53 |
Match score weights: distance 35% · size 25% · config 20% · recency 20%. Top-matched comps best support the ARV.
Projected returns pro-forma
-3.0% appreciation · 1.28% rent growth · sell at horizon
- IRR
- -23.3%
- Equity multiple
- 0.22×
- Total profit
- $-35,116
- Equity at exit
- $23,842
- IRR
- -24.2%
- Equity multiple
- -0.09×
- Total profit
- $-48,940
- Equity at exit
- $13,825
Cash invested: $44,772 (down + closing). Projections, not guarantees.
Landlord ↔ Tenant lean methodology
- Overall (STATE)
- 87 Strongly Landlord-Friendly
- State Texas
- 87 Strongly Landlord-Friendly · R+5
- County
- — inherits STATE
- City
- — inherits STATE
ZIP-level market 77504
- Home prices YoY
- -24.7%
- Rents YoY
- 1.3%
- Active inventory
- 80
- Price-to-rent
- 8.8×
Monthly cashflow live
- Estimated rent
- $1,518 high interval (Pro) →
- Mortgage (P&I)
- −$839
- Tax from tax record
- −$400 /mo · $4,805/yr
- Insurance
- −$67
- HOA
- −$0
- Vacancy / Maint / Mgmt
- −$319
- Net cashflow
- $-106
Break-even live
Sensitivity live
| Price | -10% $-16 | -5% $-61 | +0% $-106 | +5% $-152 | +10% $-197 |
|---|---|---|---|---|---|
| Rent | -10% $-226 | -5% $-166 | +0% $-106 | +5% $-46 | +10% $14 |
| Rate | -1.0pp $-26 | -0.5pp $-66 | base $-106 | +0.5pp $-148 | +1.0pp $-190 |
UW: 25.0% down · 7.5% · 30yr · 1.5% tax · 5.0% vac · 8.0% maint · 8.0% mgmt
Financing live
Cash to close
- Down payment
- $39,975
- Closing costs
- $4,797
- Reserves months
- —
- Total cash needed
- —
Loan-product check · same deal, 3 products live
Conventional
25% down · 7.5% · 30yr
- Down + closing
- —
- Monthly P&I
- —
- Monthly cashflow
- —
- DSCR
- —
- Eligible?
- —
Personal DTI + credit; lowest rate.
DSCR
20% down · 8.5% · 30yr
- Down + closing
- —
- Monthly P&I
- —
- Monthly cashflow
- —
- DSCR
- —
- Eligible?
- —
No personal income docs; deal must DSCR.
Hard money
10% down · 12.0% · 12mo
- Down + closing
- —
- Monthly P&I
- —
- Monthly cashflow
- —
- DSCR
- —
- Eligible?
- —
Short-term bridge; refi at stabilization.
Rent comps 19 comps
| Address | Beds | Baths | Sqft | Rent | $/sqft | DOM | Units | Dist |
|---|---|---|---|---|---|---|---|---|
| 1302 Gamma St Pasadena, TX | 3.0 | 1.5 | 980 | $1,625 | $1.66 | 45d | 1 | 0.12mi |
| 4747 Burke Rd Pasadena, TX | 2.0 | 1.0 | 740 | $1,212 | $1.64 | 6d | 1 | 0.56mi |
| 4747 Burke Rd Pasadena, TX | 2.0 | 1.0 | 740 | $1,212 | $1.64 | 1d | 1 | 0.56mi |
| 4025 Burke Rd Unit 4082 Pasadena, TX | 2.0 | 2.0 | 800 | $1,106 | $1.38 | 1d | 1 | 0.88mi |
| 4025 Burke Rd Unit 4058 Pasadena, TX | 3.0 | 2.0 | 1104 | $1,613 | $1.46 | 1d | 1 | 0.88mi |
| 4201 Fairmont Pkwy Pasadena, TX | 1.0–3.0 | 1.0–2.0 | 867 | $1,790 | $2.06 | 1d | 59 | 1.05mi |
| 4209 Colombia Dr Pasadena, TX | 3.0 | 2.0 | 1170 | $1,785 | $1.53 | 45d | 1 | 1.15mi |
| 13099 Fuqua St Houston, TX | 2.0 | 2.0 | 953 | $1,517 | $1.59 | 26d | 1 | 1.18mi |
| 3602 Burke Rd Pasadena, TX | 1.0–2.0 | 1.0 | 881 | $1,375 | $1.56 | 7d | 1 | 1.24mi |
| 3602 Burke Rd Unit 3659 Pasadena, TX | 2.0 | 2.0 | 1090 | $1,184 | $1.09 | 1d | 1 | 1.24mi |
| 3907 Ecuador Dr Pasadena, TX | 2.0 | 1.0 | 1090 | $1,100 | $1.01 | 45d | 1 | 1.24mi |
| 4343 Shaver St Apt 426 Pasadena, TX | 2.0 | 1.0 | 951 | $1,150 | $1.21 | 45d | 1 | 1.32mi |
| 5045 Crenshaw Rd Pasadena, TX | 1.0–3.0 | 1.0–2.0 | 979 | $2,163 | $2.21 | 0d | 16 | 1.39mi |
| 4100 Vista Rd Pasadena, TX | 1.0–3.0 | 1.0–2.0 | 868 | $1,670 | $1.92 | 4d | 15 | 1.43mi |
| 4100 Vista Rd Pasadena, TX | 1.0–3.0 | 1.0–2.0 | 868 | $1,735 | $2.00 | 0d | 11 | 1.43mi |
| 4300 Shaver St Apt 11 Houston, TX | 2.0 | 1.0 | 891 | $1,110 | $1.25 | 45d | 1 | 1.43mi |
| 5051 Crenshaw Rd Pasadena, TX | 2.0 | 2.0 | 1039 | $1,560 | $1.50 | 45d | 1 | 1.45mi |
| 4000 Lily St Pasadena, TX | 2.0 | 2.0 | 1039 | $1,672 | $1.61 | 13d | 1 | 1.46mi |
| 4817 E Sam Houston Pkwy S Pasadena, TX | 2.0 | 2.0 | 1024 | $1,655 | $1.62 | 45d | 1 | 1.46mi |
Listing history 28 events
-
2026-06-02days on market $159,900 Pending 33 DOM
-
2026-06-01days on market $159,900 Pending 32 DOM
-
2026-05-31days on market $159,900 Pending 31 DOM
-
2026-04-30$159,900 Active 159-char remark
-
2026-04-29soldstatus
-
2026-04-11historical
-
2026-03-20status Active
-
2026-03-20price $210,000
-
2025-11-25status Pending
-
2025-11-20historical
-
2025-11-18$185,000 Active
-
2023-06-17historical
-
2023-06-13status Active
-
2023-05-05historical
-
2023-05-03status Active
-
2023-03-31historical
-
2023-03-17$209,900 Active
-
2023-03-15historical
-
2023-02-24historical
-
2023-02-09price $210,000
-
2023-01-18price $215,000
-
2022-11-09$225,000 Active
-
2018-05-17soldstatus
-
2018-05-15soldstatus Sold
-
2018-04-23status Pending
-
2018-04-16status Option Pending
-
2018-04-11$135,000 Active
-
2001-05-01soldstatus
ⓘ Source: listings_history table (triggers on properties + properties_extension) + one-shot
backfill from property_details.listing_events for pre-trigger history.
Tax reassessment forecast TX · Resets to sale price
- Current annual tax
- $4,805 · $400/mo
- Projected year-2 tax
- $4,805 · $400/mo
- Expected delta
- $0/yr ($0/mo · 0.0%)
ⓘ Screening estimate from a state-policy table — verify with the county assessor before closing.
Climate risk First Street
- Flood 6/10 Major FEMA zone X (unshaded) · 66% chance over 30 yrs
- Wildfire 1/10 Low
- Heat 10/10 Extreme 7 d/yr ≥109°F today · 24 d/yr by 30 yrs out
- Wind 9/10 Extreme 99% chance of damaging wind over 30 yrs
- Air quality 2/10 Low 1 unhealthy d/yr today · 2 by 30 yrs out
Nearby sold comps map
Loading sold comps map…
Walkable amenities ~0.75 mi
Loading nearby amenities…
Taxation est. · year 1
- Rental income
- $18,218
- − Mortgage interest
- −$8,957
- − Property taxes
- −$4,805
- − Insurance
- −$800
- − Repairs & maintenance
- −$1,457
- − Management
- −$1,457
- − Depreciation
- −$4,652
- Taxable loss
- −$3,910
- Est. tax savings @ 24.0%
- +$939
- After-tax cash flow
- $-337/yr
For passive investors: Depreciation is non-cash, so a rental often shows a tax loss while cash-flowing — sheltering income. Rental losses are passive: they offset passive income freely, and up to $25,000/yr can offset ordinary (W-2) income if you actively participate and your MAGI is under $100k (phasing out to $0 by $150k); unused losses carry forward. On sale, claimed depreciation is recaptured at up to 25%, and gains may owe capital-gains tax (a 1031 exchange can defer both). Figures are a year-1 estimate at your 24.0% rate — not tax advice; consult a CPA.
Schools (NCES district)
- District
- Pasadena ISD
- NCES district ID
- 4834320
- Math proficiency
- 29% ▼ -17.00%
- Reading proficiency
- 32% ▼ -9.00%
- Median HH income
- $45,163
- Composite
- 26.15/100
- National rank
- #7275
- State rank
- #612 of 826 in TX
Livability — Pasadena
- Score
- 66/100
- State rank
- #600
- US rank
- #11438
Category grades
Schools grade is shown separately in the Schools card above.
Census & demographics
- Census place
- Pasadena, TX
- County
- Harris County · 4,702,590 people
- City population
- 109,190
- Metro
- Houston-The Woodlands-Sugar Land, TX
- Population (ZIP)
- 25,779
- Household income
- $51,478
- Rent vs Own
- Severe rent burden
- 1191.0
Population outlook (Harris County) Hauer SSP2
- Today (2025)
- 5,571,493 people
- By 2030
- 6,089,821 · +9.3%
- By 2040
- 7,142,806 · +28.2%
- By 2050
- 8,185,864 · +46.9%
- By 2075
- 10,574,329 · +89.8%
- By 2100
- 12,109,958 · +117.4%
Race, ethnicity, and origin ACS 2023
- Neighborhood character
- Predominantly Hispanic (66%)
- Race & ethnicity
- Hispanic / Latino 66% Two or more races 25% White 25% Black 6% Asian 2% Native American 1%
- Hispanic origin (detail)
- Mexican 46% Cuban 2%
- Common ancestry
- Italian 1% Iranian 1% Lithuanian 1%
- Foreign-born
- 22% · Canada, Jamaica
- Languages at home
- 51% English-only · Spanish 47% Other Indo-European 1% Other Asian/Pacific 1%
Political lean MEDSL · Harris
- 2024 margin
- Lean D (+5.5) · D 52.0% · R 46.4% · Other 1.6%
- 2008→2024 swing
- +3.9pp toward D · 2008: 1.6pp · 2024: 5.5pp
- All cycles
- 2024: D+5.5 2020: D+13.3 2016: D+12.4 2012: D+0.1 2008: D+1.6
Not yet ingested
- Civics
- —
Market trends
- HPI YoY
- ▼ -86.91%
- Current HPI
- 264.4782
- Rent YoY
- ▲ 1.28%
- Metro
- Houston-The Woodlands-Sugar Land, TX
- State GDP YoY
- ▲ 3.95%
- F500 in state
- 110
Industry mix (Fortune 500 HQ in TX)
| Industry | F500 HQs | Revenue |
|---|---|---|
| Energy | 16 | $1,198B |
|
||
| Technology | 5 | $198B |
|
||
| Engineering / Construction | 4 | $72B |
|
||
| Energy Services | 3 | $60B |
|
||
| Utilities | 3 | $41B |
|
||
| Healthcare | 2 | $330B |
|
||
Price history
+18.4% since first listed27 events — show timeline
- 2026-06-03 Pending — HARMLS
- 2026-05-23 Pending — HARMLS
- 2026-04-30 Listed $159,900 HARMLS
- 2026-04-29 Sold (Public Records) — Public Records
- 2026-04-11 Listing Removed — HARMLS
- 2026-03-20 Relisted — HARMLS
- 2026-03-20 Price Changed $210,000 HARMLS
- 2025-11-25 Pending — HARMLS
- 2025-11-20 Listing Removed — HARMLS
- 2025-11-18 Listed $185,000 HARMLS
- 2023-06-17 Listing Removed — HARMLS
- 2023-06-13 Relisted — HARMLS
- 2023-05-05 Listing Removed — HARMLS
- 2023-05-03 Relisted — HARMLS
- 2023-03-31 Listing Removed — HARMLS
- 2023-03-17 Listed $209,900 HARMLS
- 2023-03-15 Coming Soon — HARMLS
- 2023-02-24 Listing Removed — HARMLS
- 2023-02-09 Price Changed $210,000 HARMLS
- 2023-01-18 Price Changed $215,000 HARMLS
- 2022-11-09 Listed $225,000 HARMLS
- 2018-05-17 Sold (Public Records) — Public Records
- 2018-05-15 Sold (MLS) — HARMLS
- 2018-04-23 Pending — HARMLS
- 2018-04-16 Pending — HARMLS
- 2018-04-11 Listed $135,000 HARMLS
- 2001-05-01 Sold (Public Records) — Public Records
Property tax history
+4.6%/yrLatest (2025): $4,805 · +2.6% YoY. Source: county tax records.
Cash-flow waterfall
monthlySold comps — $/sqft
last 12 mo · ≤1 miLoading sold comps…