27960 Wheeler St · Sprague River, OR
Flood risk 1/10 · Minimal
- FEMA flood zone
- X
- Chance of flooding over 30 yrs
- 0.0%
- Est. flood insurance / yr
- $473 – $860
Fire risk 7/10 · Major
- Est. fire insurance / yr
- $498 – $926
Heat risk 3/10 · Minor
- Hot days now (above 92°F)
- 7 days/yr
- Hot days in 30 yrs
- 18 days/yr
Wind risk 1/10 · Minimal
- Chance of severe wind over 30 yrs
- —
Air-quality risk 9/10 · Severe
- Unhealthy air days now
- 20 days/yr
- Unhealthy air days in 30 yrs
- 21 days/yr
Risk factors via First Street. Map © Google.
Why this score? — see what drove the B grade
The composite is a weighted blend of 9 inputs, each scored 0–100. Each bar is that input's sub-score; the figure is the points it added to the 100-point composite (weight × sub-score).
- Cash flow +26.8/30.0
- ARV discount +15.0/15.0
- DSCR +9.2/10.0
- 1% rule +7.2/10.0
- Appreciation +6.3/10.0
- Rent growth +2.5/5.0
- Schools +2.5/10.0
- Livability +2.5/5.0
- Condition / age +1.0/5.0
$125,000
🖨 Deal sheet 📄 Offer letter ✓ Due diligence
Listing remarks MLS
Opportunity awaits in Sprague River! If you're looking for privacy, potential, and a project with land, this is it. A true fixer-upper that offers plenty of potential for the right buyer. This solid structure sits on nearly 3 acres in a quiet, remote setting with wide-open skies and room to grow. Bring your tools and vision to transform this property into a country retreat, rental, or full-time residence. There is plenty of space for animals, gardens, or additional outbuildings offering endless potential. Property is being sold as-is. Seller is highly motivated and will consider any reasonable offer--don't miss this chance to secure acreage at an incredible price.
Key facts
- Nearly 3 acres
- Room to grow
- Quiet remote setting
Tags
Neighborhood map
What this means for you Summary
Snapshot
- This is a 3-bed/1.0-bath single-family listed at $125k. Condition is rated poor.
Deal economics
- At list price, monthly cash flow is $341 ($4k/yr) — positive.
- The deal already cash-flows at list — no discount required.
- Meets the 1% rule at list price ($2k rent vs $125k).
- Recommended offer: $110k (12.0% below list) — sets the bar for market timing.
Location & tenants
- Location reads: area grade B — affects rentability + tenant quality, not the cash-flow math above.
- Klamath County SD (rural): math 21% / reading 37% proficiency, ranked #46 of 58 in OR (top 79%) — low school quality limits family demand, transient renter base, plan for 1-2y turnover.
- Market conditions: 80 active listings in the ZIP; 232 units permitted in Klamath County in 2024 (72 in 5+ unit buildings).
Forward outlook
- In year one you build about $4k of equity ($864 loan paydown + $3k appreciation (2.6% local appreciation)).
- Klamath County population projected at -12% by 2050 — secular population decline; favor cash flow + early exit over multi-decade hold.
- At projected returns (2.6% appreciation + 3.0% rent growth), your $35k cash investment doubles in ~4 years — after that, you're playing with house money.
- By year 8, paydown + projected appreciation supports a ~$31k cash-out refi (75% LTV) — recoverable capital for the next deal without selling this one.
Negotiation context
- It's been on market 121 days — a 12% lower offer ($110k) is reasonable based on typical stale-listing flexibility.
- 2 sale attempts since 24y ago with the ask held roughly flat each time — persistent listings suggest the price (not the market) is what's stuck; bring a comps-based counter.
- Current owner paid $20k; list at $125k implies a 525% gain — meaningful room to come down on a strong offer.
Risks & watch-outs
- Climate carrying-cost: major wildfire risk — expect insurance premiums to compound above CPI over the hold.
Questions for the listing agent
- It's been on market 121 days. Have you received any prior offers? Is the seller open to a 12% concession, seller financing, or rate buy-down credit?
- Have any recent inspections been done? Can we get a copy of the seller's disclosures and any deferred-maintenance estimates?
- Built in 1960 — when were the roof, HVAC, electrical panel, plumbing, and water heater last replaced?
- Why hasn't it sold? Are there any deal-killer items the seller is aware of (foundation, flood, title, zoning, code violations)?
- Is there a deadline driving the sale (1031 exchange, divorce, estate, relocation)? That informs how much negotiation room exists.
- What's the average days-on-market for RENTAL listings here right now (not sales)? A rising rental-DOM trend means longer vacancies and softer asking-rent achievability than the comps imply.
- What's the recent tenant-quality profile in this submarket — average credit score on applications, eviction rate, late-payment / NSF rate, and stable-employment percentage? A property-management company in the area should have these aggregated.
- How much new for-sale + rental construction is in the pipeline within 1–3 miles? Heavy new supply typically softens prices + rents 12–24 months out; constrained supply supports both.
Investment metrics
- 1% rule
- 1.22% ✓
- Cap rate
- 9.56%
- Cash-on-cash
- 11.68%
- DSCR
- 1.52
- GRM
- 6.8
CMA / ARV
- ARV (median comp)
- $248,749
- List price
- $125,000
- Delta
- -49.75%
- Verdict
- UNDERPRICED
- Comps
- 1 within 2.0 mi
Projected returns pro-forma
2.61% appreciation · 3.0% rent growth · sell at horizon
- IRR
- 17.5%
- Equity multiple
- 1.98×
- Total profit
- $34,194
- Equity at exit
- $53,452
- IRR
- 19.3%
- Equity multiple
- 3.70×
- Total profit
- $94,635
- Equity at exit
- $80,295
Cash invested: $35,000 (down + closing). Projections, not guarantees.
Landlord ↔ Tenant lean methodology
- Overall (STATE)
- 28 Tenant-Leaning
- State Oregon
- 28 Tenant-Leaning · D+6
- County
- — inherits STATE
- City
- — inherits STATE
ZIP-level market 97639
- Home prices YoY
- 2.6%
- Active inventory
- 80
- Price-to-rent
- 6.8×
Monthly cashflow live
- Estimated rent
- $1,525 medium interval (Pro) →
- Mortgage (P&I)
- −$656
- Tax est. 1.5%
- −$156 /mo · $1,875/yr
- Insurance
- −$52
- HOA
- −$0
- Vacancy / Maint / Mgmt
- −$320
- Net cashflow
- $341
Break-even live
UW: 25.0% down · 7.5% · 30yr · 1.5% tax · 5.0% vac · 8.0% maint · 8.0% mgmt
Financing live
Cash to close
- Down payment
- $31,250
- Closing costs
- $3,750
- Reserves months
- —
- Total cash needed
- —
Loan-product check · same deal, 3 products live
Conventional
25% down · 7.5% · 30yr
- Down + closing
- —
- Monthly P&I
- —
- Monthly cashflow
- —
- DSCR
- —
- Eligible?
- —
Personal DTI + credit; lowest rate.
DSCR
20% down · 8.5% · 30yr
- Down + closing
- —
- Monthly P&I
- —
- Monthly cashflow
- —
- DSCR
- —
- Eligible?
- —
No personal income docs; deal must DSCR.
Hard money
10% down · 12.0% · 12mo
- Down + closing
- —
- Monthly P&I
- —
- Monthly cashflow
- —
- DSCR
- —
- Eligible?
- —
Short-term bridge; refi at stabilization.
Listing history 18 events
-
2026-06-19days on market $125,000 Active 121 DOM
-
2026-06-18days on market $125,000 Active 120 DOM
-
2026-06-17days on market $125,000 Active 119 DOM
-
2026-06-16days on market $125,000 Active 118 DOM
-
2026-06-15days on market $125,000 Active 117 DOM
-
2026-06-14days on market $125,000 Active 115 DOM
-
2026-06-12days on market $125,000 Active 114 DOM
-
2026-06-09days on market $125,000 Active 111 DOM
-
2026-06-08days on market $125,000 Active 110 DOM
-
2026-06-07days on market $125,000 Active 109 DOM
-
2026-06-05days on market $125,000 Active 106 DOM
-
2026-06-02days on market $125,000 Active 104 DOM
-
2026-06-01days on market $125,000 Active 103 DOM
-
2026-05-31days on market $125,000 Active 102 DOM
-
2026-05-30days on market $125,000 Active 101 DOM
-
2026-02-18$125,000 Active 672-char remark
Show marketing remark (672 chars)
Opportunity awaits in Sprague River! If you're looking for privacy, potential, and a project with land, this is it. A true fixer-upper that offers plenty of potential for the right buyer. This solid structure sits on nearly 3 acres in a quiet, remote setting with wide-open skies and room to grow. Bring your tools and vision to transform this property into a country retreat, rental, or full-time residence. There is plenty of space for animals, gardens, or additional outbuildings offering endless potential. Property is being sold as-is. Seller is highly motivated and will consider any reasonable offer--don't miss this chance to secure acreage at an incredible price.
-
2003-01-10soldstatus $20,000 218-char remark
Show marketing remark (218 chars)
This Is A Partially Finished Fixer-upper That Is Being Sold As-is. There Is No Septic But Deq Approval For Septic Has Been Obtained. Go To Sp River Turn On Drews To Tableland Follow Electric Lines To Wheeler , Rt 1/8mi
-
2002-09-13$28,900 218-char remark
Show marketing remark (218 chars)
This Is A Partially Finished Fixer-upper That Is Being Sold As-is. There Is No Septic But Deq Approval For Septic Has Been Obtained. Go To Sp River Turn On Drews To Tableland Follow Electric Lines To Wheeler , Rt 1/8mi
ⓘ Source: listings_history table (triggers on properties + properties_extension) + one-shot
backfill from property_details.listing_events for pre-trigger history.
Climate risk First Street
- Flood 1/10 Low FEMA zone X · 0% chance over 30 yrs
- Wildfire 7/10 Severe
- Heat 3/10 Moderate 7 d/yr ≥92°F today · 18 d/yr by 30 yrs out
- Wind 1/10 Low
- Air quality 9/10 Extreme 20 unhealthy d/yr today · 21 by 30 yrs out
Nearby sold comps map
Loading sold comps map…
Walkable amenities ~0.75 mi
Loading nearby amenities…
Taxation est. · year 1
- Rental income
- $18,297
- − Mortgage interest
- −$7,002
- − Property taxes
- −$1,875
- − Insurance
- −$625
- − Repairs & maintenance
- −$1,464
- − Management
- −$1,464
- − Depreciation
- −$3,636
- Taxable income
- $2,232
- Est. tax owed @ 24.0%
- −$536
- After-tax cash flow
- $3,553/yr
For passive investors: Depreciation is non-cash, so a rental often shows a tax loss while cash-flowing — sheltering income. Rental losses are passive: they offset passive income freely, and up to $25,000/yr can offset ordinary (W-2) income if you actively participate and your MAGI is under $100k (phasing out to $0 by $150k); unused losses carry forward. On sale, claimed depreciation is recaptured at up to 25%, and gains may owe capital-gains tax (a 1031 exchange can defer both). Figures are a year-1 estimate at your 24.0% rate — not tax advice; consult a CPA.
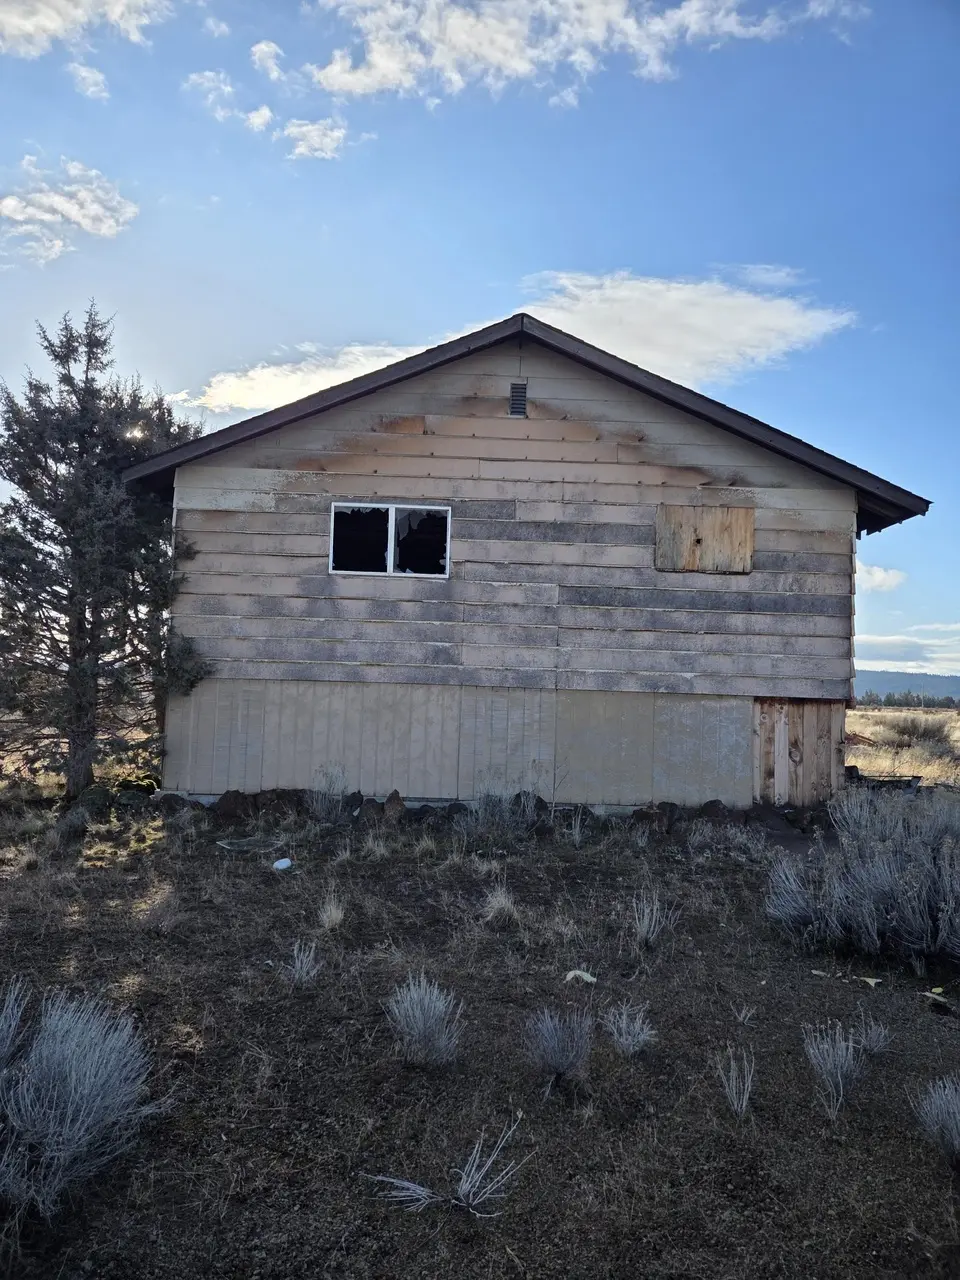
Condition & rehab AI · 12 photos
This fixer-upper requires extensive repairs and improvements to become move-in ready. Significant work is needed on the roof, exterior siding, interior walls, flooring, and HVAC systems.
Repairs flagged
- Major roof — Exposed rafters, missing shingles
- Major exterior siding — Weathered siding, missing shingles
- Major interior walls — Exposed framing, debris
- Major flooring — Exposed subfloor, debris
- Major HVAC/mechanicals — Exposed ductwork, debris
Value-add opportunities
- Both Landscaping and curb appeal improvements — Enhances property's visual appeal and marketability
- Both Roof repair and replacement — Critical to the structural integrity and safety of the property
- Both Exterior siding repair and replacement — Improves the property's appearance and energy efficiency
- Both Interior wall repair and drywall installation — Restores the property's structural integrity and creates a livable space
- Both Flooring repair and replacement — Restores the property's structural integrity and creates a livable space
- Both HVAC/mechanical repair and replacement — Ensures the property is habitable and energy-efficient
Renovation cost estimate screening
| Repair item | Severity | Est. cost |
|---|---|---|
| roof · Exposed rafters, missing shingles | Major | $15,000–50,000 |
| exterior siding · Weathered siding, missing shingles | Major | $15,000–50,000 |
| interior walls · Exposed framing, debris | Major | $15,000–50,000 |
| flooring · Exposed subfloor, debris | Major | $15,000–50,000 |
| HVAC/mechanicals · Exposed ductwork, debris | Major | $15,000–50,000 |
| Total estimated repair cost · 5 items | $75,000–250,000 |
Value-add ROI direction
- Both Landscaping and curb appeal improvements — Enhances property's visual appeal and marketability ↑
- Both Roof repair and replacement — Critical to the structural integrity and safety of the property ↑
- Both Exterior siding repair and replacement — Improves the property's appearance and energy efficiency ↑
- Both Interior wall repair and drywall installation — Restores the property's structural integrity and creates a livable space ↑
- Both Flooring repair and replacement — Restores the property's structural integrity and creates a livable space ↑
- Both HVAC/mechanical repair and replacement — Ensures the property is habitable and energy-efficient ↑
ⓘ Cost ranges are severity-bucket heuristics (US national rule-of-thumb). Get contractor quotes + a written scope before underwriting a rehab budget.
Schools (NCES district)
- District
- Klamath County SD
- NCES district ID
- 4107020
- Math proficiency
- 21% ▼ -17.00%
- Reading proficiency
- 37% ▼ -16.00%
- Median HH income
- $44,906
- Composite
- 24.83/100
- National rank
- #7593
- State rank
- #46 of 58 in OR
Livability — Sprague River
No livability data for this city. (Only ~50 U.S. cities are tracked.)
Census & demographics
- Population (ZIP)
- 9
Population outlook (Klamath County) Hauer SSP2
- Today (2025)
- 63,870 people
- By 2030
- 62,279 · -2.5%
- By 2040
- 58,891 · -7.8%
- By 2050
- 56,207 · -12.0%
- By 2075
- 51,239 · -19.8%
- By 2100
- 46,526 · -27.2%
Race, ethnicity, and origin ACS 2023
- Neighborhood character
- Predominantly White (100%)
- Race & ethnicity
- White 100%
Political lean MEDSL · Klamath
- 2024 margin
- Solid R (+41.9) · D 27.9% · R 69.8% · Other 2.4%
- 2008→2024 swing
- -8.8pp toward R · 2008: -33.1pp · 2024: -41.9pp
- All cycles
- 2024: R+41.9 2020: R+40.6 2016: R+44.8 2012: R+38.2 2008: R+33.1
Not yet ingested
- Civics
- —
Market trends
- HPI YoY
- ▲ 2.61%
- Current HPI
- 102.6475
- Rent YoY
- —
- Metro
- —
- State GDP YoY
- ▲ 2.05%
- F500 in state
- 2
Industry mix (Fortune 500 HQ in OR)
| Industry | F500 HQs | Revenue |
|---|---|---|
| Consumer Goods | 1 | $51B |
|
||
Price history
+332.5% since first listed3 events — show timeline
- 2026-02-18 Listed $125,000 MLSCO
- 2003-01-10 Sold (MLS) $20,000 MLSCO
- 2002-09-13 Listed $28,900 MLSCO
Cash-flow waterfall
monthlySold comps — $/sqft
last 12 mo · ≤1 miLoading sold comps…