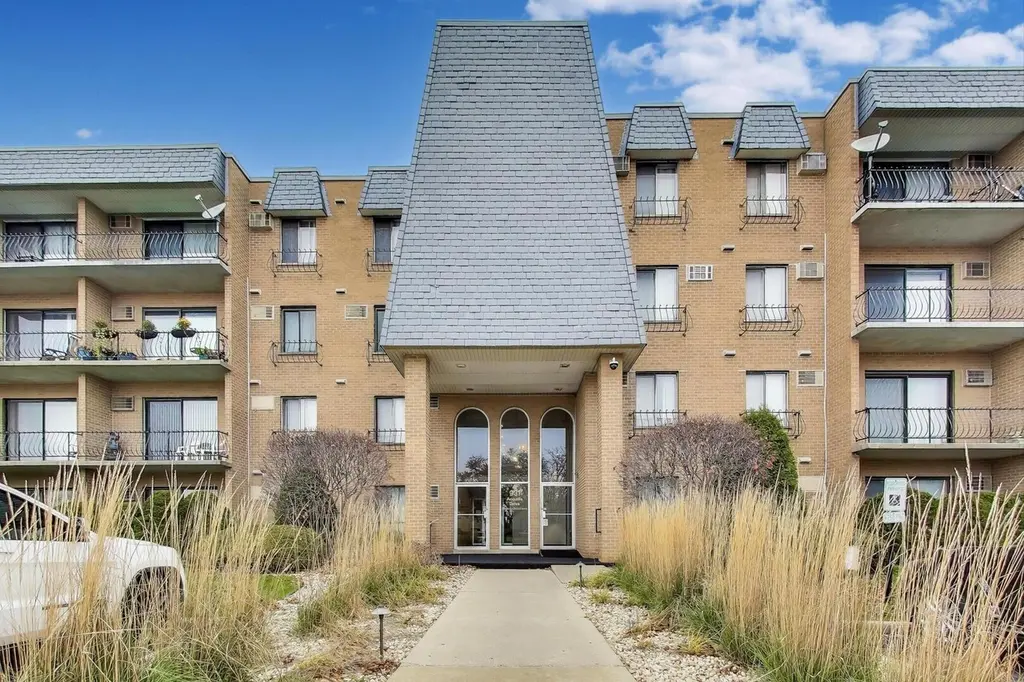
931 W Arquilla Dr #133 · Glenwood, IL
Flood risk 1/10 · Minimal
- FEMA flood zone
- X (unshaded)
- Chance of flooding over 30 yrs
- 0.0%
- Est. flood insurance / yr
- $507 – $1,088
Fire risk 2/10 · Minimal
- Est. fire insurance / yr
- $804 – $1,492
Heat risk 3/10 · Minor
- Hot days now (above 101°F)
- 7 days/yr
- Hot days in 30 yrs
- 15 days/yr
Wind risk 2/10 · Minimal
- Chance of severe wind over 30 yrs
- —
Air-quality risk 4/10 · Minor
- Unhealthy air days now
- 4 days/yr
- Unhealthy air days in 30 yrs
- 5 days/yr
Risk factors via First Street. Map © Google.
Why this score? — see what drove the C- grade
The composite is a weighted blend of 9 inputs, each scored 0–100. Each bar is that input's sub-score; the figure is the points it added to the 100-point composite (weight × sub-score).
- Cash flow +17.6/30.0
- 1% rule +10.0/10.0
- ARV discount +7.5/15.0
- DSCR +5.5/10.0
- Livability +3.3/5.0
- Rent growth +2.5/5.0
- Condition / age +2.5/5.0
- Schools +2.4/10.0
- Appreciation +0.0/10.0
$125,000
🖨 Deal sheet 📄 Offer letter ✓ Due diligence
Listing remarks
Your search is over! Step into this great condo located in a beautifully maintained and secure building. This spacious unit features 2 large bedrooms-including a primary bedroom with dual closets-and 2 full baths. The unit comes with 2 parking spaces. Enjoy comfort year-round with three wall A/C units. The generous living room opens to a semi-private balcony where you can relax and take in the peaceful, tree-lined view. No rentals and no pets are permitted in the building, ensuring a quiet and stable community. This is an estate sale. Units 133 and 113 are being sold separately but can also be purchased together as a bundle.
Key facts
- Secure building
- Tree-lined view
- Semi-private balcony
Tags
Property features AI
Finance
- Other: Managed community with commuter and school bus access and nearby train/interstate access; Located in the Glenwood Manor subdivision
- HOA & community: Monthly association fee; Association fees cover water, parking, insurance, clubhouse, pool, exterior maintenance, lawn care, refuse, and snow removal; Association amenities include coin laundry, elevators, storage, on-site manager/engineer, party room, pool, service elevator(s), tennis courts, and security door locks; On-site manager available Monday through Friday; self-management also noted; Pets not allowed
Exterior
- Parking: Two parking spaces total; Asphalt surfaces with circular driveway; On-site garage (owned); Unassigned and guest parking available; Parking lot available; Off-site parking options
- Security: Security system; Security door locks
- Utilities: Lake Michigan water source; Public sewer; Circuit breaker electric service (100 Amp); Cable available
- Home design: Attached single condo; Entry at level 1; Rehab completed in 2010; Disability access available; Building of approximately 51–60 years old
- Construction: Brick construction; Concrete perimeter foundation; Built before 1978
- Exterior features: In-ground pool; Balcony; Corner, landscaped lot
Interior
- Kitchen: Range; Microwave; Dishwasher; Refrigerator
- Bedrooms: Master bedroom on main level with full bath; Additional bedrooms (two) on main level
- Flooring: Vinyl flooring throughout listed rooms
- Bathrooms: Two full bathrooms
- Heating & cooling: Electric heating with baseboard and individual controls; Wall cooling unit(s)
- Interior features: Elevator access; First-floor full bathroom; Storage; Window screens; Five total rooms
- Laundry & utility: Common area laundry
Neighborhood map
What this means for you Summary
Snapshot
- This is a 2-bed/2.0-bath condo listed at $125k.
Deal economics
- At list price, monthly cash flow is $98 ($1k/yr) — positive.
- The deal already cash-flows at list — no discount required.
- Meets the 1% rule at list price ($2k rent vs $125k).
- Recommended offer: $121k (3.0% below list) — sets the bar for market timing.
Location & tenants
- Location reads 66/100 on livability (#545 in IL) — a middle-class / working-renter tenant base. Strengths: cost of living A+, housing A+, employment B; Watch: health & safety D+, amenities F, commute F.
- Homewood Flossmoor Chsd 233 (suburban): math 21% / reading 27% proficiency, ranked #272 of 620 in IL (top 44%) — low school quality limits family demand, transient renter base, plan for 1-2y turnover.
- Zoned schools: Homewood-Flossmoor High School (math 21% / reading 27%, grade F, #304 of 693 statewide, top 44%, 2,798 students, 0% FRL).
- Market conditions: 53 active listings in the ZIP; 1 comparable units currently listed for rent nearby; 6,272 units permitted in Cook County in 2024 (4,658 in 5+ unit buildings).
Forward outlook
- Local home prices are declining (-3.0%/yr); year-one equity from $864 of loan paydown is wiped out by about $4k of value loss. Plan a longer hold.
Negotiation context
- It's been on market 59 days — a 3% lower offer ($121k) is reasonable based on typical stale-listing flexibility.
- 3 sale attempts with the ask held roughly flat each time — persistent listings suggest the price (not the market) is what's stuck; bring a comps-based counter.
- Current owner paid $70k; list at $125k implies a 79% gain — meaningful room to come down on a strong offer.
Risks & watch-outs
- Watch-outs: property tax is 3.3% of price.
Questions for the listing agent
- It's been on market 59 days. Have you received any prior offers? Is the seller open to a 3% concession, seller financing, or rate buy-down credit?
- Built in 1970 — when were the roof, HVAC, electrical panel, plumbing, and water heater last replaced?
- Property tax is high relative to price — has the assessment been appealed recently, and will the sale trigger a re-assessment?
- What does the HOA fee cover, when was the last increase, and are there any pending special assessments or reserve-fund shortfalls?
- Any open or pending special assessments — roof, HVAC, plumbing, elevator, façade? What's the per-unit balance and payoff schedule, and is the seller paying it off at close or rolling it to the buyer?
- Is there a deadline driving the sale (1031 exchange, divorce, estate, relocation)? That informs how much negotiation room exists.
- Schools are F-rated, which usually means shorter tenancies and higher turnover. Who's the typical renter profile here, and what's been the actual vacancy rate?
- What's the average days-on-market for RENTAL listings here right now (not sales)? A rising rental-DOM trend means longer vacancies and softer asking-rent achievability than the comps imply.
- What's the recent tenant-quality profile in this submarket — average credit score on applications, eviction rate, late-payment / NSF rate, and stable-employment percentage? A property-management company in the area should have these aggregated.
- How much new apartment / multifamily construction is in the pipeline within 1–3 miles? Heavy new supply (>2% of stock underway) typically softens rents 12–24 months out; light construction supports rent growth.
Investment metrics
- 1% rule
- 1.52% ✓
- Cap rate
- 7.23%
- Cash-on-cash
- 3.35%
- DSCR
- 1.15
- GRM
- 5.5
CMA / ARV
No comps found within radius.
Projected returns pro-forma
-3.0% appreciation · 3.0% rent growth · sell at horizon
- IRR
- -10.7%
- Equity multiple
- 0.61×
- Total profit
- $-13,676
- Equity at exit
- $18,638
- IRR
- -1.0%
- Equity multiple
- 0.93×
- Total profit
- $-2,438
- Equity at exit
- $10,808
Cash invested: $35,000 (down + closing). Projections, not guarantees.
Landlord ↔ Tenant lean methodology
- Overall (STATE)
- 43 Moderately Tenant-Leaning
- State Illinois
- 43 Moderately Tenant-Leaning · D+7
- County
- — inherits STATE
- City
- — inherits STATE
ZIP-level market 60425
- Home prices YoY
- -10.6%
- Active inventory
- 53
- Price-to-rent
- 5.5×
Monthly cashflow live
- Estimated rent
- $1,900 medium interval (Pro) →
- Mortgage (P&I)
- −$656
- Tax from tax record
- −$340 /mo · $4,077/yr
- Insurance
- −$52
- HOA
- −$356
- Vacancy / Maint / Mgmt
- −$399
- Net cashflow
- $98
Break-even live
UW: 25.0% down · 7.5% · 30yr · 1.5% tax · 5.0% vac · 8.0% maint · 8.0% mgmt
Financing live
Cash to close
- Down payment
- $31,250
- Closing costs
- $3,750
- Reserves months
- —
- Total cash needed
- —
Loan-product check · same deal, 3 products live
Conventional
25% down · 7.5% · 30yr
- Down + closing
- —
- Monthly P&I
- —
- Monthly cashflow
- —
- DSCR
- —
- Eligible?
- —
Personal DTI + credit; lowest rate.
DSCR
20% down · 8.5% · 30yr
- Down + closing
- —
- Monthly P&I
- —
- Monthly cashflow
- —
- DSCR
- —
- Eligible?
- —
No personal income docs; deal must DSCR.
Hard money
10% down · 12.0% · 12mo
- Down + closing
- —
- Monthly P&I
- —
- Monthly cashflow
- —
- DSCR
- —
- Eligible?
- —
Short-term bridge; refi at stabilization.
Rent comps 1 comps
| Address | Beds | Baths | Sqft | Rent | $/sqft | DOM | Units | Dist |
|---|---|---|---|---|---|---|---|---|
| 44 N Glenwood Ave Glenwood, IL | 1.0 | 1.0 | 700 | $1,900 | $2.71 | 1d | 1 | 1.11mi |
HOA detail condo
- Monthly dues
- $356 · $4,272/yr
- Assessments
- None detected in remarks — confirm with the listing agent.
Listing history 20 events
-
2026-06-18days on market $125,000 Active 59 DOM
-
2026-06-17days on market $125,000 Active 58 DOM
-
2026-06-16days on market $125,000 Active 57 DOM
-
2026-06-15days on market $125,000 Active 56 DOM
-
2026-06-13days on market $125,000 Active 54 DOM
-
2026-06-09days on market $125,000 Active 50 DOM
-
2026-06-08days on market $125,000 Active 49 DOM
-
2026-06-07days on market $125,000 Active 48 DOM
-
2026-06-04days on market $125,000 Active 45 DOM
-
2026-06-03days on market $125,000 Active 44 DOM
-
2026-06-02days on market $125,000 Active 43 DOM
-
2026-06-01days on market $125,000 Active 42 DOM
-
2026-05-31days on market $125,000 Active 41 DOM
-
2026-04-20historical
-
2026-04-20$125,000 Active
-
2026-04-12status Active
-
2026-03-14historical Contingent - Continue to Show
-
2025-11-24Active
-
2001-12-27soldstatus $70,000
-
1999-10-08soldstatus $66,000
ⓘ Source: listings_history table (triggers on properties + properties_extension) + one-shot
backfill from property_details.listing_events for pre-trigger history.
Tax reassessment forecast IL · Partial reset (capped growth)
- Current annual tax
- $4,077 · $340/mo
- Projected year-2 tax
- $4,077 · $340/mo
- Expected delta
- $0/yr ($0/mo · 0.0%)
ⓘ Screening estimate from a state-policy table — verify with the county assessor before closing.
Climate risk First Street
- Flood 1/10 Low FEMA zone X (unshaded) · 0% chance over 30 yrs
- Wildfire 2/10 Low
- Heat 3/10 Moderate 7 d/yr ≥101°F today · 15 d/yr by 30 yrs out
- Wind 2/10 Low
- Air quality 4/10 Moderate 4 unhealthy d/yr today · 5 by 30 yrs out
Nearby sold comps map
Loading sold comps map…
Walkable amenities ~0.75 mi
Loading nearby amenities…
Taxation est. · year 1
- Rental income
- $22,800
- − Mortgage interest
- −$7,002
- − Property taxes
- −$4,077
- − Insurance
- −$625
- − Repairs & maintenance
- −$1,824
- − Management
- −$1,824
- − HOA
- −$4,272
- − Depreciation
- −$3,636
- Taxable loss
- −$460
- Est. tax savings @ 24.0%
- +$111
- After-tax cash flow
- $1,282/yr
For passive investors: Depreciation is non-cash, so a rental often shows a tax loss while cash-flowing — sheltering income. Rental losses are passive: they offset passive income freely, and up to $25,000/yr can offset ordinary (W-2) income if you actively participate and your MAGI is under $100k (phasing out to $0 by $150k); unused losses carry forward. On sale, claimed depreciation is recaptured at up to 25%, and gains may owe capital-gains tax (a 1031 exchange can defer both). Figures are a year-1 estimate at your 24.0% rate — not tax advice; consult a CPA.
Schools (NCES district)
- District
- Homewood Flossmoor Chsd 233
- NCES district ID
- 1719560
- Math proficiency
- 21% ▼ -15.00%
- Reading proficiency
- 27% ▼ -13.00%
- Median HH income
- $83,564
- Composite
- 24.42/100
- National rank
- #7681
- State rank
- #272 of 620 in IL
Livability — Glenwood
- Score
- 66/100
- State rank
- #545
- US rank
- #11292
Category grades
Schools grade is shown separately in the Schools card above.
Census & demographics
- Census place
- Glenwood, IL
- City population
- 8,730
- Population (ZIP)
- 8,730
Population outlook (Cook County) Hauer SSP2
- Today (2025)
- 5,347,519 people
- By 2030
- 5,357,703 · +0.2%
- By 2040
- 5,324,924 · -0.4%
- By 2050
- 5,230,762 · -2.2%
- By 2075
- 4,785,735 · -10.5%
- By 2100
- 4,188,836 · -21.7%
Race, ethnicity, and origin ACS 2023
- Neighborhood character
- Predominantly Black (68%)
- Race & ethnicity
- Black 68% White 22% Hispanic / Latino 6% Two or more races 4%
- Hispanic origin (detail)
- Mexican 5%
- Common ancestry
- Romanian 3% Iranian 1% Lithuanian 1%
- Foreign-born
- 3% · Canada
- Languages at home
- 95% English-only · Spanish 4%
Political lean MEDSL · Cook
- 2024 margin
- Solid D (+42.0) · D 70.4% · R 28.4% · Other 1.2%
- 2008→2024 swing
- -11.4pp toward R · 2008: 53.4pp · 2024: 42.0pp
- All cycles
- 2024: D+42.0 2020: D+50.3 2016: D+53.0 2012: D+49.4 2008: D+53.4
Not yet ingested
- Civics
- —
Market trends
- HPI YoY
- ▼ -37.24%
- Current HPI
- 314.1777
- Rent YoY
- —
- Metro
- —
- State GDP YoY
- ▲ 1.59%
- F500 in state
- 60
Industry mix (Fortune 500 HQ in IL)
| Industry | F500 HQs | Revenue |
|---|---|---|
| Insurance | 4 | $201B |
|
||
| Consumer Goods | 4 | $87B |
|
||
| Industrial Machinery | 3 | $64B |
|
||
| Healthcare | 2 | $55B |
|
||
| Retail / Pharmacy | 1 | $148B |
|
||
| Agriculture / Food | 1 | $86B |
|
||
Price history
+89.4% since first listed7 events — show timeline
- 2026-04-20 Listed $125,000 MRED as Distributed by MLS Grid
- 2026-04-20 Listing Removed — MRED as Distributed by MLS Grid
- 2026-04-12 Relisted — MRED as Distributed by MLS Grid
- 2026-03-14 Contingent — MRED as Distributed by MLS Grid
- 2025-11-24 Listed — MRED as Distributed by MLS Grid
- 2001-12-27 Sold (Public Records) $70,000 Public Records
- 1999-10-08 Sold (Public Records) $66,000 Public Records
Property tax history
+3.2%/yrLatest (2023): $4,077 · +64.8% YoY. Source: county tax records.
Cash-flow waterfall
monthlySold comps — $/sqft
last 12 mo · ≤1 miLoading sold comps…