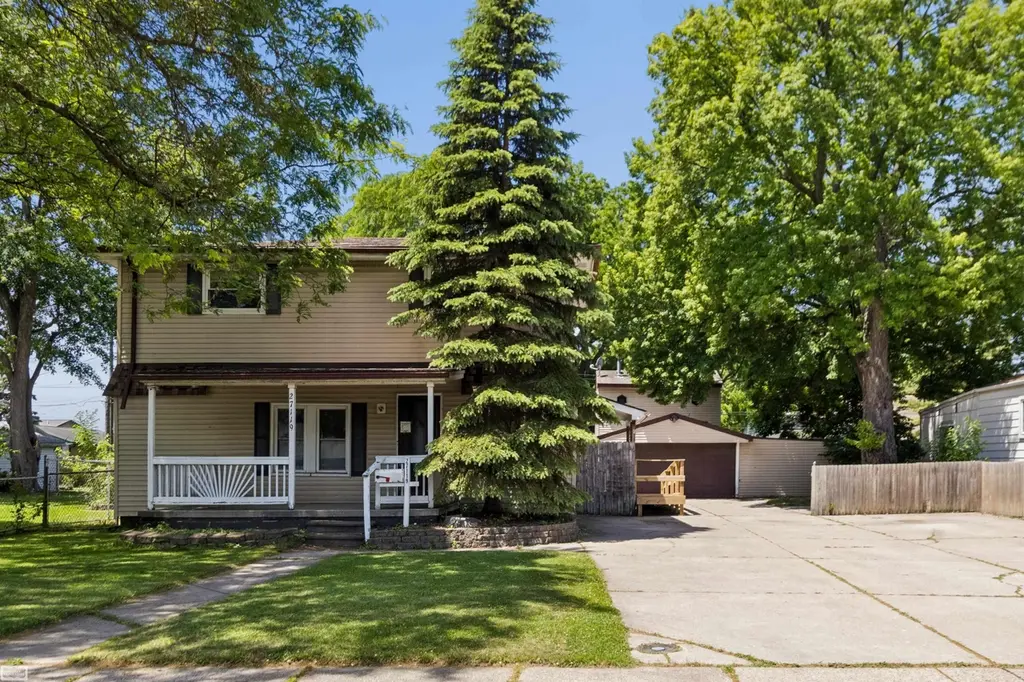
27119 Blum St · Roseville, MI
Flood risk 1/10 · Minimal
- FEMA flood zone
- X (unshaded)
- Chance of flooding over 30 yrs
- 0.0%
- Est. flood insurance / yr
- $507 – $1,088
Fire risk 1/10 · Minimal
- Est. fire insurance / yr
- $784 – $1,456
Heat risk 3/10 · Minor
- Hot days now (above 96°F)
- 7 days/yr
- Hot days in 30 yrs
- 15 days/yr
Wind risk 1/10 · Minimal
- Chance of severe wind over 30 yrs
- —
Air-quality risk 3/10 · Minor
- Unhealthy air days now
- 3 days/yr
- Unhealthy air days in 30 yrs
- 4 days/yr
Risk factors via First Street. Map © Google.
Why this score? — see what drove the B grade
The composite is a weighted blend of 9 inputs, each scored 0–100. Each bar is that input's sub-score; the figure is the points it added to the 100-point composite (weight × sub-score).
- Cash flow +30.0/30.0
- ARV discount +14.2/15.0
- 1% rule +10.0/10.0
- DSCR +10.0/10.0
- Livability +3.6/5.0
- Rent growth +2.6/5.0
- Condition / age +2.5/5.0
- Schools +1.5/10.0
- Appreciation +0.0/10.0
$179,000
🖨 Deal sheet 📄 Offer letter ✓ Due diligence
Listing remarks MLS
Packed with potential, this property's standout feature is the impressive garage setup, complete with workshop area in back and storage/work area on side, also. Loft area above garage with stairs in back of garage. The oversized driveway offers abundant parking. Home features a newer Roof (2024) and Furnace (2019). With some TLC, this home presents a great opportunity if you're seeking space, functionality and the chance to customize to your vision. Sold As Is.
Key facts
- Workshop area
- Oversized driveway
- Loft area
Tags
Property features AI
Finance
- HOA & community: Homeowners association present
Exterior
- Parking: Detached garage with approximately 2.5 car spaces
- Utilities: Public water; Public sewer
- Home design: Single-family residence; Two levels
- Construction: Vinyl siding; Built using crawl space foundation
- Exterior features: Patio; Porch; Fenced yard; Workshop
Interior
- Kitchen: Dishwasher; Microwave; Oven; Range; Refrigerator
- Bathrooms: Two full bathrooms
- Heating & cooling: Central air; Ceiling fans; Forced air heating; Natural gas heating
- Interior features: Gas fireplace; Crawl space basement; Seven total rooms
- Laundry & utility: Washer; Dryer
Neighborhood map
What this means for you Summary
Snapshot
- This is a 4-bed/2.0-bath single-family listed at $179k.
Deal economics
- At list price, monthly cash flow is $1k ($17k/yr) — positive.
- The deal already cash-flows at list — no discount required.
- Meets the 1% rule at list price ($3k rent vs $179k).
- Cap rate 16.0% vs local median 6.0% in Roseville — top-decile yield for the area; either an underpriced asset or a hidden risk that comps aren't pricing in. Stress-test before assuming the spread holds.
Location & tenants
- Location reads 72/100 on livability (#258 in MI) — a middle-class / working-renter tenant base. Strengths: commute A+, cost of living A+, housing A+; Watch: health & safety D+, employment D, schools F.
- Roseville Community Schools (suburban): math 11% / reading 24% proficiency, ranked #483 of 540 in MI (top 89%) — low school quality limits family demand, transient renter base, plan for 1-2y turnover; 60% free/reduced lunch — lower-income household profile, screen leases tightly.
- Market conditions: Rents flat; 265 active listings in the ZIP; 3 comparable units currently listed for rent nearby; rentals leasing fast (median 4d on market — plan ~1-2 weeks tenant-placement turnaround); 1,321 units permitted in Macomb County in 2024 (86 in 5+ unit buildings).
- At $3,423/mo this rent would consume 66% of the median local household income ($62k/yr) (locally 1712% of renters already pay >50% of income on rent) — very limited rent-growth headroom before tenants either downsize or default.
Forward outlook
- Local home prices are declining (-3.0%/yr); year-one equity from $1k of loan paydown is wiped out by about $5k of value loss. Plan a longer hold.
- Macomb County population projected at +9% by 2050 — modest demand growth; plan on rents tracking national, not racing it.
- At projected returns (-3.0% appreciation + 0.4% rent growth), your $50k cash investment doubles in ~4 years — after that, you're playing with house money.
Negotiation context
- Only 7 days on market — expect competitive offers; lowballing is unlikely to land.
- 4 sale attempts since 13y ago with the ask held roughly flat each time — persistent listings suggest the price (not the market) is what's stuck; bring a comps-based counter.
- Current owner paid $44k; list at $179k implies a 307% gain — meaningful room to come down on a strong offer.
Risks & watch-outs
- Watch-outs: built in 1942 — expect roof / HVAC / electrical / plumbing capex.
Questions for the listing agent
- Built in 1942 — when were the roof, HVAC, electrical panel, plumbing, and water heater last replaced?
- Is there a deadline driving the sale (1031 exchange, divorce, estate, relocation)? That informs how much negotiation room exists.
- Schools are F-rated, which usually means shorter tenancies and higher turnover. Who's the typical renter profile here, and what's been the actual vacancy rate?
- Crime grade is F in this area — have there been break-ins, vandalism, or insurance claims at this property in the last 3 years? What carrier currently insures it and at what premium?
- What's the average days-on-market for RENTAL listings here right now (not sales)? A rising rental-DOM trend means longer vacancies and softer asking-rent achievability than the comps imply.
- What's the recent tenant-quality profile in this submarket — average credit score on applications, eviction rate, late-payment / NSF rate, and stable-employment percentage? A property-management company in the area should have these aggregated.
- How much new for-sale + rental construction is in the pipeline within 1–3 miles? Heavy new supply typically softens prices + rents 12–24 months out; constrained supply supports both.
Investment metrics
- 1% rule
- 1.91% ✓
- Cap rate
- 16.01%
- Cash-on-cash
- 34.70%
- DSCR
- 2.54
- GRM
- 4.4
CMA / ARV
- ARV (on-the-fly)
- $210,120
- Comps found
- 12
Show comp detail 12 sales within ~0.75 mi
| Address | Dist | Beds/Ba | Sqft | Sold | Price | $/sf | Match |
|---|---|---|---|---|---|---|---|
| 26241 Janet Ct | 0.46mi | 3/1.5 (-1) | 2,016 (-1%) | 6mo | $207,000 | $103 | 65 |
| 28260 Edward St | 0.71mi | 3/2.0 (-1) | 2,035 (-0%) | 1mo | $234,000 | $115 | 61 |
| 16531 Frazho Rd | 0.57mi | 3/2.0 (-1) | 2,016 (-1%) | 7mo | $210,000 | $104 | 61 |
| 17456 Allen St | 0.61mi | 4/1.0 | 2,066 (+1%) | 7mo | $176,000 | $85 | 59 |
| 16141 Lois Dr | 0.66mi | 3/2.0 (-1) | 2,000 (-2%) | 4mo | $200,000 | $100 | 58 |
| 16240 Guest Ct | 0.45mi | 3/2.5 (-1) | 1,900 (-7%) | 8mo | $320,000 | $168 | 54 |
| 27334 Perry St | 0.54mi | 3/1.0 (-1) | 2,218 (+9%) | 0mo | $210,000 | $95 | 51 |
| 15716 Alsip St | 0.49mi | 3/2.0 (-1) | 2,236 (+10%) | 7mo | $197,000 | $88 | 50 |
| 17111 Mayfield St | 0.56mi | 3/2.0 (-1) | 2,189 (+7%) | 8mo | $205,000 | $94 | 50 |
| 28567 Citation Dr | 0.74mi | 3/1.5 (-1) | 2,160 (+6%) | 3mo | $217,000 | $100 | 46 |
| 15569 Alsip St | 0.58mi | 3/1.5 (-1) | 1,751 (-14%) | 0mo | $220,000 | $126 | 42 |
| 28259 Floral St | 0.62mi | 3/1.5 (-1) | 1,745 (-14%) | 1mo | $200,000 | $115 | 40 |
Match score weights: distance 35% · size 25% · config 20% · recency 20%. Top-matched comps best support the ARV.
Projected returns pro-forma
-3.0% appreciation · 0.39% rent growth · sell at horizon
- IRR
- 27.2%
- Equity multiple
- 2.09×
- Total profit
- $54,606
- Equity at exit
- $26,689
- IRR
- 33.1%
- Equity multiple
- 3.64×
- Total profit
- $132,548
- Equity at exit
- $15,477
Cash invested: $50,120 (down + closing). Projections, not guarantees.
Landlord ↔ Tenant lean methodology
- Overall (STATE)
- 62 Landlord-Friendly
- State Michigan
- 62 Landlord-Friendly · EVEN
- County
- — inherits STATE
- City
- — inherits STATE
ZIP-level market 48066
- Rents YoY
- 0.4%
- Active inventory
- 265
- Price-to-rent
- 4.4×
Monthly cashflow live
- Estimated rent
- $3,423 medium interval (Pro) →
- Mortgage (P&I)
- −$939
- Tax from tax record
- −$242 /mo · $2,900/yr
- Insurance
- −$75
- HOA
- −$0
- Vacancy / Maint / Mgmt
- −$719
- Net cashflow
- $1,449
Break-even live
UW: 25.0% down · 7.5% · 30yr · 1.5% tax · 5.0% vac · 8.0% maint · 8.0% mgmt
Financing live
Cash to close
- Down payment
- $44,750
- Closing costs
- $5,370
- Reserves months
- —
- Total cash needed
- —
Loan-product check · same deal, 3 products live
Conventional
25% down · 7.5% · 30yr
- Down + closing
- —
- Monthly P&I
- —
- Monthly cashflow
- —
- DSCR
- —
- Eligible?
- —
Personal DTI + credit; lowest rate.
DSCR
20% down · 8.5% · 30yr
- Down + closing
- —
- Monthly P&I
- —
- Monthly cashflow
- —
- DSCR
- —
- Eligible?
- —
No personal income docs; deal must DSCR.
Hard money
10% down · 12.0% · 12mo
- Down + closing
- —
- Monthly P&I
- —
- Monthly cashflow
- —
- DSCR
- —
- Eligible?
- —
Short-term bridge; refi at stabilization.
Rent comps 3 comps
| Address | Beds | Baths | Sqft | Rent | $/sqft | DOM | Units | Dist |
|---|---|---|---|---|---|---|---|---|
| 28232 Floral St Unit 1032343P Roseville, MI | 3.0 | 1.0 | 1496 | $6,605 | $4.42 | 12d | 1 | 0.64mi |
| 27284 Bunert Rd Warren, MI | 3.0 | 1.0 | 2209 | $2,300 | $1.04 | 1d | 1 | 1.29mi |
| 25530 Huron St Roseville, MI | 3.0 | 2.0 | 2024 | $1,600 | $0.79 | 3d | 1 | 1.41mi |
Listing history 6 events
-
2026-06-18days on market $179,000 Active 7 DOM
-
2026-06-17days on market $179,000 Active 6 DOM
-
2026-06-16days on market $179,000 Active 5 DOM
-
2026-06-15days on market $179,000 Active 4 DOM
-
2026-06-13remarks 465-char remark
-
2026-06-13$179,000 Active 2 DOM
ⓘ Source: listings_history table (triggers on properties + properties_extension) + one-shot
backfill from property_details.listing_events for pre-trigger history.
Tax reassessment forecast MI · Partial reset (capped growth)
- Current annual tax
- $2,900 · $242/mo
- Projected year-2 tax
- $2,900 · $242/mo
- Expected delta
- $0/yr ($0/mo · -0.0%)
ⓘ Screening estimate from a state-policy table — verify with the county assessor before closing.
Climate risk First Street
- Flood 1/10 Low FEMA zone X (unshaded) · 0% chance over 30 yrs
- Wildfire 1/10 Low
- Heat 3/10 Moderate 7 d/yr ≥96°F today · 15 d/yr by 30 yrs out
- Wind 1/10 Low
- Air quality 3/10 Moderate 3 unhealthy d/yr today · 4 by 30 yrs out
Nearby sold comps map
Loading sold comps map…
Walkable amenities ~0.75 mi
Loading nearby amenities…
Taxation est. · year 1
- Rental income
- $41,079
- − Mortgage interest
- −$10,027
- − Property taxes
- −$2,900
- − Insurance
- −$895
- − Repairs & maintenance
- −$3,286
- − Management
- −$3,286
- − Depreciation
- −$5,207
- Taxable income
- $15,477
- Est. tax owed @ 24.0%
- −$3,714
- After-tax cash flow
- $13,678/yr
For passive investors: Depreciation is non-cash, so a rental often shows a tax loss while cash-flowing — sheltering income. Rental losses are passive: they offset passive income freely, and up to $25,000/yr can offset ordinary (W-2) income if you actively participate and your MAGI is under $100k (phasing out to $0 by $150k); unused losses carry forward. On sale, claimed depreciation is recaptured at up to 25%, and gains may owe capital-gains tax (a 1031 exchange can defer both). Figures are a year-1 estimate at your 24.0% rate — not tax advice; consult a CPA.
Schools (NCES district)
- District
- Roseville Community Schools
- NCES district ID
- 2630210
- Math proficiency
- 11% ▼ -8.00%
- Reading proficiency
- 24% ▼ -7.00%
- Median HH income
- $41,590
- Composite
- 14.98/100
- National rank
- #9363
- State rank
- #483 of 540 in MI
Livability — Roseville
- Score
- 72/100
- State rank
- #258
- US rank
- #6400
Category grades
Schools grade is shown separately in the Schools card above.
Census & demographics
- Census place
- Roseville, MI
- County
- Macomb County · 638,552 people
- City population
- 47,123
- Metro
- Detroit-Warren-Dearborn, MI
- Population (ZIP)
- 47,123
- Household income
- $62,182
- Rent vs Own
- Severe rent burden
- 1712.0
Population outlook (Macomb County) Hauer SSP2
- Today (2025)
- 925,296 people
- By 2030
- 948,226 · +2.5%
- By 2040
- 983,961 · +6.3%
- By 2050
- 1,010,200 · +9.2%
- By 2075
- 1,076,222 · +16.3%
- By 2100
- 1,077,065 · +16.4%
Race, ethnicity, and origin ACS 2023
- Neighborhood character
- Predominantly White (65%)
- Race & ethnicity
- White 65% Black 23% Two or more races 7% Hispanic / Latino 4% Asian 2%
- Common ancestry
- Romanian 12% Lithuanian 4% Slovak 2%
- Foreign-born
- 5% · Canada
- Languages at home
- 93% English-only · Spanish 2% Russian/Polish/Slavic 1% Other Indo-European 1%
Political lean MEDSL · Macomb
- 2024 margin
- R (+13.7) · D 42.2% · R 55.9% · Other 1.9%
- 2008→2024 swing
- -22.3pp toward R · 2008: 8.6pp · 2024: -13.7pp
- All cycles
- 2024: R+13.7 2020: R+8.1 2016: R+11.6 2012: D+4.0 2008: D+8.6
Not yet ingested
- Civics
- —
Market trends
- HPI YoY
- ▼ -232.95%
- Current HPI
- 217.4171
- Rent YoY
- ▲ 0.39%
- Metro
- Detroit-Warren-Dearborn, MI
- State GDP YoY
- ▲ 1.37%
- F500 in state
- 28
Industry mix (Fortune 500 HQ in MI)
| Industry | F500 HQs | Revenue |
|---|---|---|
| Automotive Parts | 3 | $48B |
|
||
| Automotive | 2 | $372B |
|
||
| Chemicals | 1 | $45B |
|
||
| Automotive Retail | 1 | $29B |
|
||
| Healthcare / Medical Devices | 1 | $23B |
|
||
| Automotive Technology | 1 | $20B |
|
||
Price history
+353.2% since first listed10 events — show timeline
- 2026-06-11 Listed $179,000 REALCOMP
- 2026-06-11 Listed $179,000 MiRealSource-MiMLS
- 2026-06-10 Coming Soon $179,000 MiRealSource-MiMLS
- 2013-12-14 Sold (Public Records) $44,000 Public Records
- 2013-11-18 Sold (MLS) $44,000 REALCOMP
- 2013-11-18 Sold (MLS) $44,000 MiRealSource-MiMLS
- 2013-06-24 Listed $39,500 REALCOMP
- 2013-06-24 Listing Removed — REALCOMP
- 2013-06-24 Listed $39,500 MiRealSource-MiMLS
- 2013-06-24 Listing Removed — MiRealSource-MiMLS
Property tax history
+3.6%/yrLatest (2025): $2,900 · +4.3% YoY. Source: county tax records.
Cash-flow waterfall
monthlySold comps — $/sqft
last 12 mo · ≤1 miLoading sold comps…