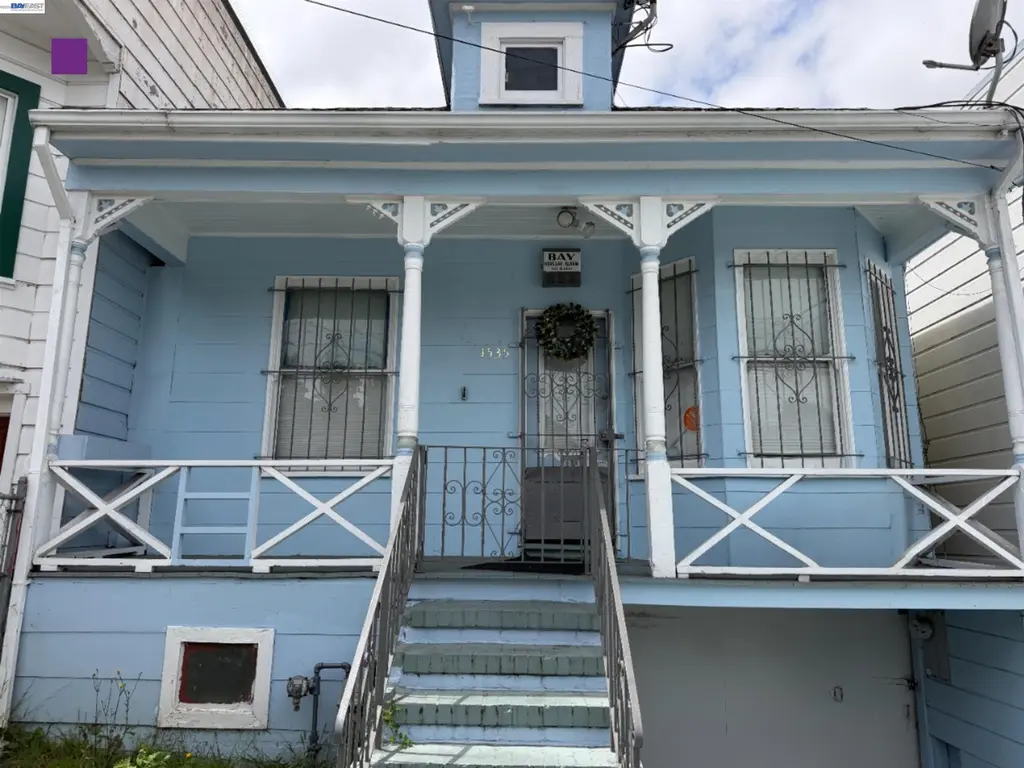
1535 Mckinnon Ave · San Francisco, CA
Flood risk 1/10 · Minimal
- FEMA flood zone
- X (unshaded)
- Chance of flooding over 30 yrs
- 0.0%
- Est. flood insurance / yr
- $507 – $1,088
Fire risk 1/10 · Minimal
- Est. fire insurance / yr
- $659 – $1,223
Heat risk 2/10 · Minimal
- Hot days now (above 80°F)
- 7 days/yr
- Hot days in 30 yrs
- 15 days/yr
Wind risk 1/10 · Minimal
- Chance of severe wind over 30 yrs
- —
Air-quality risk 7/10 · Major
- Unhealthy air days now
- 13 days/yr
- Unhealthy air days in 30 yrs
- 13 days/yr
Risk factors via First Street. Map © Google.
Why this score? — see what drove the C grade
The composite is a weighted blend of 9 inputs, each scored 0–100. Each bar is that input's sub-score; the figure is the points it added to the 100-point composite (weight × sub-score).
- Cash flow +23.1/30.0
- ARV discount +7.5/15.0
- DSCR +7.4/10.0
- Schools +5.0/10.0
- 1% rule +4.7/10.0
- Livability +3.8/5.0
- Rent growth +2.5/5.0
- Condition / age +2.5/5.0
- Appreciation +0.0/10.0
$499,998
🖨 Deal sheet 📄 Offer letter ✓ Due diligence
Listing remarks
Absolute Bargain! Unbelievable price! Hurry it won't last long at this LOW, LOW, PRICE! Finally, an Opportunity to BUY an Affordable Home in San Francisco! 35 minute bike ride to Downtown San Francisco and 20 minute bike ride to the China Basin. Don't miss this Golden Opportunity for a Fantastic Deal in a up and coming neighborhood. Offers are DUE ON WEDNESDAY, JUNE 17TH BY 12:00 NOON.
Key facts
- 2,495 sq ft lot
- 2 garage spots
- Built 1900
Tags
Property features AI
Exterior
- Parking: 2 garage spaces; 2 covered spaces; Off-street parking; Below-building parking; Garage faces front
- Utilities: Public water; Public sewer
- Home design: Single family residence; Residential property; Built in 1900
- Construction: Wood siding construction
- Exterior features: Front yard; Back yard; Level lot
Interior
- Kitchen: Free-standing range; Refrigerator
- Bedrooms: 5 total rooms (bedroom count not specified)
- Flooring: Carpet; Wood
- Bathrooms: 1 full bathroom
- Heating & cooling: Natural gas heating
- Interior features: No additional rooms listed
- Laundry & utility: Laundry in garage; Gas water heater
Neighborhood map
What this means for you Summary
Snapshot
- This is a 3-bed/1.0-bath single-family listed at $500k.
Deal economics
- At list price, monthly cash flow is $893 ($11k/yr) — positive.
- The deal already cash-flows at list — no discount required.
- To meet the 1% rule (rent ≥ 1% of price), the offer needs to be $484k (3.3% below list).
- Recommended offer: $484k (3.3% below list) — sets the bar for 1% rule.
- Cap rate 8.4% vs local median 2.1% in San Francisco — top-decile yield for the area; either an underpriced asset or a hidden risk that comps aren't pricing in. Stress-test before assuming the spread holds.
Location & tenants
- Location reads 76/100 on livability (#90 in CA, #3,143 nationally) — a middle-class / working-renter tenant base. Strengths: amenities A+, commute A+, employment A+; Watch: crime F, cost of living F.
- San Francisco Unified (urban): math 50% / reading 56% proficiency, ranked #322 of 1,400 in CA (top 23%) — acceptable for families but not a draw, mixed tenant base, ~2y average lease.
- Market conditions: 93 active listings in the ZIP; 17 comparable units currently listed for rent nearby; rentals at typical pace (median 24d on market — plan ~3-4 weeks tenant-placement turnaround); 47% of comp listings sitting > 30 days — soft ceiling on asking rent; solid renter incomes; 750 units permitted in San Francisco County in 2024 (688 in 5+ unit buildings).
- At $4,837/mo this rent would consume 72% of the median local household income ($81k/yr) (locally 1605% of renters already pay >50% of income on rent) — very limited rent-growth headroom before tenants either downsize or default.
Forward outlook
- Local home prices are declining (-3.0%/yr); year-one equity from $3k of loan paydown is wiped out by about $15k of value loss. Plan a longer hold.
- San Francisco County population projected at +39% by 2050 — long-run rental-demand tailwind backs the buy-and-hold thesis.
Negotiation context
- It's been on market 20 days — a 2% lower offer ($492k) is reasonable based on typical stale-listing flexibility.
Risks & watch-outs
- Watch-outs: built in 1900 — expect roof / HVAC / electrical / plumbing capex.
Questions for the listing agent
- Built in 1900 — when were the roof, HVAC, electrical panel, plumbing, and water heater last replaced?
- Is there a deadline driving the sale (1031 exchange, divorce, estate, relocation)? That informs how much negotiation room exists.
- Schools are B-rated — typically a magnet for longer-tenancy family renters. What's the average tenant stay here, and is there a school-zone premium baked into asking?
- Crime grade is F in this area — have there been break-ins, vandalism, or insurance claims at this property in the last 3 years? What carrier currently insures it and at what premium?
- What's the average days-on-market for RENTAL listings here right now (not sales)? A rising rental-DOM trend means longer vacancies and softer asking-rent achievability than the comps imply.
- What's the recent tenant-quality profile in this submarket — average credit score on applications, eviction rate, late-payment / NSF rate, and stable-employment percentage? A property-management company in the area should have these aggregated.
- How much new for-sale + rental construction is in the pipeline within 1–3 miles? Heavy new supply typically softens prices + rents 12–24 months out; constrained supply supports both.
Investment metrics
- 1% rule
- 0.97% ✗
- Cap rate
- 8.44%
- Cash-on-cash
- 7.65%
- DSCR
- 1.34
- GRM
- 8.6
CMA / ARV
- ARV (on-the-fly)
- $1,033,916
- Comps found
- 12
Show comp detail 12 sales within ~0.75 mi
| Address | Dist | Beds/Ba | Sqft | Sold | Price | $/sf | Match |
|---|---|---|---|---|---|---|---|
| 1500 Quesada Ave | 0.25mi | 2/2.0 (-1) | 1,450 (+8%) | 2mo | $1,300,000 | $897 | 65 |
| 1449 Innes Ave | 0.21mi | 4/2.0 (+1) | 1,234 (-8%) | 8mo | $1,000,000 | $810 | 61 |
| 15 Venus St | 0.49mi | 4/2.0 (+1) | 1,280 (-5%) | 1mo | $1,156,800 | $904 | 59 |
| 1966 Palou Ave | 0.56mi | 2/1.0 (-1) | 1,260 (-6%) | 1mo | $967,000 | $767 | 57 |
| 1143 Palou Ave | 0.52mi | 3/2.0 | 1,255 (-7%) | 5mo | $915,000 | $729 | 56 |
| 1470 Revere Ave | 0.31mi | 2/1.0 (-1) | 1,162 (-14%) | 4mo | $890,000 | $766 | 54 |
| 1276 Revere Ave | 0.51mi | 4/2.5 (+1) | 1,436 (+6%) | 1mo | $600,000 | $418 | 54 |
| 11 Topeka Ave | 0.68mi | 2/1.0 (-1) | 1,430 (+6%) | 0mo | $1,230,000 | $860 | 53 |
| 86 Apollo | 0.61mi | 3/1.0 | 1,215 (-10%) | 4mo | $925,000 | $761 | 52 |
| 100 Bridgeview Dr | 0.40mi | 2/1.0 (-1) | 1,145 (-15%) | 3mo | $1,020,000 | $891 | 49 |
| 2147 Quesada Ave | 0.68mi | 3/1.5 | 1,251 (-7%) | 8mo | $790,000 | $631 | 48 |
| 555 Thornton Ave | 0.67mi | 2/1.0 (-1) | 1,154 (-14%) | 8mo | $860,000 | $745 | 34 |
Match score weights: distance 35% · size 25% · config 20% · recency 20%. Top-matched comps best support the ARV.
Projected returns pro-forma
-3.0% appreciation · 3.0% rent growth · sell at horizon
- IRR
- -4.7%
- Equity multiple
- 0.83×
- Total profit
- $-24,426
- Equity at exit
- $74,551
- IRR
- 5.0%
- Equity multiple
- 1.36×
- Total profit
- $50,909
- Equity at exit
- $43,231
Cash invested: $139,999 (down + closing). Projections, not guarantees.
Landlord ↔ Tenant lean methodology
- Overall (CITY)
- 0 Strongly Tenant-Friendly
- State California
- 18 Strongly Tenant-Friendly · D+13
- County
- — inherits STATE
- City San Francisco
- 0 Strongly Tenant-Friendly · D+57
ZIP-level market 94124
- Active inventory
- 93
- Price-to-rent
- 8.6×
Monthly cashflow live
- Estimated rent
- $4,837 high interval (Pro) →
- Mortgage (P&I)
- −$2,622
- Tax from tax record
- −$98 /mo · $1,176/yr
- Insurance
- −$208
- HOA
- −$0
- Vacancy / Maint / Mgmt
- −$1,016
- Net cashflow
- $893
Break-even live
UW: 25.0% down · 7.5% · 30yr · 1.5% tax · 5.0% vac · 8.0% maint · 8.0% mgmt
Financing live
Cash to close
- Down payment
- $125,000
- Closing costs
- $15,000
- Reserves months
- —
- Total cash needed
- —
Loan-product check · same deal, 3 products live
Conventional
25% down · 7.5% · 30yr
- Down + closing
- —
- Monthly P&I
- —
- Monthly cashflow
- —
- DSCR
- —
- Eligible?
- —
Personal DTI + credit; lowest rate.
DSCR
20% down · 8.5% · 30yr
- Down + closing
- —
- Monthly P&I
- —
- Monthly cashflow
- —
- DSCR
- —
- Eligible?
- —
No personal income docs; deal must DSCR.
Hard money
10% down · 12.0% · 12mo
- Down + closing
- —
- Monthly P&I
- —
- Monthly cashflow
- —
- DSCR
- —
- Eligible?
- —
Short-term bridge; refi at stabilization.
Rent comps 17 comps
| Address | Beds | Baths | Sqft | Rent | $/sqft | DOM | Units | Dist |
|---|---|---|---|---|---|---|---|---|
| 1566 Newcomb Ave San Francisco, CA | 3.0 | 2.0 | 1196 | $4,290 | $3.59 | 22d | 1 | 0.06mi |
| 1398 Palou Ave San Francisco, CA | 2.0 | 1.0 | 1000 | $3,270 | $3.27 | 43d | 1 | 0.22mi |
| 4343 3rd St #205 San Francisco, CA | 3.0 | 2.0 | 1117 | $5,500 | $4.92 | 43d | 1 | 0.22mi |
| 66 Bayview St San Francisco, CA | 3.0 | 1.0 | 1440 | $4,995 | $3.47 | 18d | 1 | 0.34mi |
| 1475 Hawes St Unit B San Francisco, CA | 3.0 | 1.0 | 1175 | $3,975 | $3.38 | 43d | 1 | 0.62mi |
| 2018 Oakdale Ave San Francisco, CA | 3.0 | 2.0 | 1300 | $4,995 | $3.84 | 43d | 1 | 0.65mi |
| 5800 3rd St #1119 San Francisco, CA | 3.0 | 3.0 | 1570 | $4,800 | $3.06 | 2d | 1 | 0.76mi |
| 5880 3rd St San Francisco, CA | 2.0 | 1.0–2.0 | 905 | $4,479 | $4.95 | 1d | 3 | 0.82mi |
| 2726 San Bruno Ave Unit 2724 San Francisco, CA | 3.0 | 2.0 | 1500 | $4,100 | $2.73 | 43d | 1 | 1.02mi |
| 2724-2726 San Bruno Ave San Francisco, CA | 3.0 | 2.0 | 1500 | $4,100 | $2.73 | 43d | 1 | 1.02mi |
| 87 Kirkwood Ave San Francisco, CA | 3.0 | 2.5 | 1527 | $5,700 | $3.73 | 43d | 1 | 1.06mi |
| 1052 Jamestown Ave Unit 1052 San Francisco, CA | 3.0 | 1.5 | 1250 | $4,050 | $3.24 | 24d | 1 | 1.14mi |
| 298 Coleman St San Francisco, CA | 3.0 | 2.5 | 1437 | $5,600 | $3.90 | 1d | 1 | 1.16mi |
| 100 Coleman St San Francisco, CA | 3.0 | 2.0 | 1436 | $5,300 | $3.69 | 43d | 1 | 1.18mi |
| 454 Holladay Ave San Francisco, CA | 4.0 | 2.0 | 1500 | $8,500 | $5.67 | 18d | 1 | 1.19mi |
| 290 Holyoke St San Francisco, CA | 3.0 | 2.0 | 1652 | $6,250 | $3.78 | 5d | 1 | 1.27mi |
| 2660 3rd St San Francisco, CA | 2.0 | 1.0–2.0 | 708 | $7,118 | $10.05 | 1d | 7 | 1.44mi |
Listing history 14 events
-
2026-06-18days on market $499,998 Active 20 DOM
-
2026-06-17days on market $499,998 Active 19 DOM
-
2026-06-16days on market $499,998 Active 18 DOM
-
2026-06-15days on market $499,998 Active 17 DOM
-
2026-06-13days on market $499,998 Active 15 DOM
-
2026-06-13days on market $499,998 Active 14 DOM
-
2026-06-09days on market $499,998 Active 11 DOM
-
2026-06-08days on market $499,998 Active 10 DOM
-
2026-06-07days on market $499,998 Active 9 DOM
-
2026-06-04days on market $499,998 Active 6 DOM
-
2026-06-03days on market $499,998 Active 5 DOM
-
2026-06-02days on market $499,998 Active 4 DOM
-
2026-06-01days on market $499,998 Active 3 DOM
-
2026-05-31days on market $499,998 Active 2 DOM
ⓘ Source: listings_history table (triggers on properties + properties_extension) + one-shot
backfill from property_details.listing_events for pre-trigger history.
Tax reassessment forecast CA · Resets to sale price
- Current annual tax
- $1,176 · $98/mo
- Projected year-2 tax
- $3,800 · $317/mo
- Expected delta
- +$2,624/yr (+$219/mo · 223.2%)
ⓘ Screening estimate from a state-policy table — verify with the county assessor before closing.
Climate risk First Street
- Flood 1/10 Low FEMA zone X (unshaded) · 0% chance over 30 yrs
- Wildfire 1/10 Low
- Heat 2/10 Low 7 d/yr ≥80°F today · 15 d/yr by 30 yrs out
- Wind 1/10 Low
- Air quality 7/10 Severe 13 unhealthy d/yr today · 13 by 30 yrs out
Nearby sold comps map
Loading sold comps map…
Walkable amenities ~0.75 mi
Loading nearby amenities…
Taxation est. · year 1
- Rental income
- $58,039
- − Mortgage interest
- −$28,008
- − Property taxes
- −$1,176
- − Insurance
- −$2,500
- − Repairs & maintenance
- −$4,643
- − Management
- −$4,643
- − Depreciation
- −$14,545
- Taxable income
- $2,524
- Est. tax owed @ 24.0%
- −$606
- After-tax cash flow
- $10,105/yr
For passive investors: Depreciation is non-cash, so a rental often shows a tax loss while cash-flowing — sheltering income. Rental losses are passive: they offset passive income freely, and up to $25,000/yr can offset ordinary (W-2) income if you actively participate and your MAGI is under $100k (phasing out to $0 by $150k); unused losses carry forward. On sale, claimed depreciation is recaptured at up to 25%, and gains may owe capital-gains tax (a 1031 exchange can defer both). Figures are a year-1 estimate at your 24.0% rate — not tax advice; consult a CPA.
Schools (NCES district)
- District
- San Francisco Unified
- NCES district ID
- 0634410
- Math proficiency
- 50% ▬ 0.00%
- Reading proficiency
- 56% ▲ 1.00%
- Median HH income
- $81,249
- Composite
- 50.14/100
- National rank
- #4088
- State rank
- #322 of 1400 in CA
Livability — San Francisco
- Score
- 76/100
- State rank
- #90
- US rank
- #3143
Category grades
Schools grade is shown separately in the Schools card above.
Census & demographics
- Census place
- San Francisco, CA
- County
- San Francisco County · 827,552 people
- City population
- 827,552
- Metro
- San Francisco-Oakland-Berkeley, CA
- Population (ZIP)
- 34,475
- Household income
- $80,509
- Rent vs Own
- Severe rent burden
- 1605.0
Population outlook (San Francisco County) Hauer SSP2
- Today (2025)
- 1,030,936 people
- By 2030
- 1,110,409 · +7.7%
- By 2040
- 1,270,010 · +23.2%
- By 2050
- 1,435,001 · +39.2%
- By 2075
- 1,779,074 · +72.6%
- By 2100
- 1,966,767 · +90.8%
Race, ethnicity, and origin ACS 2023
- Neighborhood character
- Highly diverse neighborhood (Simpson 0.74)
- Race & ethnicity
- Asian 36% Black 25% Hispanic / Latino 25% Two or more races 9% White 8% Pacific Islander 2%
- Hispanic origin (detail)
- Mexican 11%
- Common ancestry
- Italian 1% Lithuanian 1%
- Foreign-born
- 37% · China, Canada, Vietnam
- Languages at home
- 47% English-only · Chinese 24% Spanish 20% Vietnamese 2%
Political lean MEDSL · San Francisco
- 2024 margin
- Solid D (+64.8) · D 80.3% · R 15.5% · Other 4.1%
- 2008→2024 swing
- -5.7pp toward R · 2008: 70.5pp · 2024: 64.8pp
- All cycles
- 2024: D+64.8 2020: D+72.5 2016: D+76.1 2012: D+70.2 2008: D+70.5
Not yet ingested
- Civics
- —
Market trends
- HPI YoY
- ▼ -909.13%
- Current HPI
- 275.3568
- Rent YoY
- —
- Metro
- San Francisco-Oakland-Berkeley, CA
- State GDP YoY
- ▲ 3.21%
- F500 in state
- 116
Industry mix (Fortune 500 HQ in CA)
| Industry | F500 HQs | Revenue |
|---|---|---|
| Technology | 27 | $1,492B |
|
||
| Financial Services | 3 | $174B |
|
||
| Retail | 3 | $44B |
|
||
| Insurance | 3 | $26B |
|
||
| Media / Entertainment | 2 | $115B |
|
||
| Pharmaceuticals / Biotech | 2 | $62B |
|
||
Price history
1 event — show timeline
- 2026-05-29 Listed $499,998 bridgeMLS, Bay East AOR, or Contra Costa AOR
Property tax history
+5.1%/yrLatest (2025): $1,176 · +2.5% YoY. Source: county tax records.
Cash-flow waterfall
monthlySold comps — $/sqft
last 12 mo · ≤1 miLoading sold comps…