3420 Frosty Way #12 · Naples, FL
Flood risk 8/10 · Major
- FEMA flood zone
- AE
- Chance of flooding over 30 yrs
- 0.97%
- Est. flood insurance / yr
- $1,737 – $8,500
Fire risk 3/10 · Minor
- Est. fire insurance / yr
- $947 – $1,759
Heat risk 10/10 · Severe
- Hot days now (above 107°F)
- 7 days/yr
- Hot days in 30 yrs
- 29 days/yr
Wind risk 10/10 · Severe
- Chance of severe wind over 30 yrs
- 99.0%
Air-quality risk 3/10 · Minor
- Unhealthy air days now
- 3 days/yr
- Unhealthy air days in 30 yrs
- 3 days/yr
Risk factors via First Street. Map © Google.
Why this score? — see what drove the B- grade
The composite is a weighted blend of 9 inputs, each scored 0–100. Each bar is that input's sub-score; the figure is the points it added to the 100-point composite (weight × sub-score).
- Cash flow +28.4/30.0
- 1% rule +10.0/10.0
- DSCR +10.0/10.0
- ARV discount +7.5/15.0
- Schools +5.0/10.0
- Livability +4.0/5.0
- Condition / age +2.5/5.0
- Rent growth +2.1/5.0
- Appreciation +0.0/10.0
$200,000
🖨 Deal sheet 📄 Offer letter ✓ Due diligence
Listing remarks
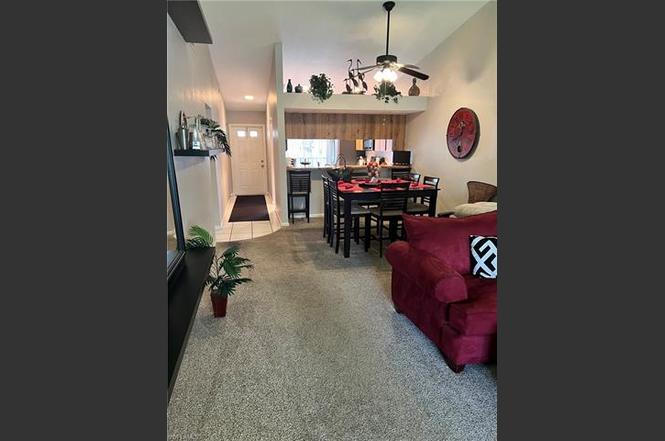
Best Value in Winterpark, LOWEST PRICED UNIT! This beautifully maintained END UNIT second-floor residence with soaring vaulted ceilings is offered turnkey furnished and is ready for immediate enjoyment or seasonal rental income. The association carries flood insurance on the building, an important benefit for buyers seeking conventional financing, and the community has recently completed the installation of new underground utilities, enhancing both aesthetics and infrastructure reliability. The thoughtfully maintained interior features a fully renovated primary bath and a partially renovated guest bath, providing a fresh and comfortable living experience. Ideally located just minutes from D
Key facts
- Turnkey furnished
- Vaulted ceilings
- Flood insurance
Tags
Property features AI
Finance
- Other: Part of a complex of 96 units; 4 units per building; 2 units per floor; building has 1 floor (per unit section data)
- HOA & community: Mandatory HOA; Quarterly condo fee; Professional management; Community amenities: community pool, community room, tennis court, pickleball, bocce court, shuffleboard, bike and jog path, streetlights, underground utilities; Maintenance covered: insurance, irrigation water, lawn/land maintenance, legal/accounting, manager, exterior pest control, recreation facilities, reserves, sewer, street lights, trash removal, water; Total annual recurring fees listed as $8,300; One-time fees listed as $150; Non-gated tennis community
Exterior
- Parking: 1 assigned parking space; Paved driveway; Guest parking
- Utilities: Central water; Central sewer; Cable available
- Home design: Residential low-rise (1–3 stories); 2-story end unit; Rear exposure facing east
- Construction: Built in 1987; Concrete block construction; Shingle roof; Jalousie and single-hung windows
- Exterior features: Stucco exterior; Decorative shutters; Patio; Privacy wall; Storage; Tennis court; Landscaped area view; Parking lot view; Partial buildings view; Central irrigation; Paved road access; Zero lot line
Interior
- Kitchen: Range; Microwave; Dishwasher; Disposal; Refrigerator/Freezer
- Bedrooms: 2 bedrooms
- Flooring: Tile; Carpet
- Bathrooms: 2 full bathrooms; Master bath with shower only
- Heating & cooling: Central electric heat; Central electric cooling; Ceiling fans
- Interior features: Built-in cabinets; Cable prewire; High-speed internet available; Vaulted and volume ceilings; Walk-in closet; Great room floor plan; Split-bedroom layout; Breakfast bar and dining in living area; Family room; Guest room; Guest bath; Screened lanai/porch; Turnkey furnished
- Laundry & utility: Washer; Dryer; Laundry in residence
Neighborhood map
What this means for you Summary
Snapshot
- This is a 2-bed/2.0-bath condo listed at $200k.
Deal economics
- At list price, monthly cash flow is $219 ($3k/yr) — positive.
- The deal already cash-flows at list — no discount required.
- Meets the 1% rule at list price ($3k rent vs $200k).
Location & tenants
- Location reads 80/100 on livability (#126 in FL, #1,903 nationally) — a professional / high-income tenant draw. Strengths: crime A+, amenities A+, employment A+; Watch: commute D+, cost of living F.
- Collier (suburban): math 60% / reading 56% proficiency, ranked #16 of 73 in FL (top 22%) — acceptable for families but not a draw, mixed tenant base, ~2y average lease.
- Market conditions: Rents soft (-1.7%/yr); 771 active listings in the ZIP; 40 comparable units currently listed for rent nearby; rentals leasing fast (median 14d on market — plan ~1-2 weeks tenant-placement turnaround); 3,520 units permitted in Collier County in 2024 (959 in 5+ unit buildings).
- At $3,229/mo this rent would consume 55% of the median local household income ($70k/yr) (locally 980% of renters already pay >50% of income on rent) — very limited rent-growth headroom before tenants either downsize or default.
Forward outlook
- Local home prices are declining (-3.0%/yr); year-one equity from $1k of loan paydown is wiped out by about $6k of value loss. Plan a longer hold.
- Collier County population projected at +30% by 2050 — long-run rental-demand tailwind backs the buy-and-hold thesis.
Negotiation context
- Only 2 days on market — expect competitive offers; lowballing is unlikely to land.
- Current owner paid $100k; list at $200k implies a 100% gain — meaningful room to come down on a strong offer.
Risks & watch-outs
- Watch-outs: flood insurance adds $427/mo; HOA is 21% of rent.
- Climate carrying-cost: in FEMA flood zone AE (mandatory federal flood insurance); severe wind risk, 99% chance of damaging wind over 30y; extreme-heat days projected 7→29/yr by 2055 (HVAC capex compounding) — expect insurance premiums to compound above CPI over the hold.
Questions for the listing agent
- What's the actual annual flood-insurance premium (NFIP or private), and is the property in a SFHA with mandatory coverage?
- What does the HOA fee cover, when was the last increase, and are there any pending special assessments or reserve-fund shortfalls?
- Any open or pending special assessments — roof, HVAC, plumbing, elevator, façade? What's the per-unit balance and payoff schedule, and is the seller paying it off at close or rolling it to the buyer?
- Is there a deadline driving the sale (1031 exchange, divorce, estate, relocation)? That informs how much negotiation room exists.
- Schools are B-rated — typically a magnet for longer-tenancy family renters. What's the average tenant stay here, and is there a school-zone premium baked into asking?
- What's the average days-on-market for RENTAL listings here right now (not sales)? A rising rental-DOM trend means longer vacancies and softer asking-rent achievability than the comps imply.
- What's the recent tenant-quality profile in this submarket — average credit score on applications, eviction rate, late-payment / NSF rate, and stable-employment percentage? A property-management company in the area should have these aggregated.
- How much new apartment / multifamily construction is in the pipeline within 1–3 miles? Heavy new supply (>2% of stock underway) typically softens rents 12–24 months out; light construction supports rent growth.
Investment metrics
- 1% rule
- 1.61% ✓
- Cap rate
- 10.17%
- Cash-on-cash
- 13.83%
- DSCR
- 1.62
- GRM
- 5.2
CMA / ARV
No comps found within radius.
Projected returns pro-forma
-3.0% appreciation · 0.0% rent growth · sell at horizon
- IRR
- -14.2%
- Equity multiple
- 0.51×
- Total profit
- $-27,287
- Equity at exit
- $29,821
- IRR
- -16.4%
- Equity multiple
- 0.29×
- Total profit
- $-39,797
- Equity at exit
- $17,292
Cash invested: $56,000 (down + closing). Projections, not guarantees.
Landlord ↔ Tenant lean methodology
- Overall (STATE)
- 87 Strongly Landlord-Friendly
- State Florida
- 87 Strongly Landlord-Friendly · R+3
- County
- — inherits STATE
- City
- — inherits STATE
ZIP-level market 34112
- Rents YoY
- -1.7%
- Active inventory
- 771
- Price-to-rent
- 5.2×
Monthly cashflow live
- Estimated rent
- $3,229 high interval (Pro) →
- Mortgage (P&I)
- −$1,049
- Tax from tax record
- −$81 /mo · $975/yr
- Insurance
- −$83
- Flood insurance flood zone
- −$427 /mo · $5,118/yr
- HOA
- −$692
- Vacancy / Maint / Mgmt
- −$678
- Net cashflow
- $219
Break-even live
UW: 25.0% down · 7.5% · 30yr · 1.5% tax · 5.0% vac · 8.0% maint · 8.0% mgmt
Financing live
Cash to close
- Down payment
- $50,000
- Closing costs
- $6,000
- Reserves months
- —
- Total cash needed
- —
Loan-product check · same deal, 3 products live
Conventional
25% down · 7.5% · 30yr
- Down + closing
- —
- Monthly P&I
- —
- Monthly cashflow
- —
- DSCR
- —
- Eligible?
- —
Personal DTI + credit; lowest rate.
DSCR
20% down · 8.5% · 30yr
- Down + closing
- —
- Monthly P&I
- —
- Monthly cashflow
- —
- DSCR
- —
- Eligible?
- —
No personal income docs; deal must DSCR.
Hard money
10% down · 12.0% · 12mo
- Down + closing
- —
- Monthly P&I
- —
- Monthly cashflow
- —
- DSCR
- —
- Eligible?
- —
Short-term bridge; refi at stabilization.
Rent comps 40 comps
| Address | Beds | Baths | Sqft | Rent | $/sqft | DOM | Units | Dist |
|---|---|---|---|---|---|---|---|---|
| 3400 Frosty Way #5 Naples, FL | 2.0 | 2.0 | 1284 | $3,500 | $2.73 | 13d | 1 | 0.02mi |
| 3563 Antarctic Cir #2102 Naples, FL | 2.0 | 2.0 | 1200 | $3,800 | $3.17 | 23d | 1 | 0.04mi |
| 3618 Arctic Cir #3618 Naples, FL | 2.0 | 2.0 | 1200 | $3,450 | $2.88 | 23d | 1 | 0.10mi |
| 3510 Antarctic Cir Unit 1 Naples, FL | 2.0 | 2.0 | 1200 | $2,350 | $1.96 | 23d | 1 | 0.10mi |
| 3504 Antarctic Cir Naples, FL | 2.0 | 2.0 | 1246 | $3,000 | $2.41 | 23d | 1 | 0.11mi |
| 3676 Arctic Cir #112 Naples, FL | 2.0 | 2.0 | 1246 | $2,700 | $2.17 | 21d | 1 | 0.12mi |
| 3608 Arctic Cir #514 Naples, FL | 2.0 | 2.0 | 1250 | $4,200 | $3.36 | 23d | 1 | 0.15mi |
| 83 Glades Blvd #3 Naples, FL | 2.0 | 2.0 | 1204 | $5,200 | $4.32 | 13d | 1 | 0.19mi |
| 96 Glades Blvd Unit 513 Naples, FL | 2.0 | 2.0 | 1370 | $4,500 | $3.28 | 13d | 1 | 0.29mi |
| 364 Tern Dr #4 Naples, FL | 2.0 | 2.0 | 1264 | $1,800 | $1.42 | 13d | 1 | 0.33mi |
| 4069 Northlight Dr #1805 Naples, FL | 2.0 | 2.0 | 1234 | $3,000 | $2.43 | 21d | 1 | 0.33mi |
| 1111 Central Dr Unit 417A Naples, FL | 2.0 | 2.0 | 1265 | $6,500 | $5.14 | 23d | 1 | 0.35mi |
| 348 Tern Dr Unit 4 Naples, FL | 2.0 | 2.0 | 1270 | $5,000 | $3.94 | 23d | 1 | 0.37mi |
| 348 Tern Dr #2 Naples, FL | 2.0 | 2.0 | 1270 | $1,800 | $1.42 | 13d | 1 | 0.37mi |
| 1059 San Remo Ave Naples, FL | 2.0 | 1.0 | 845 | $1,795 | $2.12 | 23d | 1 | 0.38mi |
| 2155 Great Blue Dr Naples, FL | 1.0–3.0 | 1.0–2.0 | 895 | $1,910 | $2.13 | 13d | 43 | 0.38mi |
| 4010 Ice Castle Way #7 Naples, FL | 2.0 | 2.0 | 1314 | $3,200 | $2.44 | 23d | 1 | 0.43mi |
| 4021 Ice Castle Way #4 Naples, FL | 2.0 | 2.0 | 1246 | $2,600 | $2.09 | 13d | 1 | 0.47mi |
| 306 Palm Dr #2 Naples, FL | 2.0 | 2.0 | 1270 | $5,200 | $4.09 | 23d | 1 | 0.49mi |
| 4040 Ice Castle Way Unit 2 Naples, FL | 2.0 | 2.0 | 1246 | $2,800 | $2.25 | 23d | 1 | 0.52mi |
| 4060 Ice Castle Way #10 Naples, FL | 2.0 | 2.0 | 1246 | $3,600 | $2.89 | 13d | 1 | 0.54mi |
| 2347 Bayside St Apt B Naples, FL | 2.0 | 1.0 | 864 | $1,595 | $1.85 | 13d | 1 | 0.54mi |
| 265 Palm Dr Unit 265-2 Naples, FL | 2.0 | 2.0 | 1215 | $1,499 | $1.23 | 13d | 1 | 0.56mi |
| 2750 Manorca Ave Unit A Naples, FL | 2.0 | 1.0 | 840 | $2,800 | $3.33 | 13d | 1 | 0.58mi |
| 256 Palm Dr #6 Naples, FL | 2.0 | 2.0 | 1010 | $4,500 | $4.46 | 13d | 1 | 0.58mi |
| 240 Palm Dr Unit 48-1 Naples, FL | 2.0 | 2.0 | 1100 | $1,800 | $1.64 | 23d | 1 | 0.62mi |
| 239 Palm Dr #2 Naples, FL | 2.0 | 2.0 | 1215 | $4,000 | $3.29 | 13d | 1 | 0.63mi |
| 146 Lollypop Ln #851 Naples, FL | 2.0 | 2.0 | 1335 | $3,750 | $2.81 | 23d | 1 | 0.63mi |
| 232 Palm Dr Unit 47-5 Naples, FL | 2.0 | 2.0 | 1010 | $2,500 | $2.48 | 23d | 1 | 0.64mi |
| 229 Palm Dr Unit 229-2 Naples, FL | 2.0 | 2.0 | 1215 | $4,400 | $3.62 | 13d | 1 | 0.65mi |
| 216 Palm Dr #5 Naples, FL | 2.0 | 2.0 | 1010 | $4,500 | $4.46 | 13d | 1 | 0.67mi |
| 195 Peppermint Ln #2 Naples, FL | 2.0 | 2.0 | 1198 | $2,600 | $2.17 | 13d | 1 | 0.69mi |
| 202 Peppermint Ln #2 Naples, FL | 2.0 | 2.0 | 1335 | $5,000 | $3.75 | 13d | 1 | 0.69mi |
| 195 Peppermint Ln Unit 881 Naples, FL | 2.0 | 2.0 | 1335 | $5,000 | $3.75 | 13d | 1 | 0.69mi |
| 195 Peppermint Ln Unit 884 Naples, FL | 2.0 | 2.0 | 1335 | $3,800 | $2.85 | 13d | 1 | 0.69mi |
| 195 Peppermint Ln Unit 4 Naples, FL | 2.0 | 2.0 | 1335 | $2,500 | $1.87 | 23d | 1 | 0.69mi |
| 4502 Parrot Ave Naples, FL | 3.0 | 2.0 | 1200 | $2,950 | $2.46 | 23d | 1 | 0.69mi |
| 4180 Looking Glass Ln Unit 4104 Naples, FL | 2.0 | 2.0 | 1246 | $4,000 | $3.21 | 13d | 1 | 0.70mi |
| 200 Palm Dr #7 Naples, FL | 2.0 | 2.0 | 1010 | $1,600 | $1.58 | 13d | 1 | 0.71mi |
| 209 Palm Dr #1 Naples, FL | 2.0 | 2.0 | 1215 | $5,000 | $4.12 | 13d | 1 | 0.71mi |
HOA detail condo
- Monthly dues
- $692 · $8,304/yr
- Assessments
- None detected in remarks — confirm with the listing agent.
Listing history 3 events
-
2026-06-18days on market $200,000 Active 2 DOM
-
2026-06-16remarks 699-char remark
-
2026-06-16$200,000 Active 1 DOM
ⓘ Source: listings_history table (triggers on properties + properties_extension) + one-shot
backfill from property_details.listing_events for pre-trigger history.
Tax reassessment forecast FL · Resets to sale price
- Current annual tax
- $975 · $81/mo
- Projected year-2 tax
- $1,660 · $138/mo
- Expected delta
- +$685/yr (+$57/mo · 70.3%)
ⓘ Screening estimate from a state-policy table — verify with the county assessor before closing.
Climate risk First Street
- Flood 8/10 Severe FEMA zone AE · 97% chance over 30 yrs
- Wildfire 3/10 Moderate
- Heat 10/10 Extreme 7 d/yr ≥107°F today · 29 d/yr by 30 yrs out
- Wind 10/10 Extreme 99% chance of damaging wind over 30 yrs
- Air quality 3/10 Moderate 3 unhealthy d/yr today · 3 by 30 yrs out
Nearby sold comps map
Loading sold comps map…
Walkable amenities ~0.75 mi
Loading nearby amenities…
Taxation est. · year 1
- Rental income
- $38,749
- − Mortgage interest
- −$11,203
- − Property taxes
- −$975
- − Insurance
- −$6,118
- − Repairs & maintenance
- −$3,100
- − Management
- −$3,100
- − HOA
- −$8,304
- − Depreciation
- −$5,818
- Taxable income
- $131
- Est. tax owed @ 24.0%
- −$31
- After-tax cash flow
- $2,597/yr
For passive investors: Depreciation is non-cash, so a rental often shows a tax loss while cash-flowing — sheltering income. Rental losses are passive: they offset passive income freely, and up to $25,000/yr can offset ordinary (W-2) income if you actively participate and your MAGI is under $100k (phasing out to $0 by $150k); unused losses carry forward. On sale, claimed depreciation is recaptured at up to 25%, and gains may owe capital-gains tax (a 1031 exchange can defer both). Figures are a year-1 estimate at your 24.0% rate — not tax advice; consult a CPA.
Schools (NCES district)
- District
- Collier
- NCES district ID
- 1200330
- Math proficiency
- 60% ▼ -4.00%
- Reading proficiency
- 56% ▼ -2.00%
- Median HH income
- $58,275
- Composite
- 50.23/100
- National rank
- #1892
- State rank
- #16 of 73 in FL
Livability — Naples
- Score
- 80/100
- State rank
- #126
- US rank
- #1903
Category grades
Schools grade is shown separately in the Schools card above.
Census & demographics
- County
- Collier County · 396,295 people
- City population
- 344,941
- Metro
- Naples-Marco Island, FL
- Population (ZIP)
- 27,193
- Household income
- $69,842
- Rent vs Own
- Severe rent burden
- 980.0
Population outlook (Collier County) Hauer SSP2
- Today (2025)
- 420,858 people
- By 2030
- 450,054 · +6.9%
- By 2040
- 502,232 · +19.3%
- By 2050
- 544,932 · +29.5%
- By 2075
- 627,203 · +49.0%
- By 2100
- 659,015 · +56.6%
Race, ethnicity, and origin ACS 2023
- Neighborhood character
- Predominantly White (74%)
- Race & ethnicity
- White 74% Hispanic / Latino 18% Two or more races 9% Black 6% Native American 2% Asian 1%
- Hispanic origin (detail)
- Mexican 7% Puerto Rican 2% Cuban 4% Dominican 1%
- Common ancestry
- Hispanic 4% Romanian 3% Portuguese 2%
- Foreign-born
- 19% · Canada, Jamaica
- Languages at home
- 75% English-only · Spanish 17% French/Haitian/Cajun 4% German/W. Germanic 1%
Political lean MEDSL · Collier
- 2024 margin
- Solid R (+33.1) · D 33.1% · R 66.2%
- 2008→2024 swing
- -10.6pp toward R · 2008: -22.5pp · 2024: -33.1pp
- All cycles
- 2024: R+33.1 2020: R+24.7 2016: R+26.0 2012: R+30.1 2008: R+22.5
Not yet ingested
- Civics
- —
Market trends
- HPI YoY
- ▼ -235.10%
- Current HPI
- 256.9182
- Rent YoY
- ▼ -1.69%
- Metro
- Naples-Marco Island, FL
- State GDP YoY
- ▲ 3.28%
- F500 in state
- 36
Industry mix (Fortune 500 HQ in FL)
| Industry | F500 HQs | Revenue |
|---|---|---|
| Industrial Technology | 2 | $29B |
|
||
| Insurance | 2 | $17B |
|
||
| Retail | 1 | $60B |
|
||
| Technology Distribution | 1 | $58B |
|
||
| Homebuilding | 1 | $35B |
|
||
| Technology Manufacturing | 1 | $35B |
|
||
Price history
+244.8% since first listed3 events — show timeline
- 2026-06-16 Listed $200,000 NAPLESMLS
- 2008-12-02 Sold (Public Records) $100,000 Public Records
- 1987-11-01 Sold (Public Records) $58,000 Public Records
Property tax history
+0.2%/yrLatest (2025): $975 · +7.5% YoY. Source: county tax records.
Cash-flow waterfall
monthlySold comps — $/sqft
last 12 mo · ≤1 miLoading sold comps…