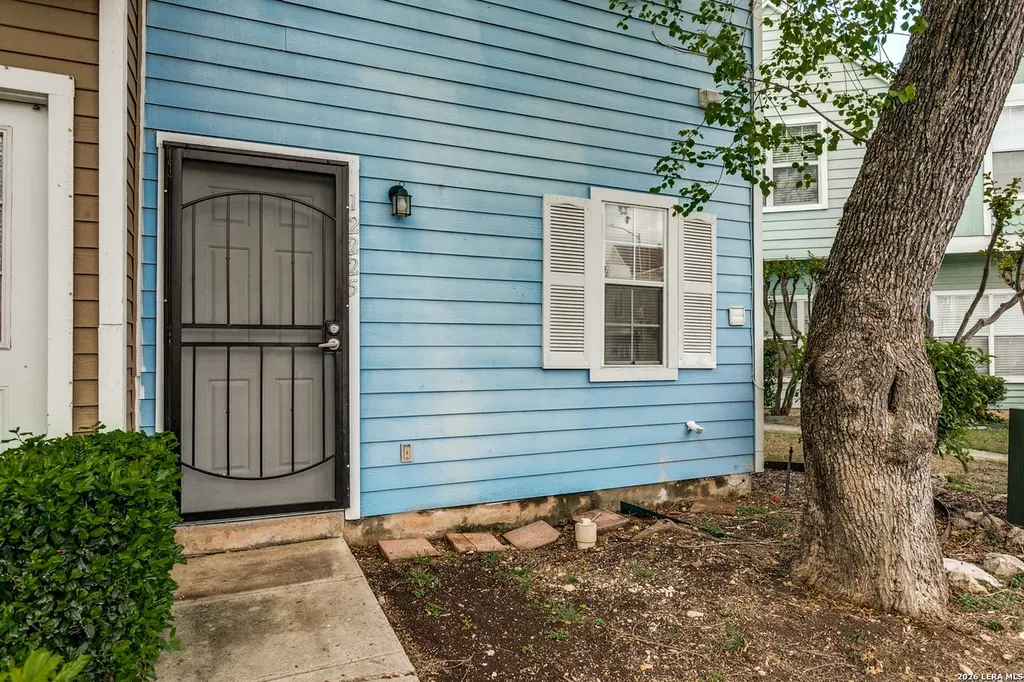
12225 Magnolia Blossom · San Antonio, TX
Flood risk 1/10 · Minimal
- FEMA flood zone
- X (unshaded)
- Chance of flooding over 30 yrs
- 0.0%
- Est. flood insurance / yr
- $507 – $1,088
Fire risk 1/10 · Minimal
- Est. fire insurance / yr
- $1,222 – $2,270
Heat risk 8/10 · Major
- Hot days now (above 108°F)
- 7 days/yr
- Hot days in 30 yrs
- 23 days/yr
Wind risk 7/10 · Major
- Chance of severe wind over 30 yrs
- 78.0%
Air-quality risk 2/10 · Minimal
- Unhealthy air days now
- 1 days/yr
- Unhealthy air days in 30 yrs
- 1 days/yr
Risk factors via First Street. Map © Google.
Why this score? — see what drove the D grade
The composite is a weighted blend of 9 inputs, each scored 0–100. Each bar is that input's sub-score; the figure is the points it added to the 100-point composite (weight × sub-score).
- ARV discount +11.3/15.0
- Cash flow +9.5/30.0
- 1% rule +5.1/10.0
- Livability +4.0/5.0
- Schools +3.8/10.0
- DSCR +2.7/10.0
- Condition / age +2.5/5.0
- Rent growth +1.8/5.0
- Appreciation +0.0/10.0
$145,000
🖨 Deal sheet 📄 Offer letter ✓ Due diligence
Listing remarks MLS
Beautiful 2-Bedroom, 2.5-Bathroom Townhome in Highly Desirable North Park Townhomes Community. Great Purchase Opportunity Priced Well-Below Appraisal Value. Fantastic Location Walking Distance to McAllister Park & Blossom Athletic Center, Easy Access to Wurzbach Pkwy & Hwy-281 to Shopping, Restaurants, Entertainment, & More. Small, Quiet Community with Assigned Parking Spaces, Sparkling Pool, Clubhouse, & Sports Court. Enjoy Low-Maintenance Layout & Style, Main Level Features Well-Equipped Kitchen with Appliances Included, Half-Bathroom, & Laundry Area with Washer/Dryer. Spacious Open Living Room with Tile Flooring & Cozy Wood-Burning Fireplace. Small Private Patio for Relaxation & Storage Closet. Second Level Complete with Brand-New Carpet, 2 Nicely-Sized Bedrooms, Each with Ensuite Bathroom with Tub/Shower. North East ISD Schools.
Key facts
- Small private patio
- $110 HOA
- Community pool
Tags
Neighborhood map
What this means for you Summary
Snapshot
- This is a 2-bed/2.5-bath townhouse listed at $145k.
Deal economics
- At list price, monthly cash flow is $-100 ($-1k/yr) — negative.
- To cash-flow at today's rent, offer at most $127k (12.2% below list).
- Meets the 1% rule at list price ($1k rent vs $145k).
- Recommended offer: $127k (12.2% below list) — sets the bar for cash-flow.
- Cap rate 5.5% vs local median 3.8% in San Antonio — top-decile yield for the area; either an underpriced asset or a hidden risk that comps aren't pricing in. Stress-test before assuming the spread holds.
Location & tenants
- Location reads 80/100 on livability (#31 in TX, #1,616 nationally) — a professional / high-income tenant draw. Strengths: amenities A+, commute A+, cost of living A+; Watch: schools C-, crime F.
- North East ISD (urban): math 38% / reading 49% proficiency, ranked #276 of 826 in TX (top 33%) — families likely to look elsewhere, expect single-tenant / working-renter base with shorter leases.
- Market conditions: Rents soft (-2.7%/yr); 256 active listings in the ZIP; 32 comparable units currently listed for rent nearby; rentals at typical pace (median 22d on market — plan ~3-4 weeks tenant-placement turnaround); solid renter incomes; 8,308 units permitted in Bexar County in 2024 (2,506 in 5+ unit buildings).
Forward outlook
- Local home prices are declining (-3.0%/yr); year-one equity from $1k of loan paydown is wiped out by about $4k of value loss. Plan a longer hold.
- Bexar County population projected at +50% by 2050 — long-run rental-demand tailwind backs the buy-and-hold thesis.
Negotiation context
- It's been on market 75 days — a 6% lower offer ($136k) is reasonable based on typical stale-listing flexibility.
- 4 sale attempts with the ask held roughly flat each time — persistent listings suggest the price (not the market) is what's stuck; bring a comps-based counter.
Risks & watch-outs
- Watch-outs: property tax is 2.7% of price.
- Climate carrying-cost: major wind risk, 78% chance of damaging wind over 30y; extreme-heat days projected 7→23/yr by 2055 (HVAC capex compounding) — expect insurance premiums to compound above CPI over the hold.
Questions for the listing agent
- What do current leases actually rent for vs. the listed asking? Can we see a recent rent roll and the last 12 months of T-12 income?
- It's been on market 75 days. Have you received any prior offers? Is the seller open to a 12% concession, seller financing, or rate buy-down credit?
- Property tax is high relative to price — has the assessment been appealed recently, and will the sale trigger a re-assessment?
- What does the HOA fee cover, when was the last increase, and are there any pending special assessments or reserve-fund shortfalls?
- Why hasn't it sold? Are there any deal-killer items the seller is aware of (foundation, flood, title, zoning, code violations)?
- Is there a deadline driving the sale (1031 exchange, divorce, estate, relocation)? That informs how much negotiation room exists.
- Crime grade is F in this area — have there been break-ins, vandalism, or insurance claims at this property in the last 3 years? What carrier currently insures it and at what premium?
- The area grade is low — what's the realistic commute time and amenity access for the typical tenant pool here? Any planned neighborhood developments (good or bad) we should know about?
- What's the average days-on-market for RENTAL listings here right now (not sales)? A rising rental-DOM trend means longer vacancies and softer asking-rent achievability than the comps imply.
- What's the recent tenant-quality profile in this submarket — average credit score on applications, eviction rate, late-payment / NSF rate, and stable-employment percentage? A property-management company in the area should have these aggregated.
- How much new for-sale + rental construction is in the pipeline within 1–3 miles? Heavy new supply typically softens prices + rents 12–24 months out; constrained supply supports both.
Investment metrics
- 1% rule
- 1.01% ✓
- Cap rate
- 5.47%
- Cash-on-cash
- -2.96%
- DSCR
- 0.87
- GRM
- 8.3
CMA / ARV
- ARV (median comp)
- $158,194
- List price
- $145,000
- Delta
- -8.34%
- Verdict
- FAIR
- Comps
- 20 within 1.0 mi
Show comp detail 12 sales within ~0.75 mi
| Address | Dist | Beds/Ba | Sqft | Sold | Price | $/sf | Match |
|---|---|---|---|---|---|---|---|
| 1825 Budding | 0.06mi | 2/2.5 | 1,055 (0%) | 6mo | $139,000 | $132 | 92 |
| 12231 Magnolia Blossom | 0.02mi | 2/2.0 | 1,055 (0%) | 6mo | $154,900 | $147 | 92 |
| 1917 Budding | 0.10mi | 2/2.5 | 1,055 (0%) | 5mo | $147,990 | $140 | 91 |
| 1803 Garys Park | 0.03mi | 2/2.5 | 1,112 (+5%) | 1mo | $149,999 | $135 | 89 |
| 12273 Apricot Dr | 0.15mi | 2/2.5 | 1,055 (0%) | 8mo | $160,000 | $152 | 86 |
| 12232 Apricot | 0.17mi | 2/2.5 | 1,112 (+5%) | 1mo | $175,000 | $157 | 82 |
| 12215 Magnolia Blossom | 0.01mi | 2/2.5 | 1,140 (+8%) | 6mo | $173,000 | $152 | 81 |
| 12214 Apricot Dr | 0.17mi | 2/2.5 | 1,055 (0%) | 15mo | $138,900 | $132 | 80 |
| 12226 Apricot Dr | 0.17mi | 2/2.5 | 1,112 (+5%) | 12mo | $159,000 | $143 | 73 |
| 1929 Budding Blvd | 0.12mi | 2/2.5 | 1,140 (+8%) | 12mo | $165,000 | $145 | 71 |
| 12254 Lemon Blossom #12254 | 0.13mi | 2/2.5 | 1,140 (+8%) | 12mo | $169,700 | $149 | 70 |
| 12446 Starcrest Dr #412 | 0.57mi | 2/2.0 | 1,038 (-2%) | 17mo | $175,000 | $169 | 55 |
Match score weights: distance 35% · size 25% · config 20% · recency 20%. Top-matched comps best support the ARV.
Projected returns pro-forma
-3.0% appreciation · 0.0% rent growth · sell at horizon
- IRR
- -25.5%
- Equity multiple
- 0.16×
- Total profit
- $-33,973
- Equity at exit
- $21,620
- IRR
- -41.0%
- Equity multiple
- -0.32×
- Total profit
- $-53,628
- Equity at exit
- $12,537
Cash invested: $40,600 (down + closing). Projections, not guarantees.
Landlord ↔ Tenant lean methodology
- Overall (STATE)
- 87 Strongly Landlord-Friendly
- State Texas
- 87 Strongly Landlord-Friendly · R+5
- County
- — inherits STATE
- City
- — inherits STATE
ZIP-level market 78247
- Home prices YoY
- -25.8%
- Rents YoY
- -2.7%
- Active inventory
- 256
- Price-to-rent
- 8.3×
Monthly cashflow live
- Estimated rent
- $1,463 high interval (Pro) →
- Mortgage (P&I)
- −$760
- Tax from tax record
- −$325 /mo · $3,898/yr
- Insurance
- −$60
- HOA
- −$110
- Vacancy / Maint / Mgmt
- −$307
- Net cashflow
- $-100
Break-even live
UW: 25.0% down · 7.5% · 30yr · 1.5% tax · 5.0% vac · 8.0% maint · 8.0% mgmt
Financing live
Cash to close
- Down payment
- $36,250
- Closing costs
- $4,350
- Reserves months
- —
- Total cash needed
- —
Loan-product check · same deal, 3 products live
Conventional
25% down · 7.5% · 30yr
- Down + closing
- —
- Monthly P&I
- —
- Monthly cashflow
- —
- DSCR
- —
- Eligible?
- —
Personal DTI + credit; lowest rate.
DSCR
20% down · 8.5% · 30yr
- Down + closing
- —
- Monthly P&I
- —
- Monthly cashflow
- —
- DSCR
- —
- Eligible?
- —
No personal income docs; deal must DSCR.
Hard money
10% down · 12.0% · 12mo
- Down + closing
- —
- Monthly P&I
- —
- Monthly cashflow
- —
- DSCR
- —
- Eligible?
- —
Short-term bridge; refi at stabilization.
Rent comps 32 comps
| Address | Beds | Baths | Sqft | Rent | $/sqft | DOM | Units | Dist |
|---|---|---|---|---|---|---|---|---|
| 1807 Budding Blvd #1807 San Antonio, TX | 2.0 | 1.5 | 855 | $1,275 | $1.49 | 44d | 1 | 0.03mi |
| 12127 Lemon Blossom San Antonio, TX | 3.0 | 2.0 | 1353 | $1,995 | $1.47 | 44d | 1 | 0.10mi |
| 1953 Budding Blvd San Antonio, TX | 2.0 | 1.5 | 872 | $995 | $1.14 | 16d | 1 | 0.14mi |
| 1955 Budding Blvd San Antonio, TX | 2.0 | 1.5 | 920 | $1,300 | $1.41 | 16d | 1 | 0.14mi |
| 12511 Jones Maltsberger Rd San Antonio, TX | 1.0–3.0 | 1.0–2.0 | 893 | $1,347 | $1.51 | 2d | 13 | 0.25mi |
| 12138 Cherry Blossom St San Antonio, TX | 3.0 | 2.0 | 1283 | $1,995 | $1.55 | 44d | 1 | 0.30mi |
| 12315 Jones Maltsberger Rd San Antonio, TX | 1.0–2.0 | 1.0–2.0 | 915 | $1,275 | $1.39 | 2d | 3 | 0.33mi |
| 12324 Starcrest Dr Apt 710 San Antonio, TX | 2.0 | 2.0 | 850 | $1,146 | $1.35 | 3d | 1 | 0.49mi |
| 12446 Starcrest Dr San Antonio, TX | 2.0 | 2.0 | 1038 | $1,150 | $1.11 | 44d | 1 | 0.54mi |
| 12446 Starcrest Dr San Antonio, TX | 1.0–2.0 | 1.0–2.0 | 878 | $1,175 | $1.34 | 15d | 2 | 0.54mi |
| 12474 Starcrest Dr San Antonio, TX | 1.0–2.0 | 1.0–2.0 | 808 | $1,329 | $1.64 | 2d | 25 | 0.55mi |
| 1506 Lochshire St San Antonio, TX | 3.0 | 2.0 | 1256 | $2,500 | $1.99 | 15d | 1 | 0.65mi |
| 2006 Oakline Dr San Antonio, TX | 3.0 | 2.0 | 1431 | $2,500 | $1.75 | 18d | 1 | 0.95mi |
| 13018 Brook Garden Ln San Antonio, TX | 2.0 | 2.0 | 1043 | $1,750 | $1.68 | 8d | 1 | 0.96mi |
| 13606 Dutch Myrtle San Antonio, TX | 2.0 | 1.5 | 1150 | $1,645 | $1.43 | 44d | 1 | 0.97mi |
| 13618 Dutch Myrtle San Antonio, TX | 2.0 | 1.5 | 950 | $1,475 | $1.55 | 44d | 1 | 0.98mi |
| 1327 Julienne San Antonio, TX | 2.0 | 2.0 | 1352 | $1,350 | $1.00 | 44d | 1 | 1.00mi |
| 250 Heimer Rd Unit 710 San Antonio, TX | 2.0 | 2.0 | 926 | $1,091 | $1.18 | 3d | 1 | 1.06mi |
| 950 E Bitters Rd San Antonio, TX | 1.0–2.0 | 1.0–2.0 | 836 | $1,230 | $1.47 | 3d | 16 | 1.14mi |
| 13855 Brook Hollow Blvd San Antonio, TX | 3.0 | 2.0 | 1441 | $1,800 | $1.25 | 24d | 1 | 1.15mi |
| 550 Heimer Rd Apt 710 San Antonio, TX | 2.0 | 2.0 | 884 | $1,227 | $1.39 | 3d | 1 | 1.17mi |
| 13802 Cypress Hollow Dr San Antonio, TX | 3.0 | 2.5 | 1481 | $1,795 | $1.21 | 24d | 1 | 1.19mi |
| 13018 Heimer Rd San Antonio, TX | 1.0–2.0 | 1.0–2.0 | 871 | $1,300 | $1.49 | 3d | 3 | 1.21mi |
| 551 Heimer Rd San Antonio, TX | 1.0 | 1.0 | 734 | $1,075 | $1.46 | 44d | 1 | 1.21mi |
| 13018 Heimer Rd Unit 10027 San Antonio, TX | 1.0 | 1.0 | 935 | $800 | $0.86 | 8d | 1 | 1.21mi |
| 3207 Stoney Sq San Antonio, TX | 3.0 | 2.0 | 1406 | $1,847 | $1.31 | 44d | 1 | 1.25mi |
| 12727 U.S. 281 San Antonio, TX | 1.0–2.0 | 1.0–2.0 | 764 | $1,204 | $1.57 | 44d | 6 | 1.36mi |
| 3211 Stoney Grv San Antonio, TX | 3.0 | 2.0 | 1009 | $1,575 | $1.56 | 24d | 1 | 1.38mi |
| 2718 Old Field Dr San Antonio, TX | 2.0 | 2.5 | 1327 | $1,950 | $1.47 | 44d | 1 | 1.39mi |
| 3510 Stoney Dawn San Antonio, TX | 3.0 | 2.0 | 1067 | $1,850 | $1.73 | 22d | 1 | 1.43mi |
| 12038 Stoney Xing San Antonio, TX | 3.0 | 2.0 | 1343 | $1,845 | $1.37 | 8d | 1 | 1.46mi |
| 12015 Stoney Pass San Antonio, TX | 3.0 | 2.0 | 1083 | $1,650 | $1.52 | 44d | 1 | 1.50mi |
HOA detail
- Monthly dues
- $110 · $1,320/yr
- Likely covers
- poolparking
Listing history 22 events
-
2026-06-18days on market $145,000 Active 75 DOM
-
2026-06-17days on market $145,000 Active 74 DOM
-
2026-06-16days on market $145,000 Active 73 DOM
-
2026-06-13days on market $145,000 Active 70 DOM
-
2026-06-13days on market $145,000 Active 69 DOM
-
2026-06-09days on market $145,000 Active 66 DOM
-
2026-06-08days on market $145,000 Active 65 DOM
-
2026-06-07days on market $145,000 Active 64 DOM
-
2026-06-04days on market $145,000 Active 61 DOM
-
2026-06-03days on market $145,000 Active 60 DOM
-
2026-06-02days on market $145,000 Active 59 DOM
-
2026-06-01days on market $145,000 Active 58 DOM
-
2026-05-31days on market $145,000 Active 57 DOM
-
2026-05-18price $145,000 876-char remark
Show marketing remark (876 chars)
Beautiful 2-Bedroom, 2.5-Bathroom Townhome in Highly Desirable North Park Townhomes Community. Great Purchase Opportunity Priced Well-Below Appraisal Value. Fantastic Location Walking Distance to McAllister Park & Blossom Athletic Center, Easy Access to Wurzbach Pkwy & Hwy-281 to Shopping, Restaurants, Entertainment, & More. Small, Quiet Community with Assigned Parking Spaces, Sparkling Pool, Clubhouse, & Sports Court. Enjoy Low-Maintenance Layout & Style, Main Level Features Well-Equipped Kitchen with Appliances Included, Half-Bathroom, & Laundry Area with Washer/Dryer. Spacious Open Living Room with Tile Flooring & Cozy Wood-Burning Fireplace. Small Private Patio for Relaxation & Storage Closet. Second Level Complete with Brand-New Carpet, 2 Nicely-Sized Bedrooms, Each with Ensuite Bathroom with Tub/Shower. North East ISD Schools.
-
2026-04-04$150,000 New 876-char remark
Show marketing remark (876 chars)
Beautiful 2-Bedroom, 2.5-Bathroom Townhome in Highly Desirable North Park Townhomes Community. Great Purchase Opportunity Priced Well-Below Appraisal Value. Fantastic Location Walking Distance to McAllister Park & Blossom Athletic Center, Easy Access to Wurzbach Pkwy & Hwy-281 to Shopping, Restaurants, Entertainment, & More. Small, Quiet Community with Assigned Parking Spaces, Sparkling Pool, Clubhouse, & Sports Court. Enjoy Low-Maintenance Layout & Style, Main Level Features Well-Equipped Kitchen with Appliances Included, Half-Bathroom, & Laundry Area with Washer/Dryer. Spacious Open Living Room with Tile Flooring & Cozy Wood-Burning Fireplace. Small Private Patio for Relaxation & Storage Closet. Second Level Complete with Brand-New Carpet, 2 Nicely-Sized Bedrooms, Each with Ensuite Bathroom with Tub/Shower. North East ISD Schools.
-
2025-05-13historical $850
-
2025-05-05$850
-
2025-05-05historical $850
-
2025-05-01historical $850
-
2025-05-01$850
-
2025-03-25$850
-
2022-03-16price $1,150
ⓘ Source: listings_history table (triggers on properties + properties_extension) + one-shot
backfill from property_details.listing_events for pre-trigger history.
Tax reassessment forecast TX · Resets to sale price
- Current annual tax
- $3,898 · $325/mo
- Projected year-2 tax
- $3,898 · $325/mo
- Expected delta
- $0/yr ($0/mo · 0.0%)
ⓘ Screening estimate from a state-policy table — verify with the county assessor before closing.
Climate risk First Street
- Flood 1/10 Low FEMA zone X (unshaded) · 0% chance over 30 yrs
- Wildfire 1/10 Low
- Heat 8/10 Severe 7 d/yr ≥108°F today · 23 d/yr by 30 yrs out
- Wind 7/10 Severe 78% chance of damaging wind over 30 yrs
- Air quality 2/10 Low 1 unhealthy d/yr today · 1 by 30 yrs out
Nearby sold comps map
Loading sold comps map…
Walkable amenities ~0.75 mi
Loading nearby amenities…
Taxation est. · year 1
- Rental income
- $17,554
- − Mortgage interest
- −$8,122
- − Property taxes
- −$3,898
- − Insurance
- −$725
- − Repairs & maintenance
- −$1,404
- − Management
- −$1,404
- − HOA
- −$1,320
- − Depreciation
- −$4,218
- Taxable loss
- −$3,538
- Est. tax savings @ 24.0%
- +$849
- After-tax cash flow
- $-351/yr
For passive investors: Depreciation is non-cash, so a rental often shows a tax loss while cash-flowing — sheltering income. Rental losses are passive: they offset passive income freely, and up to $25,000/yr can offset ordinary (W-2) income if you actively participate and your MAGI is under $100k (phasing out to $0 by $150k); unused losses carry forward. On sale, claimed depreciation is recaptured at up to 25%, and gains may owe capital-gains tax (a 1031 exchange can defer both). Figures are a year-1 estimate at your 24.0% rate — not tax advice; consult a CPA.
Schools (NCES district)
- District
- North East ISD
- NCES district ID
- 4832940
- Math proficiency
- 38% ▼ -14.00%
- Reading proficiency
- 49% ▼ -4.00%
- Median HH income
- $57,715
- Composite
- 38.1/100
- National rank
- #4276
- State rank
- #276 of 826 in TX
Livability — San Antonio
- Score
- 80/100
- State rank
- #31
- US rank
- #1616
Category grades
Schools grade is shown separately in the Schools card above.
Census & demographics
- Census place
- San Antonio, TX
- County
- Bexar County · 1,990,555 people
- City population
- 1,806,925
- Metro
- San Antonio-New Braunfels, TX
- Population (ZIP)
- 51,933
- Household income
- $91,013
- Rent vs Own
- Severe rent burden
- 828.0
Population outlook (Bexar County) Hauer SSP2
- Today (2025)
- 2,336,851 people
- By 2030
- 2,560,728 · +9.6%
- By 2040
- 3,020,569 · +29.3%
- By 2050
- 3,493,522 · +49.5%
- By 2075
- 4,668,459 · +99.8%
- By 2100
- 5,533,242 · +136.8%
Race, ethnicity, and origin ACS 2023
- Neighborhood character
- Diverse neighborhood (Simpson 0.62)
- Race & ethnicity
- Hispanic / Latino 45% White 42% Two or more races 24% Black 7% Asian 2%
- Hispanic origin (detail)
- Mexican 36% Puerto Rican 1%
- Common ancestry
- Slovak 2% Romanian 2% Lithuanian 2%
- Foreign-born
- 11% · Canada, Jamaica, Vietnam
- Languages at home
- 74% English-only · Spanish 22% Vietnamese 1% Arabic 1%
Political lean MEDSL · Bexar
- 2024 margin
- Lean D (+9.8) · D 54.3% · R 44.6% · Other 1.1%
- 2008→2024 swing
- +4.2pp toward D · 2008: 5.6pp · 2024: 9.8pp
- All cycles
- 2024: D+9.8 2020: D+18.2 2016: D+13.5 2012: D+4.6 2008: D+5.6
Not yet ingested
- Civics
- —
Market trends
- HPI YoY
- ▼ -89.75%
- Current HPI
- 258.6065
- Rent YoY
- ▼ -2.72%
- Metro
- San Antonio-New Braunfels, TX
- State GDP YoY
- ▲ 3.95%
- F500 in state
- 110
Industry mix (Fortune 500 HQ in TX)
| Industry | F500 HQs | Revenue |
|---|---|---|
| Energy | 16 | $1,198B |
|
||
| Technology | 5 | $198B |
|
||
| Engineering / Construction | 4 | $72B |
|
||
| Energy Services | 3 | $60B |
|
||
| Utilities | 3 | $41B |
|
||
| Healthcare | 2 | $330B |
|
||
Price history
+12508.7% since first listed9 events — show timeline
- 2026-05-18 Price Changed $145,000 LERA
- 2026-04-04 Listed $150,000 LERA
- 2025-05-13 Rental Removed $850 SHOWMOJO
- 2025-05-05 Listed for Rent $850 SHOWMOJO
- 2025-05-05 Rental Removed $850 SHOWMOJO2
- 2025-05-01 Rental Removed $850 SHOWMOJO
- 2025-05-01 Listed for Rent $850 SHOWMOJO2
- 2025-03-25 Listed for Rent $850 SHOWMOJO
- 2022-03-16 Price Changed $1,150 RENT.
Property tax history
+5.2%/yrLatest (2025): $3,898 · -1.9% YoY. Source: county tax records.
Cash-flow waterfall
monthlySold comps — $/sqft
last 12 mo · ≤1 miLoading sold comps…