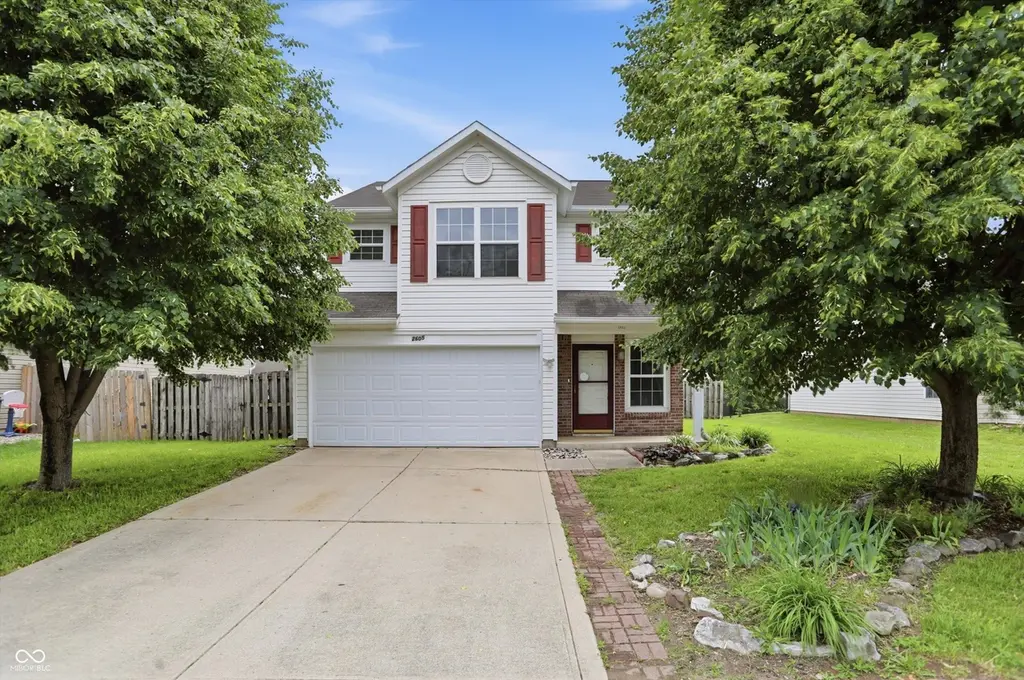
2605 Bristlecone Dr · Indianapolis city (balance), IN
Flood risk 1/10 · Minimal
- FEMA flood zone
- X (unshaded)
- Chance of flooding over 30 yrs
- 0.0%
- Est. flood insurance / yr
- $507 – $1,088
Fire risk 1/10 · Minimal
- Est. fire insurance / yr
- $717 – $1,331
Heat risk 4/10 · Minor
- Hot days now (above 101°F)
- 7 days/yr
- Hot days in 30 yrs
- 19 days/yr
Wind risk 2/10 · Minimal
- Chance of severe wind over 30 yrs
- 1.0%
Air-quality risk 3/10 · Minor
- Unhealthy air days now
- 2 days/yr
- Unhealthy air days in 30 yrs
- 3 days/yr
Risk factors via First Street. Map © Google.
Why this score? — see what drove the D grade
The composite is a weighted blend of 9 inputs, each scored 0–100. Each bar is that input's sub-score; the figure is the points it added to the 100-point composite (weight × sub-score).
- Cash flow +13.5/30.0
- ARV discount +7.8/15.0
- DSCR +4.1/10.0
- Schools +3.5/10.0
- 1% rule +3.4/10.0
- Rent growth +3.4/5.0
- Livability +2.5/5.0
- Condition / age +2.5/5.0
- Appreciation +0.0/10.0
$245,000
🖨 Deal sheet 📄 Offer letter ✓ Due diligence
Listing remarks MLS
Beautiful 1825 Sq. ft home with 2 story entry, huge great room with laminate flooring is open to big kitchen with all appliances, pantry and large eat-in area. Top of the stairs has small loft area. Master suite is big and has vaulted ceiling. Master bath leads to walk in closet. Other 2 bedrooms are good size too and one has walk-in closet too. Also Laundry area is on second level! Backyard is totally enclosed by privacy fence.
Key facts
- Fenced
- Highway access
- Cedar park
Tags
Property features AI
Finance
- Other: Property on ~0.16 acre (<1/4 acre)
Exterior
- Parking: Attached 2-car garage (approx. 400 sq ft)
- Security: Smoke detector(s)
- Utilities: Public water; Municipal sewer connected; Cable available; Natural gas available; Solid waste service
- Home design: Single family residence; Two levels
- Construction: Vinyl with brick and brick exterior; Slab foundation
- Exterior features: Covered patio/porch; Storage shed; Full privacy fence; Sidewalks
Interior
- Kitchen: Dishwasher; Disposal; Microwave; Microhood; Electric oven; Refrigerator; Pantry; Eat-in kitchen
- Bedrooms: 3 upstairs bedrooms; Primary bedroom with walk-in closet
- Bathrooms: 2 full bathrooms (both upstairs); 1 half bathroom (main level); Primary bathroom with tub and shower
- Heating & cooling: Forced air heating (electric); Central air conditioning
- Interior features: Attic access; Built-in features; High ceilings; Vaulted/Cathedral ceilings; Walk-in closet(s); Eat-in kitchen; Pantry; Smoke alarm
- Laundry & utility: Upper-level laundry; Electric water heater
Neighborhood map
What this means for you Summary
Snapshot
- This is a 4-bed/1.5-bath single-family listed at $245k.
Deal economics
- At list price, monthly cash flow is $8 ($101/yr) — positive.
- The deal already cash-flows at list — no discount required.
- To meet the 1% rule (rent ≥ 1% of price), the offer needs to be $205k (16.5% below list).
- Recommended offer: $205k (16.5% below list) — sets the bar for 1% rule.
- Cap rate 6.3% vs local median 4.4% in Indianapolis city (balance) — top-decile yield for the area; either an underpriced asset or a hidden risk that comps aren't pricing in. Stress-test before assuming the spread holds.
Location & tenants
- Location reads: area grade D — affects rentability + tenant quality, not the cash-flow math above.
- Perry Township Schools (urban): math 36% / reading 45% proficiency, ranked #138 of 301 in IN (top 46%) — families likely to look elsewhere, expect single-tenant / working-renter base with shorter leases.
- Market conditions: Rents rising (+3.5%/yr); 210 active listings in the ZIP; 7 comparable units currently listed for rent nearby; rentals leasing fast (median 4d on market — plan ~1-2 weeks tenant-placement turnaround); solid renter incomes; 1,906 units permitted in Marion County in 2024 (621 in 5+ unit buildings).
Forward outlook
- Local home prices are declining (-3.0%/yr); year-one equity from $2k of loan paydown is wiped out by about $7k of value loss. Plan a longer hold.
- Marion County population projected at +18% by 2050 — long-run rental-demand tailwind backs the buy-and-hold thesis.
Negotiation context
- It's been on market 33 days — a 3% lower offer ($238k) is reasonable based on typical stale-listing flexibility.
- 5 sale attempts since 22y ago with the ask held roughly flat each time — persistent listings suggest the price (not the market) is what's stuck; bring a comps-based counter.
- Current owner paid $135k; list at $245k implies a 81% gain — meaningful room to come down on a strong offer.
Questions for the listing agent
- It's been on market 33 days. Have you received any prior offers? Is the seller open to a 16% concession, seller financing, or rate buy-down credit?
- Is there a deadline driving the sale (1031 exchange, divorce, estate, relocation)? That informs how much negotiation room exists.
- The area grade is low — what's the realistic commute time and amenity access for the typical tenant pool here? Any planned neighborhood developments (good or bad) we should know about?
- What's the average days-on-market for RENTAL listings here right now (not sales)? A rising rental-DOM trend means longer vacancies and softer asking-rent achievability than the comps imply.
- What's the recent tenant-quality profile in this submarket — average credit score on applications, eviction rate, late-payment / NSF rate, and stable-employment percentage? A property-management company in the area should have these aggregated.
- How much new for-sale + rental construction is in the pipeline within 1–3 miles? Heavy new supply typically softens prices + rents 12–24 months out; constrained supply supports both.
Investment metrics
- 1% rule
- 0.84% ✗
- Cap rate
- 6.33%
- Cash-on-cash
- 0.15%
- DSCR
- 1.01
- GRM
- 10.0
CMA / ARV
- ARV (on-the-fly)
- $246,375
- Comps found
- 12
Show comp detail 12 sales within ~0.75 mi
| Address | Dist | Beds/Ba | Sqft | Sold | Price | $/sf | Match |
|---|---|---|---|---|---|---|---|
| 2531 Redland Ln | 0.22mi | 3/2.5 (-1) | 1,824 (-0%) | 2mo | $239,900 | $132 | 79 |
| 6406 Pinebark Pl | 0.21mi | 3/2.5 (-1) | 1,876 (+3%) | 3mo | $275,000 | $147 | 74 |
| 2614 Bristlecone Dr | 0.03mi | 3/2.5 (-1) | 1,700 (-7%) | 8mo | $260,000 | $153 | 71 |
| 6425 Avacado Dr | 0.19mi | 4/2.5 | 1,672 (-8%) | 6mo | $225,000 | $135 | 68 |
| 2501 Black Antler Ct | 0.19mi | 3/2.5 (-1) | 1,996 (+9%) | 5mo | $210,000 | $105 | 62 |
| 6327 Pinebark Pl | 0.24mi | 4/2.5 | 1,584 (-13%) | 5mo | $260,000 | $164 | 58 |
| 6666 Black Antler Cir | 0.32mi | 3/2.5 (-1) | 1,998 (+10%) | 7mo | $235,000 | $118 | 54 |
| 2824 Earlswood Ln | 0.34mi | 3/2.5 (-1) | 2,036 (+12%) | 9mo | $252,500 | $124 | 49 |
| 7033 Harness Lakes Dr | 0.73mi | 3/2.5 (-1) | 1,737 (-5%) | 4mo | $258,000 | $149 | 45 |
| 2603 Santaro Ct | 0.71mi | 4/2.5 | 2,027 (+11%) | 2mo | $298,000 | $147 | 42 |
| 2616 Mingo Ln | 0.74mi | 3/2.5 (-1) | 1,992 (+9%) | 0mo | $150,000 | $75 | 41 |
| 1730 Brassica Ln | 0.75mi | 3/2.5 (-1) | 2,029 (+11%) | 3mo | $265,000 | $131 | 35 |
Match score weights: distance 35% · size 25% · config 20% · recency 20%. Top-matched comps best support the ARV.
Projected returns pro-forma
-3.0% appreciation · 3.46% rent growth · sell at horizon
- IRR
- -15.6%
- Equity multiple
- 0.44×
- Total profit
- $-38,233
- Equity at exit
- $36,530
- IRR
- -6.4%
- Equity multiple
- 0.58×
- Total profit
- $-28,748
- Equity at exit
- $21,183
Cash invested: $68,600 (down + closing). Projections, not guarantees.
Landlord ↔ Tenant lean methodology
- Overall (STATE)
- 90 Strongly Landlord-Friendly
- State Indiana
- 90 Strongly Landlord-Friendly · R+11
- County
- — inherits STATE
- City
- — inherits STATE
ZIP-level market 46217
- Rents YoY
- 3.5%
- Active inventory
- 210
- Price-to-rent
- 10.0×
Monthly cashflow live
- Estimated rent
- $2,046 high interval (Pro) →
- Mortgage (P&I)
- −$1,285
- Tax from tax record
- −$221 /mo · $2,653/yr
- Insurance
- −$102
- HOA
- −$0
- Vacancy / Maint / Mgmt
- −$430
- Net cashflow
- $8
Break-even live
UW: 25.0% down · 7.5% · 30yr · 1.5% tax · 5.0% vac · 8.0% maint · 8.0% mgmt
Financing live
Cash to close
- Down payment
- $61,250
- Closing costs
- $7,350
- Reserves months
- —
- Total cash needed
- —
Loan-product check · same deal, 3 products live
Conventional
25% down · 7.5% · 30yr
- Down + closing
- —
- Monthly P&I
- —
- Monthly cashflow
- —
- DSCR
- —
- Eligible?
- —
Personal DTI + credit; lowest rate.
DSCR
20% down · 8.5% · 30yr
- Down + closing
- —
- Monthly P&I
- —
- Monthly cashflow
- —
- DSCR
- —
- Eligible?
- —
No personal income docs; deal must DSCR.
Hard money
10% down · 12.0% · 12mo
- Down + closing
- —
- Monthly P&I
- —
- Monthly cashflow
- —
- DSCR
- —
- Eligible?
- —
Short-term bridge; refi at stabilization.
Rent comps 7 comps
| Address | Beds | Baths | Sqft | Rent | $/sqft | DOM | Units | Dist |
|---|---|---|---|---|---|---|---|---|
| 6666 Black Antler Dr Indianapolis, IN | 3.0 | 2.5 | 1998 | $1,900 | $0.95 | 15d | 1 | 0.20mi |
| 2729 Redland Ln Indianapolis, IN | 3.0 | 2.5 | 1757 | $1,829 | $1.04 | 3d | 1 | 0.23mi |
| 6744 Everbloom Ln Indianapolis, IN | 3.0 | 2.5 | 1568 | $1,931 | $1.23 | 24d | 1 | 0.51mi |
| 7150 Parklake Pl Indianapolis, IN | 3.0 | 2.0 | 1288 | $1,895 | $1.47 | 3d | 1 | 0.84mi |
| 7247 Vista Cir Indianapolis, IN | 1.0–3.0 | 1.0–2.0 | 1086 | $2,111 | $1.94 | 2d | 25 | 0.93mi |
| 2808 Dawnlake Dr Indianapolis, IN | 3.0 | 2.5 | 1481 | $1,750 | $1.18 | 3d | 1 | 0.95mi |
| 1346 Alonzo Pl Indianapolis, IN | 3.0 | 2.5 | 1811 | $1,866 | $1.03 | 24d | 1 | 1.14mi |
Listing history 23 events
-
2026-06-18days on market $245,000 Active 33 DOM
-
2026-06-17days on market $245,000 Active 32 DOM
-
2026-06-16days on market $245,000 Active 31 DOM
-
2026-06-15days on market $245,000 Active 30 DOM
-
2026-06-13days on market $245,000 Active 28 DOM
-
2026-06-09days on market $245,000 Active 24 DOM
-
2026-06-08days on market $245,000 Active 23 DOM
-
2026-06-07days on market $245,000 Active 22 DOM
-
2026-06-03days on market $245,000 Active 18 DOM
-
2026-06-02days on market $245,000 Active 17 DOM
-
2026-06-01days on market $245,000 Active 16 DOM
-
2026-05-31days on market $245,000 Active 15 DOM
-
2026-05-16$245,000 Active
-
2025-06-03historical $1,650
-
2025-05-17$1,650
-
2017-10-27soldstatus $135,000 Sold 432-char remark
Show marketing remark (432 chars)
Beautiful 1825 Sq. ft home with 2 story entry, huge great room with laminate flooring is open to big kitchen with all appliances, pantry and large eat-in area. Top of the stairs has small loft area. Master suite is big and has vaulted ceiling. Master bath leads to walk in closet. Other 2 bedrooms are good size too and one has walk-in closet too. Also Laundry area is on second level! Backyard is totally enclosed by privacy fence.
-
2017-10-04status Pending 432-char remark
Show marketing remark (432 chars)
Beautiful 1825 Sq. ft home with 2 story entry, huge great room with laminate flooring is open to big kitchen with all appliances, pantry and large eat-in area. Top of the stairs has small loft area. Master suite is big and has vaulted ceiling. Master bath leads to walk in closet. Other 2 bedrooms are good size too and one has walk-in closet too. Also Laundry area is on second level! Backyard is totally enclosed by privacy fence.
-
2017-09-14historical Active with Contingency 432-char remark
Show marketing remark (432 chars)
Beautiful 1825 Sq. ft home with 2 story entry, huge great room with laminate flooring is open to big kitchen with all appliances, pantry and large eat-in area. Top of the stairs has small loft area. Master suite is big and has vaulted ceiling. Master bath leads to walk in closet. Other 2 bedrooms are good size too and one has walk-in closet too. Also Laundry area is on second level! Backyard is totally enclosed by privacy fence.
-
2017-09-08$135,000 Active 432-char remark
Show marketing remark (432 chars)
Beautiful 1825 Sq. ft home with 2 story entry, huge great room with laminate flooring is open to big kitchen with all appliances, pantry and large eat-in area. Top of the stairs has small loft area. Master suite is big and has vaulted ceiling. Master bath leads to walk in closet. Other 2 bedrooms are good size too and one has walk-in closet too. Also Laundry area is on second level! Backyard is totally enclosed by privacy fence.
-
2008-02-15soldstatus $89,000 222-char remark
Show marketing remark (222 chars)
Better than new (4 yrs old) 1825 sq, ft,Two-Story home with Loft, 3 BRS + 2.5 Baths, fully fenced yard, lovely landscaping! Priced for Short-Sale (Preforeclosure)! All offers must have preapproval letter. Move-in Read y!
-
2007-06-11$89,900 222-char remark
Show marketing remark (222 chars)
Better than new (4 yrs old) 1825 sq, ft,Two-Story home with Loft, 3 BRS + 2.5 Baths, fully fenced yard, lovely landscaping! Priced for Short-Sale (Preforeclosure)! All offers must have preapproval letter. Move-in Read y!
-
2004-09-13historical
-
2004-01-15$119,900
ⓘ Source: listings_history table (triggers on properties + properties_extension) + one-shot
backfill from property_details.listing_events for pre-trigger history.
Tax reassessment forecast IN · Partial reset (capped growth)
- Current annual tax
- $2,653 · $221/mo
- Projected year-2 tax
- $2,653 · $221/mo
- Expected delta
- $0/yr ($0/mo · 0.0%)
ⓘ Screening estimate from a state-policy table — verify with the county assessor before closing.
Climate risk First Street
- Flood 1/10 Low FEMA zone X (unshaded) · 0% chance over 30 yrs
- Wildfire 1/10 Low
- Heat 4/10 Moderate 7 d/yr ≥101°F today · 19 d/yr by 30 yrs out
- Wind 2/10 Low 100% chance of damaging wind over 30 yrs
- Air quality 3/10 Moderate 2 unhealthy d/yr today · 3 by 30 yrs out
Nearby sold comps map
Loading sold comps map…
Walkable amenities ~0.75 mi
Loading nearby amenities…
Taxation est. · year 1
- Rental income
- $24,553
- − Mortgage interest
- −$13,724
- − Property taxes
- −$2,653
- − Insurance
- −$1,225
- − Repairs & maintenance
- −$1,964
- − Management
- −$1,964
- − Depreciation
- −$7,127
- Taxable loss
- −$4,105
- Est. tax savings @ 24.0%
- +$985
- After-tax cash flow
- $1,086/yr
For passive investors: Depreciation is non-cash, so a rental often shows a tax loss while cash-flowing — sheltering income. Rental losses are passive: they offset passive income freely, and up to $25,000/yr can offset ordinary (W-2) income if you actively participate and your MAGI is under $100k (phasing out to $0 by $150k); unused losses carry forward. On sale, claimed depreciation is recaptured at up to 25%, and gains may owe capital-gains tax (a 1031 exchange can defer both). Figures are a year-1 estimate at your 24.0% rate — not tax advice; consult a CPA.
Schools (NCES district)
- District
- Perry Township Schools
- NCES district ID
- 1808820
- Math proficiency
- 36% ▼ -13.00%
- Reading proficiency
- 45% ▼ -6.00%
- Median HH income
- $47,170
- Composite
- 34.61/100
- National rank
- #5153
- State rank
- #138 of 301 in IN
Livability — Indianapolis city (balance)
No livability data for this city. (Only ~50 U.S. cities are tracked.)
Census & demographics
- Census place
- Indianapolis city (balance), IN
- County
- Marion County · 998,460 people
- City population
- 881,119
- Metro
- Indianapolis-Carmel-Anderson, IN
- Population (ZIP)
- 36,917
- Household income
- $92,029
- Rent vs Own
- Severe rent burden
- 472.0
Population outlook (Marion County) Hauer SSP2
- Today (2025)
- 1,025,572 people
- By 2030
- 1,065,727 · +3.9%
- By 2040
- 1,141,577 · +11.3%
- By 2050
- 1,208,920 · +17.9%
- By 2075
- 1,367,288 · +33.3%
- By 2100
- 1,438,201 · +40.2%
Race, ethnicity, and origin ACS 2023
- Neighborhood character
- Diverse neighborhood (Simpson 0.60)
- Race & ethnicity
- White 59% Asian 20% Black 10% Hispanic / Latino 8% Two or more races 6%
- Hispanic origin (detail)
- Mexican 6%
- Common ancestry
- Lithuanian 3% Romanian 2% Iranian 1%
- Foreign-born
- 17% · Philippines, Canada, China
- Languages at home
- 76% English-only · Other Asian/Pacific 15% Spanish 6% Other Indo-European 1%
Political lean MEDSL · Marion
- 2024 margin
- Strong D (+27.7) · D 63.0% · R 35.3% · Other 1.7%
- 2008→2024 swing
- -0.7pp no change · 2008: 28.4pp · 2024: 27.7pp
- All cycles
- 2024: D+27.7 2020: D+29.1 2016: D+22.8 2012: D+22.2 2008: D+28.4
Not yet ingested
- Civics
- —
Market trends
- HPI YoY
- ▼ -221.18%
- Current HPI
- 223.147
- Rent YoY
- ▲ 3.46%
- Metro
- Indianapolis-Carmel-Anderson, IN
- State GDP YoY
- ▲ 2.90%
- F500 in state
- 18
Industry mix (Fortune 500 HQ in IN)
| Industry | F500 HQs | Revenue |
|---|---|---|
| Industrial Machinery | 2 | $37B |
|
||
| Healthcare | 1 | $177B |
|
||
| Pharmaceuticals | 1 | $45B |
|
||
| Metals / Steel | 1 | $18B |
|
||
| Agriculture | 1 | $17B |
|
||
| Packaging | 1 | $12B |
|
||
Price history
+104.3% since first listed11 events — show timeline
- 2026-05-16 Listed $245,000 MIBOR as Distributed by MLS Grid
- 2025-06-03 Rental Removed $1,650 MIBOR
- 2025-05-17 Listed for Rent $1,650 MIBOR
- 2017-10-27 Sold (MLS) $135,000 MIBOR as Distributed by MLS Grid
- 2017-10-04 Pending — MIBOR as Distributed by MLS Grid
- 2017-09-14 Contingent — MIBOR as Distributed by MLS Grid
- 2017-09-08 Listed $135,000 MIBOR as Distributed by MLS Grid
- 2008-02-15 Sold (MLS) $89,000 MIBOR as Distributed by MLS Grid
- 2007-06-11 Listed $89,900 MIBOR as Distributed by MLS Grid
- 2004-09-13 Listing Removed — MIBOR as Distributed by MLS Grid
- 2004-01-15 Listed $119,900 MIBOR as Distributed by MLS Grid
Property tax history
+7.6%/yrLatest (2025): $2,653 · +11.7% YoY. Source: county tax records.
Cash-flow waterfall
monthlySold comps — $/sqft
last 12 mo · ≤1 miLoading sold comps…