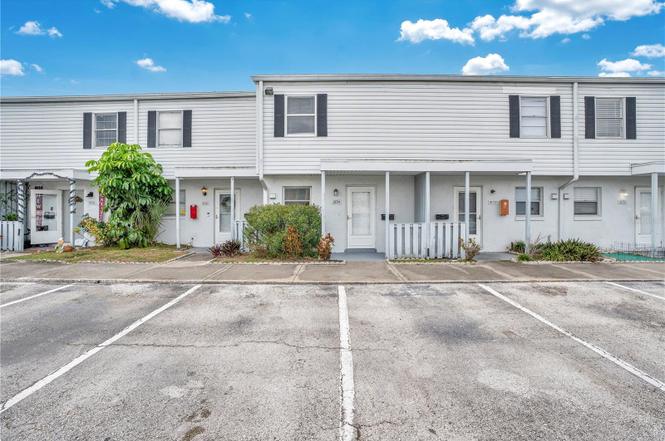
1824 Amberly Ave Unit T8 · Orlando, FL
Flood risk No data
- FEMA flood zone
- —
- Chance of flooding over 30 yrs
- —
- Est. flood insurance / yr
- —
Fire risk No data
- Est. fire insurance / yr
- —
Heat risk No data
- Hot days now (above threshold)
- —
- Hot days in 30 yrs
- —
Wind risk No data
- Chance of severe wind over 30 yrs
- —
Air-quality risk No data
- Unhealthy air days now
- —
- Unhealthy air days in 30 yrs
- —
Risk factors via First Street. Map © Google.
Why this score? — see what drove the D grade
The composite is a weighted blend of 9 inputs, each scored 0–100. Each bar is that input's sub-score; the figure is the points it added to the 100-point composite (weight × sub-score).
- Cash flow +10.9/30.0
- ARV discount +7.5/15.0
- 1% rule +6.1/10.0
- Livability +4.3/5.0
- Schools +4.1/10.0
- DSCR +3.2/10.0
- Condition / age +2.5/5.0
- Rent growth +2.3/5.0
- Appreciation +0.0/10.0
$150,000
🖨 Deal sheet 📄 Offer letter ✓ Due diligence
Listing remarks
Under contract-accepting backup offers. One or more photo(s) has been virtually staged. Price improved on this investor-friendly 2-bedroom, 2.5-bath condo in Villa Marquis. Functional layout includes a primary suite with en-suite bath, second full bath in the upstairs hallway, and first-floor half bath for guests. Ideal for long-term rental, portfolio expansion, or value-add opportunity. Conveniently located near major roads, shopping, dining, and employment centers. Community features a pool and low-maintenance condo living. Seller motivated and ready to consider serious offers.
Key facts
- Second full bathroom
- $305 HOA
- Community pool
Tags
Property features AI
Finance
- Other: Total monthly fees $305.76 (total annual $3,669.12)
- Financial info: Lease restrictions apply
- HOA & community: Monthly HOA $305.76 (includes pool, structure maintenance, management); Association approval required; Pets allowed with breed restrictions; Association name: Dennis Kapsis
Exterior
- Parking: Assigned parking
- Utilities: Public water; Public sewer; Public utilities
- Home design: Condominium; 2 stories; Faces east; Unit on 2nd floor
- Construction: Stucco construction; Other roof; Slab foundation; Built as part of building number 1824
- Exterior features: Paved road access; Community pool
Interior
- Kitchen: Cooktop; Microwave; Refrigerator
- Bedrooms: 2 bedrooms
- Flooring: Laminate; Tile
- Bathrooms: 2 full bathrooms; 1 half bathroom
- Heating & cooling: Central heating; Central air conditioning
- Interior features: Thermostat; Window treatments
- Laundry & utility: Washer; Dryer; Laundry closet on upper level
Neighborhood map
What this means for you Summary
Snapshot
- This is a 2-bed/3.0-bath condo listed at $150k.
Deal economics
- At list price, monthly cash flow is $-67 ($-799/yr) — negative.
- To cash-flow at today's rent, offer at most $138k (7.8% below list).
- Meets the 1% rule at list price ($2k rent vs $150k).
- Recommended offer: $132k (12.0% below list) — sets the bar for market timing.
- Cap rate 5.8% vs local median 3.0% in Orlando — top-decile yield for the area; either an underpriced asset or a hidden risk that comps aren't pricing in. Stress-test before assuming the spread holds.
Location & tenants
- Location reads 86/100 on livability (#12 in FL, #360 nationally) — a professional / high-income tenant draw. Strengths: amenities A+, commute A+, housing A+.
- Orange (suburban): math 46% / reading 51% proficiency, ranked #43 of 73 in FL (top 59%) — families likely to look elsewhere, expect single-tenant / working-renter base with shorter leases.
- Market conditions: Rents soft (-0.7%/yr); 372 active listings in the ZIP; 40 comparable units currently listed for rent nearby; rentals at typical pace (median 22d on market — plan ~3-4 weeks tenant-placement turnaround); 8,053 units permitted in Orange County in 2024 (3,133 in 5+ unit buildings).
- This rent runs 35% of the median local income ($57k/yr) — at the standard rent-burdened threshold; future hikes will face affordability resistance.
Forward outlook
- Local home prices are declining (-3.0%/yr); year-one equity from $1k of loan paydown is wiped out by about $4k of value loss. Plan a longer hold.
- Orange County population projected at +52% by 2050 — long-run rental-demand tailwind backs the buy-and-hold thesis.
Negotiation context
- It's been on market 177 days — a 12% lower offer ($132k) is reasonable based on typical stale-listing flexibility.
- 3 sale attempts since 2y ago; this cycle's ask has dropped $15k (9%) from the opening price — seller is motivated, your offer sets the floor, not the list.
- Current owner paid $112k; 34% above their basis — modest negotiation headroom, anchor on the comps not their cost.
Questions for the listing agent
- What do current leases actually rent for vs. the listed asking? Can we see a recent rent roll and the last 12 months of T-12 income?
- It's been on market 177 days. Have you received any prior offers? Is the seller open to a 12% concession, seller financing, or rate buy-down credit?
- Built in 1973 — when were the roof, HVAC, electrical panel, plumbing, and water heater last replaced?
- What does the HOA fee cover, when was the last increase, and are there any pending special assessments or reserve-fund shortfalls?
- Any open or pending special assessments — roof, HVAC, plumbing, elevator, façade? What's the per-unit balance and payoff schedule, and is the seller paying it off at close or rolling it to the buyer?
- Why hasn't it sold? Are there any deal-killer items the seller is aware of (foundation, flood, title, zoning, code violations)?
- Is there a deadline driving the sale (1031 exchange, divorce, estate, relocation)? That informs how much negotiation room exists.
- Schools are B-rated — typically a magnet for longer-tenancy family renters. What's the average tenant stay here, and is there a school-zone premium baked into asking?
- The area grade is low — what's the realistic commute time and amenity access for the typical tenant pool here? Any planned neighborhood developments (good or bad) we should know about?
- What's the average days-on-market for RENTAL listings here right now (not sales)? A rising rental-DOM trend means longer vacancies and softer asking-rent achievability than the comps imply.
- What's the recent tenant-quality profile in this submarket — average credit score on applications, eviction rate, late-payment / NSF rate, and stable-employment percentage? A property-management company in the area should have these aggregated.
- How much new apartment / multifamily construction is in the pipeline within 1–3 miles? Heavy new supply (>2% of stock underway) typically softens rents 12–24 months out; light construction supports rent growth.
Investment metrics
- 1% rule
- 1.11% ✓
- Cap rate
- 5.76%
- Cash-on-cash
- -1.90%
- DSCR
- 0.92
- GRM
- 7.5
CMA / ARV
No comps found within radius.
Projected returns pro-forma
-3.0% appreciation · 0.0% rent growth · sell at horizon
- IRR
- -23.9%
- Equity multiple
- 0.21×
- Total profit
- $-33,184
- Equity at exit
- $22,365
- IRR
- -37.4%
- Equity multiple
- -0.24×
- Total profit
- $-52,234
- Equity at exit
- $12,969
Cash invested: $42,000 (down + closing). Projections, not guarantees.
Landlord ↔ Tenant lean methodology
- Overall (STATE)
- 87 Strongly Landlord-Friendly
- State Florida
- 87 Strongly Landlord-Friendly · R+3
- County
- — inherits STATE
- City
- — inherits STATE
ZIP-level market 32822
- Home prices YoY
- -21.1%
- Rents YoY
- -0.7%
- Active inventory
- 372
- Price-to-rent
- 7.5×
Monthly cashflow live
- Estimated rent
- $1,664 high interval (Pro) →
- Mortgage (P&I)
- −$787
- Tax from tax record
- −$227 /mo · $2,721/yr
- Insurance
- −$62
- HOA
- −$305
- Vacancy / Maint / Mgmt
- −$349
- Net cashflow
- $-67
Break-even live
UW: 25.0% down · 7.5% · 30yr · 1.5% tax · 5.0% vac · 8.0% maint · 8.0% mgmt
Financing live
Cash to close
- Down payment
- $37,500
- Closing costs
- $4,500
- Reserves months
- —
- Total cash needed
- —
Loan-product check · same deal, 3 products live
Conventional
25% down · 7.5% · 30yr
- Down + closing
- —
- Monthly P&I
- —
- Monthly cashflow
- —
- DSCR
- —
- Eligible?
- —
Personal DTI + credit; lowest rate.
DSCR
20% down · 8.5% · 30yr
- Down + closing
- —
- Monthly P&I
- —
- Monthly cashflow
- —
- DSCR
- —
- Eligible?
- —
No personal income docs; deal must DSCR.
Hard money
10% down · 12.0% · 12mo
- Down + closing
- —
- Monthly P&I
- —
- Monthly cashflow
- —
- DSCR
- —
- Eligible?
- —
Short-term bridge; refi at stabilization.
Rent comps 40 comps
| Address | Beds | Baths | Sqft | Rent | $/sqft | DOM | Units | Dist |
|---|---|---|---|---|---|---|---|---|
| 1854 Caralee Blvd #3 Orlando, FL | 2.0 | 1.0 | 850 | $1,700 | $2.00 | 24d | 1 | 0.04mi |
| 1847 Caralee Blvd #4 Orlando, FL | 2.0 | 1.0 | 850 | $1,650 | $1.94 | 3d | 1 | 0.08mi |
| 6254 S Bend Sq #173 Orlando, FL | 2.0 | 2.5 | 1104 | $1,699 | $1.54 | 24d | 1 | 0.10mi |
| 6104 Curry Ford Rd #207 Orlando, FL | 2.0 | 2.0 | 1051 | $1,600 | $1.52 | 24d | 1 | 0.11mi |
| 6104 Curry Ford Rd #108 Orlando, FL | 2.0 | 2.0 | 1051 | $1,500 | $1.43 | 8d | 1 | 0.11mi |
| 6203 Curry Ford Rd Orlando, FL | 1.0–3.0 | 1.0–2.0 | 1011 | $1,720 | $1.70 | 14d | 1 | 0.13mi |
| 1724 Townhall Ln Orlando, FL | 2.0 | 1.5 | 1018 | $1,595 | $1.57 | 22d | 1 | 0.14mi |
| 6110 Curry Ford Rd #117 Orlando, FL | 1.0 | 1.0 | 742 | $1,175 | $1.58 | 24d | 1 | 0.15mi |
| 6231 Yorktown Dr #140 Orlando, FL | 3.0 | 2.5 | 1307 | $1,890 | $1.45 | 3d | 1 | 0.15mi |
| 2536 Woodgate Blvd #107 Orlando, FL | 2.0 | 2.0 | 930 | $1,650 | $1.77 | 22d | 1 | 0.17mi |
| 6118 Curry Ford Rd Orlando, FL | 1.0 | 1.0 | 742 | $1,175 | $1.58 | 24d | 1 | 0.19mi |
| 1610 Little River Dr #20 Orlando, FL | 3.0 | 2.5 | 1307 | $1,800 | $1.38 | 24d | 1 | 0.19mi |
| 5914 Mausser Dr Orlando, FL | 1.0–4.0 | 1.0–2.5 | 1052 | $1,771 | $1.68 | 2d | 13 | 0.20mi |
| 1732 Hidden Creek Blvd #108 Orlando, FL | 2.0 | 2.5 | 1104 | $1,550 | $1.40 | 18d | 1 | 0.20mi |
| 1718 Silver Creek Ct #102 Orlando, FL | 2.0 | 1.5 | 1032 | $1,850 | $1.79 | 22d | 1 | 0.21mi |
| 6299 Arlington Ct #212 Orlando, FL | 2.0 | 1.5 | 1032 | $1,680 | $1.63 | 24d | 1 | 0.21mi |
| 6122 Curry Ford Rd #241 Orlando, FL | 1.0 | 1.0 | 742 | $1,325 | $1.79 | 24d | 1 | 0.23mi |
| 1600 Bending Brook Way Orlando, FL | 2.0 | 2.5 | 1227 | $1,695 | $1.38 | 14d | 1 | 0.23mi |
| 1600 Bending Brook Way Orlando, FL | 2.0 | 2.5 | 1227 | $1,745 | $1.42 | 20d | 1 | 0.23mi |
| 2508 Woodgate Blvd #207 Orlando, FL | 2.0 | 2.0 | 930 | $1,600 | $1.72 | 22d | 1 | 0.25mi |
| 1701 Shady Ridge Ct #247 Orlando, FL | 2.0 | 2.5 | 1104 | $1,600 | $1.45 | 24d | 1 | 0.25mi |
| 2568 Woodgate Blvd Orlando, FL | 1.0–2.0 | 1.0–2.0 | 790 | $1,500 | $1.90 | 4d | 1 | 0.31mi |
| 6020 Village Cir N Orlando, FL | 2.0 | 1.5 | 825 | $1,390 | $1.68 | 24d | 1 | 0.32mi |
| 6077 Village Cir #6077 Orlando, FL | 2.0 | 2.0 | 1022 | $1,800 | $1.76 | 24d | 1 | 0.32mi |
| 6032 Village Cir N #6032 Orlando, FL | 2.0 | 2.0 | 1022 | $1,800 | $1.76 | 24d | 1 | 0.33mi |
| 6083 Village Cir S Orlando, FL | 3.0 | 2.5 | 1128 | $1,695 | $1.50 | 8d | 1 | 0.34mi |
| 6065 Village Cir #6065 Orlando, FL | 2.0 | 1.5 | 860 | $1,425 | $1.66 | 8d | 1 | 0.35mi |
| 6043 Village Cir #6043 Orlando, FL | 2.0 | 1.5 | 860 | $1,550 | $1.80 | 18d | 1 | 0.35mi |
| 2365 Oak Park Way #109 Orlando, FL | 2.0 | 2.0 | 953 | $1,350 | $1.42 | 11d | 1 | 0.39mi |
| 1382 Hendren Dr Orlando, FL | 3.0 | 2.0 | 1175 | $2,150 | $1.83 | 24d | 1 | 0.39mi |
| 2439 Oak Park Way #217 Orlando, FL | 2.0 | 2.0 | 953 | $1,650 | $1.73 | 3d | 1 | 0.41mi |
| 2451 Oak Park Way #120 Orlando, FL | 2.0 | 2.0 | 953 | $1,700 | $1.78 | 4d | 1 | 0.42mi |
| 6031 Scotchwood Gln Orlando, FL | 2.0 | 2.0 | 846 | $1,625 | $1.92 | 24d | 2 | 0.44mi |
| 2683 Oak Park Way #214 Orlando, FL | 2.0 | 2.0 | 950 | $1,700 | $1.79 | 24d | 1 | 0.44mi |
| 1303 Candlewyck Dr Orlando, FL | 2.0 | 1.0 | 904 | $1,500 | $1.66 | 24d | 1 | 0.45mi |
| 6007 Scotchwood Gln #31 Orlando, FL | 2.0 | 2.5 | 1343 | $1,695 | $1.26 | 8d | 1 | 0.46mi |
| 5762 Folkstone Ln Orlando, FL | 1.0–3.0 | 1.0–2.0 | 1081 | $1,967 | $1.82 | 2d | 17 | 0.46mi |
| 2924 Cottage Grove Ct Unit GE Orlando, FL | 3.0 | 2.0 | 1500 | $2,800 | $1.87 | 24d | 1 | 0.51mi |
| 5870 Sundown Cir Orlando, FL | 1.0–2.0 | 1.0–2.0 | 840 | $1,744 | $2.08 | 2d | 25 | 0.56mi |
| 6206 Raintree Dr Unit GE Orlando, FL | 2.0 | 2.0 | 1375 | $1,850 | $1.35 | 22d | 1 | 0.58mi |
HOA detail condo
- Monthly dues
- $305 · $3,660/yr
- Likely covers
- pool
- Assessments
- None detected in remarks — confirm with the listing agent.
Listing history 28 events
-
2026-06-18days on market $150,000 Active 177 DOM
-
2026-06-17days on market $150,000 Active 176 DOM
-
2026-06-16days on market $150,000 Active 175 DOM
-
2026-06-15days on market $150,000 Active 174 DOM
-
2026-06-13days on market $150,000 Active 172 DOM
-
2026-06-13days on market $150,000 Active 171 DOM
-
2026-06-09days on market $150,000 Active 168 DOM
-
2026-06-08days on market $150,000 Active 167 DOM
-
2026-06-07statusdays on market $150,000 Active 166 DOM
-
2026-06-04remarks 586-char remark
-
2026-06-04status $150,000 Pending 163 DOM
-
2026-06-03days on market $150,000 Active 163 DOM
-
2026-06-02days on market $150,000 Active 162 DOM
-
2026-06-02days on market $150,000 Active 161 DOM
-
2026-05-31days on market $150,000 Active 160 DOM
-
2026-05-19price $150,000
-
2026-04-13price $159,900
-
2025-12-22$165,000 Active
-
2024-06-05historical $1,600
-
2024-05-17$1,600
-
2024-05-17historical $1,600
-
2024-05-07price $1,600
-
2024-04-11$1,650
-
2021-03-23soldstatus $112,000
-
2013-10-30soldstatus $60,000
-
2007-05-17soldstatus $126,000
-
2005-06-22soldstatus $37,700
-
1979-12-01soldstatus $37,400
ⓘ Source: listings_history table (triggers on properties + properties_extension) + one-shot
backfill from property_details.listing_events for pre-trigger history.
Tax reassessment forecast FL · Resets to sale price
- Current annual tax
- $2,721 · $227/mo
- Projected year-2 tax
- $2,721 · $227/mo
- Expected delta
- $0/yr ($0/mo · 0.0%)
ⓘ Screening estimate from a state-policy table — verify with the county assessor before closing.
Nearby sold comps map
Loading sold comps map…
Walkable amenities ~0.75 mi
Loading nearby amenities…
Taxation est. · year 1
- Rental income
- $19,964
- − Mortgage interest
- −$8,402
- − Property taxes
- −$2,721
- − Insurance
- −$750
- − Repairs & maintenance
- −$1,597
- − Management
- −$1,597
- − HOA
- −$3,660
- − Depreciation
- −$4,364
- Taxable loss
- −$3,127
- Est. tax savings @ 24.0%
- +$750
- After-tax cash flow
- $-48/yr
For passive investors: Depreciation is non-cash, so a rental often shows a tax loss while cash-flowing — sheltering income. Rental losses are passive: they offset passive income freely, and up to $25,000/yr can offset ordinary (W-2) income if you actively participate and your MAGI is under $100k (phasing out to $0 by $150k); unused losses carry forward. On sale, claimed depreciation is recaptured at up to 25%, and gains may owe capital-gains tax (a 1031 exchange can defer both). Figures are a year-1 estimate at your 24.0% rate — not tax advice; consult a CPA.
Schools (NCES district)
- District
- Orange
- NCES district ID
- 1201440
- Math proficiency
- 46% ▼ -9.00%
- Reading proficiency
- 51% ▼ -2.00%
- Median HH income
- $49,350
- Composite
- 41.47/100
- National rank
- #3461
- State rank
- #43 of 73 in FL
Livability — Orlando
- Score
- 86/100
- State rank
- #12
- US rank
- #360
Category grades
Schools grade is shown separately in the Schools card above.
Census & demographics
- Census place
- Orlando, FL
- County
- Orange County · 1,471,359 people
- City population
- 964,969
- Metro
- Orlando-Kissimmee-Sanford, FL
- Population (ZIP)
- 67,081
- Household income
- $56,540
- Rent vs Own
- Severe rent burden
- 4246.0
Population outlook (Orange County) Hauer SSP2
- Today (2025)
- 1,618,226 people
- By 2030
- 1,787,404 · +10.5%
- By 2040
- 2,125,621 · +31.4%
- By 2050
- 2,454,016 · +51.6%
- By 2075
- 3,173,711 · +96.1%
- By 2100
- 3,607,781 · +122.9%
Race, ethnicity, and origin ACS 2023
- Neighborhood character
- Predominantly Hispanic (68%)
- Race & ethnicity
- Hispanic / Latino 68% Two or more races 36% White 17% Black 10% Asian 2%
- Hispanic origin (detail)
- Mexican 2% Puerto Rican 38% Cuban 5% Dominican 5%
- Common ancestry
- Lithuanian 1% Romanian 1% Slovak 1%
- Foreign-born
- 27% · Canada, Jamaica, China
- Languages at home
- 36% English-only · Spanish 60% French/Haitian/Cajun 1% Arabic 1%
Political lean MEDSL · Orange
- 2024 margin
- D (+13.6) · D 56.1% · R 42.5% · Other 1.3%
- 2008→2024 swing
- -5.0pp toward R · 2008: 18.6pp · 2024: 13.6pp
- All cycles
- 2024: D+13.6 2020: D+23.1 2016: D+24.6 2012: D+18.2 2008: D+18.6
Not yet ingested
- Civics
- —
Market trends
- HPI YoY
- ▼ -95.17%
- Current HPI
- 355.5775
- Rent YoY
- ▼ -0.68%
- Metro
- Orlando-Kissimmee-Sanford, FL
- State GDP YoY
- ▲ 3.28%
- F500 in state
- 36
Industry mix (Fortune 500 HQ in FL)
| Industry | F500 HQs | Revenue |
|---|---|---|
| Industrial Technology | 2 | $29B |
|
||
| Insurance | 2 | $17B |
|
||
| Retail | 1 | $60B |
|
||
| Technology Distribution | 1 | $58B |
|
||
| Homebuilding | 1 | $35B |
|
||
| Technology Manufacturing | 1 | $35B |
|
||
Price history
+301.1% since first listed13 events — show timeline
- 2026-05-19 Price Changed $150,000 Stellar MLS as Distributed by MLS Grid
- 2026-04-13 Price Changed $159,900 Stellar MLS as Distributed by MLS Grid
- 2025-12-22 Listed $165,000 Stellar MLS as Distributed by MLS Grid
- 2024-06-05 Rental Removed $1,600 STELLARMLS
- 2024-05-17 Listed for Rent $1,600 STELLARMLS
- 2024-05-17 Rental Removed $1,600 APPFOLIO
- 2024-05-07 Price Changed $1,600 APPFOLIO
- 2024-04-11 Listed for Rent $1,650 APPFOLIO
- 2021-03-23 Sold (Public Records) $112,000 Public Records
- 2013-10-30 Sold (Public Records) $60,000 Public Records
- 2007-05-17 Sold (Public Records) $126,000 Public Records
- 2005-06-22 Sold (Public Records) $37,700 Public Records
- 1979-12-01 Sold (Public Records) $37,400 Public Records
Property tax history
+22.3%/yrLatest (2025): $2,721 · +7.4% YoY. Source: county tax records.
Cash-flow waterfall
monthlySold comps — $/sqft
last 12 mo · ≤1 miLoading sold comps…