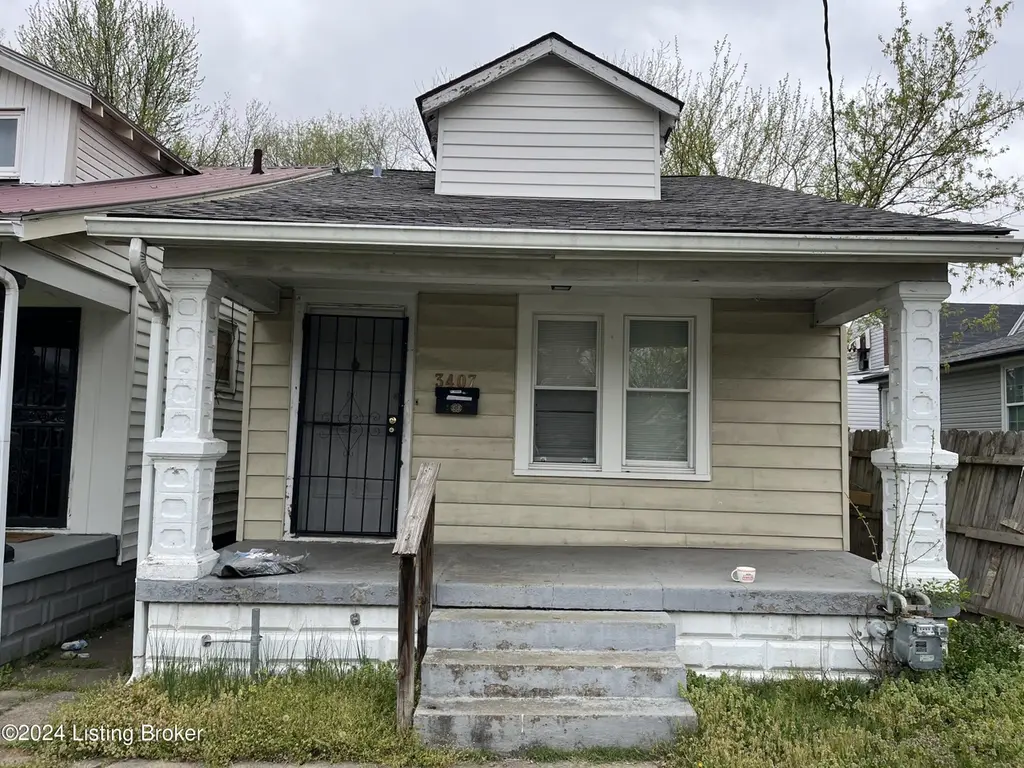
3407 Del Park Ter · Louisville, KY
Flood risk 1/10 · Minimal
- FEMA flood zone
- X (shaded)
- Chance of flooding over 30 yrs
- 0.0%
- Est. flood insurance / yr
- $473 – $860
Fire risk 1/10 · Minimal
- Est. fire insurance / yr
- $839 – $1,559
Heat risk 5/10 · Moderate
- Hot days now (above 105°F)
- 7 days/yr
- Hot days in 30 yrs
- 20 days/yr
Wind risk 2/10 · Minimal
- Chance of severe wind over 30 yrs
- 1.0%
Air-quality risk 2/10 · Minimal
- Unhealthy air days now
- 1 days/yr
- Unhealthy air days in 30 yrs
- 2 days/yr
Risk factors via First Street. Map © Google.
Why this score? — see what drove the B grade
The composite is a weighted blend of 9 inputs, each scored 0–100. Each bar is that input's sub-score; the figure is the points it added to the 100-point composite (weight × sub-score).
- Cash flow +30.0/30.0
- ARV discount +11.7/15.0
- 1% rule +10.0/10.0
- DSCR +10.0/10.0
- Rent growth +3.7/5.0
- Livability +3.2/5.0
- Condition / age +2.5/5.0
- Schools +2.3/10.0
- Appreciation +0.0/10.0
$67,550
🖨 Deal sheet 📄 Offer letter ✓ Due diligence
Listing remarks
Awesome single family home in the west end. Currently leased month for $1092/mo with a $1060 deposit. Showings must be scheduled 72 hours in advance Monday - Friday.
Key facts
- 3,441 sq ft lot
- Built 1923
- Listed 38 days
Property features AI
Finance
- HOA & community: No association fee
Exterior
- Utilities: Electricity connected
- Home design: 2 stories; Built in 1923; Shingle roof; Vinyl siding
- Construction: Vinyl siding construction; Shingle roof; Built in 1923; Unfinished below-grade area
- Exterior features: Lot approximately 0.08 acres; Traditional-style single-family residence
Interior
- Kitchen: Kitchen on the first floor
- Bedrooms: 3 bedrooms (primary bedroom on the first floor)
- Bathrooms: 1 full bathroom
- Heating & cooling: Forced air heating; Central air conditioning
- Interior features: Unfinished basement; Basement present; First-floor primary bedroom
- Laundry & utility: No first-floor laundry
Neighborhood map
What this means for you Summary
Snapshot
- This is a 3-bed/1.0-bath single-family listed at $68k.
Deal economics
- At list price, monthly cash flow is $526 ($6k/yr) — positive.
- The deal already cash-flows at list — no discount required.
- Meets the 1% rule at list price ($1k rent vs $68k).
- Recommended offer: $66k (3.0% below list) — sets the bar for market timing.
- Cap rate 15.6% vs local median 5.0% in Louisville — top-decile yield for the area; either an underpriced asset or a hidden risk that comps aren't pricing in. Stress-test before assuming the spread holds.
Location & tenants
- Location reads 63/100 on livability (#333 in KY) — a middle-class / working-renter tenant base. Strengths: cost of living A+, housing A+; Watch: employment C-, health & safety D+, schools D-.
- Jefferson County (urban): math 19% / reading 35% proficiency, ranked #121 of 165 in KY (top 73%) — low school quality limits family demand, transient renter base, plan for 1-2y turnover.
- Market conditions: Rents rising fast (+4.9%/yr); 140 active listings in the ZIP; 40 comparable units currently listed for rent nearby; rentals at typical pace (median 19d on market — plan ~3-4 weeks tenant-placement turnaround); lower-income renter base — watch delinquency; 2,836 units permitted in Jefferson County in 2024 (1,558 in 5+ unit buildings).
- At $1,222/mo this rent would consume 46% of the median local household income ($32k/yr) (locally 1483% of renters already pay >50% of income on rent) — very limited rent-growth headroom before tenants either downsize or default.
Forward outlook
- Local home prices are declining (-3.0%/yr); year-one equity from $468 of loan paydown is wiped out by about $2k of value loss. Plan a longer hold.
- Jefferson County population projected at +13% by 2050 — modest demand growth; plan on rents tracking national, not racing it.
- At projected returns (-3.0% appreciation + 4.9% rent growth), your $19k cash investment doubles in ~4 years — after that, you're playing with house money.
Negotiation context
- It's been on market 38 days — a 3% lower offer ($66k) is reasonable based on typical stale-listing flexibility.
- 8 sale attempts since 25y ago with the ask held roughly flat each time — persistent listings suggest the price (not the market) is what's stuck; bring a comps-based counter.
Risks & watch-outs
- Watch-outs: built in 1923 — expect roof / HVAC / electrical / plumbing capex.
- Climate carrying-cost: extreme-heat days projected 7→20/yr by 2055 (HVAC capex compounding) — expect insurance premiums to compound above CPI over the hold.
Questions for the listing agent
- It's been on market 38 days. Have you received any prior offers? Is the seller open to a 3% concession, seller financing, or rate buy-down credit?
- Built in 1923 — when were the roof, HVAC, electrical panel, plumbing, and water heater last replaced?
- Is there a deadline driving the sale (1031 exchange, divorce, estate, relocation)? That informs how much negotiation room exists.
- Schools are D-rated, which usually means shorter tenancies and higher turnover. Who's the typical renter profile here, and what's been the actual vacancy rate?
- Crime grade is F in this area — have there been break-ins, vandalism, or insurance claims at this property in the last 3 years? What carrier currently insures it and at what premium?
- What's the average days-on-market for RENTAL listings here right now (not sales)? A rising rental-DOM trend means longer vacancies and softer asking-rent achievability than the comps imply.
- What's the recent tenant-quality profile in this submarket — average credit score on applications, eviction rate, late-payment / NSF rate, and stable-employment percentage? A property-management company in the area should have these aggregated.
- How much new for-sale + rental construction is in the pipeline within 1–3 miles? Heavy new supply typically softens prices + rents 12–24 months out; constrained supply supports both.
Investment metrics
- 1% rule
- 1.81% ✓
- Cap rate
- 15.64%
- Cash-on-cash
- 33.37%
- DSCR
- 2.48
- GRM
- 4.6
CMA / ARV
- ARV (on-the-fly)
- $74,520
- Comps found
- 12
Show comp detail 12 sales within ~0.75 mi
| Address | Dist | Beds/Ba | Sqft | Sold | Price | $/sf | Match |
|---|---|---|---|---|---|---|---|
| 722 S 37th St | 0.40mi | 2/1.0 (-1) | 1,092 (+1%) | 4mo | $46,000 | $42 | 71 |
| 2620 W Madison St | 0.70mi | 3/1.5 | 1,080 (0%) | 1mo | $74,000 | $69 | 64 |
| 844 Louis Coleman Jr Dr | 0.51mi | 3/1.0 | 1,008 (-7%) | 3mo | $109,000 | $108 | 62 |
| 802 Sutcliffe Ave | 0.43mi | 2/1.0 (-1) | 1,162 (+8%) | 4mo | $110,000 | $95 | 59 |
| 117 N 34th St | 0.66mi | 3/1.0 | 1,130 (+5%) | 4mo | $34,000 | $30 | 58 |
| 637 S 27th St | 0.67mi | 3/1.0 | 1,110 (+3%) | 7mo | $40,000 | $36 | 58 |
| 3212 W Kentucky St | 0.65mi | 2/1.5 (-1) | 1,104 (+2%) | 2mo | $45,000 | $41 | 58 |
| 3419 Greenwood Ave | 0.70mi | 3/1.0 | 1,033 (-4%) | 3mo | $120,000 | $116 | 58 |
| 431 Amy Ave | 0.43mi | 2/1.0 (-1) | 1,223 (+13%) | 5mo | $80,000 | $65 | 49 |
| 2831 W Madison St | 0.52mi | 2/1.0 (-1) | 937 (-13%) | 1mo | $108,000 | $115 | 48 |
| 3226 W Jefferson St | 0.45mi | 2/1.0 (-1) | 920 (-15%) | 6mo | $48,000 | $52 | 44 |
| 3414 Greenwood Ave | 0.73mi | 2/1.0 (-1) | 1,213 (+12%) | 8mo | $110,000 | $91 | 34 |
Match score weights: distance 35% · size 25% · config 20% · recency 20%. Top-matched comps best support the ARV.
Projected returns pro-forma
-3.0% appreciation · 4.87% rent growth · sell at horizon
- IRR
- 30.7%
- Equity multiple
- 2.32×
- Total profit
- $24,895
- Equity at exit
- $10,072
- IRR
- 38.9%
- Equity multiple
- 4.95×
- Total profit
- $74,801
- Equity at exit
- $5,840
Cash invested: $18,914 (down + closing). Projections, not guarantees.
Landlord ↔ Tenant lean methodology
- Overall (STATE)
- 83 Strongly Landlord-Friendly
- State Kentucky
- 83 Strongly Landlord-Friendly · R+16
- County
- — inherits STATE
- City
- — inherits STATE
ZIP-level market 40211
- Home prices YoY
- -33.4%
- Rents YoY
- 4.9%
- Active inventory
- 140
- Price-to-rent
- 4.6×
Monthly cashflow live
- Estimated rent
- $1,222 high interval (Pro) →
- Mortgage (P&I)
- −$354
- Tax from tax record
- −$57 /mo · $682/yr
- Insurance
- −$28
- HOA
- −$0
- Vacancy / Maint / Mgmt
- −$257
- Net cashflow
- $526
Break-even live
UW: 25.0% down · 7.5% · 30yr · 1.5% tax · 5.0% vac · 8.0% maint · 8.0% mgmt
Financing live
Cash to close
- Down payment
- $16,888
- Closing costs
- $2,026
- Reserves months
- —
- Total cash needed
- —
Loan-product check · same deal, 3 products live
Conventional
25% down · 7.5% · 30yr
- Down + closing
- —
- Monthly P&I
- —
- Monthly cashflow
- —
- DSCR
- —
- Eligible?
- —
Personal DTI + credit; lowest rate.
DSCR
20% down · 8.5% · 30yr
- Down + closing
- —
- Monthly P&I
- —
- Monthly cashflow
- —
- DSCR
- —
- Eligible?
- —
No personal income docs; deal must DSCR.
Hard money
10% down · 12.0% · 12mo
- Down + closing
- —
- Monthly P&I
- —
- Monthly cashflow
- —
- DSCR
- —
- Eligible?
- —
Short-term bridge; refi at stabilization.
Rent comps 40 comps
| Address | Beds | Baths | Sqft | Rent | $/sqft | DOM | Units | Dist |
|---|---|---|---|---|---|---|---|---|
| 3421 River Park Dr Louisville, KY | 3.0 | 1.0 | 994 | $1,250 | $1.26 | 23d | 1 | 0.13mi |
| 666 Eastlawn Ave Louisville, KY | 2.0 | 1.0 | 936 | $895 | $0.96 | 16d | 1 | 0.19mi |
| 701 Hazel St Unit 3 Louisville, KY | 2.0 | 1.0 | 832 | $800 | $0.96 | 10d | 1 | 0.31mi |
| 652 S 37th St #9 Louisville, KY | 3.0 | 1.0 | 1070 | $1,095 | $1.02 | 23d | 1 | 0.31mi |
| 648 S 37th St #3 Louisville, KY | 2.0 | 1.0 | 807 | $850 | $1.05 | 23d | 1 | 0.31mi |
| 737 S 33rd St Louisville, KY | 4.0 | 1.0 | 1356 | $1,595 | $1.18 | 23d | 1 | 0.32mi |
| 627 S 38th St Louisville, KY | 4.0 | 1.0 | 1300 | $1,349 | $1.04 | 16d | 1 | 0.36mi |
| 803 S 35th St Louisville, KY | 3.0 | 1.0 | 1486 | $1,350 | $0.91 | 23d | 1 | 0.37mi |
| 814 S 33rd St Louisville, KY | 3.0 | 1.0 | 1104 | $1,350 | $1.22 | 3d | 1 | 0.39mi |
| 3819 River Park Dr Louisville, KY | 3.0 | 1.0 | 1108 | $1,090 | $0.98 | 20d | 1 | 0.42mi |
| 628 S 39th St Louisville, KY | 3.0 | 1.0 | 1448 | $1,220 | $0.84 | 16d | 1 | 0.46mi |
| 832 Hazel St Louisville, KY | 2.0 | 1.0 | 720 | $1,095 | $1.52 | 3d | 1 | 0.52mi |
| 729 S 39th St Unit 1 Louisville, KY | 2.0 | 1.0 | 800 | $800 | $1.00 | 23d | 1 | 0.52mi |
| 823 S 38th St Louisville, KY | 3.0 | 1.0 | 1100 | $1,195 | $1.09 | 3d | 1 | 0.55mi |
| 644 S 40th St Louisville, KY | 2.0 | 1.0 | 1200 | $1,500 | $1.25 | 2d | 1 | 0.57mi |
| 2733 Chase Ct Louisville, KY | 2.0 | 1.0 | 900 | $900 | $1.00 | 16d | 1 | 0.58mi |
| 4018 Vermont Ave Unit 1 Louisville, KY | 2.0 | 1.0 | 700 | $699 | $1.00 | 3d | 1 | 0.59mi |
| 714 S 40th St #2 Louisville, KY | 3.0 | 1.0 | 1000 | $1,250 | $1.25 | 23d | 1 | 0.61mi |
| 715 S 41st St Unit 1 Louisville, KY | 4.0 | 1.0 | 1000 | $1,295 | $1.29 | 10d | 1 | 0.65mi |
| 3122 W Kentucky St Louisville, KY | 3.0 | 1.0 | 1030 | $1,150 | $1.12 | 23d | 1 | 0.65mi |
| 2631 W Madison St Unit 2 Louisville, KY | 2.0 | 1.0 | 928 | $850 | $0.92 | 23d | 1 | 0.67mi |
| 2631 W Madison St Unit 1 Louisville, KY | 3.0 | 1.0 | 928 | $950 | $1.02 | 23d | 1 | 0.67mi |
| 2631 W Madison St Unit 2 Louisville, KY | 2.0 | 1.0 | 928 | $850 | $0.92 | 17d | 1 | 0.67mi |
| 110 Hansbrough Pl Unit 101 Louisville, KY | 2.0 | 1.0 | 924 | $1,080 | $1.17 | 23d | 1 | 0.70mi |
| 833 S 41st St Louisville, KY | 3.0 | 2.0 | 786 | $1,250 | $1.59 | 23d | 1 | 0.73mi |
| 2623 Cedar St Louisville, KY | 3.0 | 1.0 | 1000 | $1,000 | $1.00 | 23d | 1 | 0.76mi |
| 4129 W Muhammad Ali Blvd Louisville, KY | 4.0 | 2.0 | 1224 | $1,500 | $1.23 | 1d | 1 | 0.76mi |
| 803 Cecil Ave Louisville, KY | 4.0 | 1.0 | 1165 | $1,449 | $1.24 | 10d | 1 | 0.76mi |
| 836 S 41st St Louisville, KY | 3.0 | 1.0 | 1300 | $1,300 | $1.00 | 19d | 1 | 0.76mi |
| 2724 Garland Ave Unit 202 Louisville, KY | 2.0 | 1.0 | 950 | $745 | $0.78 | 3d | 1 | 0.77mi |
| 247 Cecil Ave Louisville, KY | 3.0 | 2.0 | 1083 | $1,305 | $1.20 | 19d | 1 | 0.79mi |
| 302 Cecil Ave Louisville, KY | 2.0 | 1.0 | 984 | $1,025 | $1.04 | 16d | 1 | 0.80mi |
| 2614 W Jefferson St Unit 2614-4 Louisville, KY | 2.0 | 1.0 | 740 | $795 | $1.07 | 23d | 1 | 0.80mi |
| 2912 Greenwood Ave Louisville, KY | 3.0 | 2.0 | 1362 | $1,150 | $0.84 | 16d | 1 | 0.81mi |
| 3514 Grand Ave Louisville, KY | 3.0 | 1.5 | 1450 | $1,295 | $0.89 | 21d | 1 | 0.81mi |
| 2825 Greenwood Ave #2 Louisville, KY | 2.0 | 1.0 | 1300 | $995 | $0.77 | 23d | 1 | 0.82mi |
| 2825 Greenwood Ave #4 Louisville, KY | 3.0 | 1.0 | 1440 | $1,250 | $0.87 | 23d | 1 | 0.82mi |
| 2927 Rowan St Louisville, KY | 3.0 | 1.0 | 1008 | $1,205 | $1.20 | 11d | 1 | 0.82mi |
| 714 S 42nd St Louisville, KY | 3.0 | 1.0 | 1078 | $1,150 | $1.07 | 16d | 1 | 0.82mi |
| 2821 Greenwood Ave #1 Louisville, KY | 3.0 | 1.0 | 1113 | $1,300 | $1.17 | 23d | 1 | 0.82mi |
Listing history 33 events
-
2026-06-18days on market $67,550 Active 38 DOM
-
2026-06-17days on market $67,550 Active 37 DOM
-
2026-06-16days on market $67,550 Active 36 DOM
-
2026-06-15days on market $67,550 Active 35 DOM
-
2026-06-13days on market $67,550 Active 33 DOM
-
2026-06-10days on market $67,550 Active 30 DOM
-
2026-06-09days on market $67,550 Active 29 DOM
-
2026-06-08days on market $67,550 Active 28 DOM
-
2026-06-07days on market $67,550 Active 27 DOM
-
2026-06-03days on market $67,550 Active 23 DOM
-
2026-06-02days on market $67,550 Active 22 DOM
-
2026-06-01days on market $67,550 Active 21 DOM
-
2026-05-31days on market $67,550 Active 20 DOM
-
2026-05-11$67,550 Active
-
2024-06-26historical $1,200
-
2024-06-03historical
-
2024-05-08$1,200
-
2024-04-05price $77,500
-
2024-02-23$80,000 Active
-
2023-08-20historical
-
2023-07-08historical
-
2023-05-22status Active
-
2023-05-22price $72,500
-
2023-05-15status Pending
-
2023-03-14$75,000 Active
-
2022-04-01soldstatus $451,000
-
2018-12-26soldstatus $16,500 Closed
-
2018-12-07status Pending
-
2018-11-23$1 Active
-
2003-11-03soldstatus $22,500
-
2003-07-24$24,900
-
2002-10-19historical
-
2001-12-13$64,500
ⓘ Source: listings_history table (triggers on properties + properties_extension) + one-shot
backfill from property_details.listing_events for pre-trigger history.
Tax reassessment forecast KY · Resets to sale price
- Current annual tax
- $682 · $57/mo
- Projected year-2 tax
- $682 · $57/mo
- Expected delta
- $0/yr ($0/mo · 0.0%)
ⓘ Screening estimate from a state-policy table — verify with the county assessor before closing.
Climate risk First Street
- Flood 1/10 Low FEMA zone X (shaded) · 0% chance over 30 yrs
- Wildfire 1/10 Low
- Heat 5/10 Major 7 d/yr ≥105°F today · 20 d/yr by 30 yrs out
- Wind 2/10 Low 100% chance of damaging wind over 30 yrs
- Air quality 2/10 Low 1 unhealthy d/yr today · 2 by 30 yrs out
Nearby sold comps map
Loading sold comps map…
Walkable amenities ~0.75 mi
Loading nearby amenities…
Taxation est. · year 1
- Rental income
- $14,660
- − Mortgage interest
- −$3,784
- − Property taxes
- −$682
- − Insurance
- −$338
- − Repairs & maintenance
- −$1,173
- − Management
- −$1,173
- − Depreciation
- −$1,965
- Taxable income
- $5,546
- Est. tax owed @ 24.0%
- −$1,331
- After-tax cash flow
- $4,980/yr
For passive investors: Depreciation is non-cash, so a rental often shows a tax loss while cash-flowing — sheltering income. Rental losses are passive: they offset passive income freely, and up to $25,000/yr can offset ordinary (W-2) income if you actively participate and your MAGI is under $100k (phasing out to $0 by $150k); unused losses carry forward. On sale, claimed depreciation is recaptured at up to 25%, and gains may owe capital-gains tax (a 1031 exchange can defer both). Figures are a year-1 estimate at your 24.0% rate — not tax advice; consult a CPA.
Schools (NCES district)
- District
- Jefferson County
- NCES district ID
- 2102990
- Math proficiency
- 19% ▼ -17.00%
- Reading proficiency
- 35% ▼ -11.00%
- Median HH income
- $47,885
- Composite
- 23.45/100
- National rank
- #7884
- State rank
- #121 of 165 in KY
Livability — Louisville
- Score
- 63/100
- State rank
- #333
- US rank
- #15887
Category grades
Schools grade is shown separately in the Schools card above.
Census & demographics
- Census place
- Louisville, KY
- County
- Jefferson County · 790,184 people
- City population
- 769,292
- Metro
- Louisville/Jefferson County, KY-IN
- Population (ZIP)
- 20,407
- Household income
- $31,749
- Rent vs Own
- Severe rent burden
- 1483.0
Population outlook (Jefferson County) Hauer SSP2
- Today (2025)
- 823,112 people
- By 2030
- 849,343 · +3.2%
- By 2040
- 895,696 · +8.8%
- By 2050
- 933,630 · +13.4%
- By 2075
- 1,028,262 · +24.9%
- By 2100
- 1,072,675 · +30.3%
Race, ethnicity, and origin ACS 2023
- Neighborhood character
- Predominantly Black (90%)
- Race & ethnicity
- Black 90% White 5% Two or more races 4% Hispanic / Latino 1%
- Common ancestry
- Italian 1%
- Foreign-born
- 1% · Canada
- Languages at home
- 98% English-only · Spanish 1%
Political lean MEDSL · Jefferson
- 2024 margin
- D (+16.6) · D 57.4% · R 40.9% · Other 1.7%
- 2008→2024 swing
- +4.5pp toward D · 2008: 12.0pp · 2024: 16.6pp
- All cycles
- 2024: D+16.6 2020: D+20.1 2016: D+13.3 2012: D+11.1 2008: D+12.0
Not yet ingested
- Civics
- —
Market trends
- HPI YoY
- ▼ -88.22%
- Current HPI
- 176.337
- Rent YoY
- ▲ 4.87%
- Metro
- Louisville/Jefferson County, KY-IN
- State GDP YoY
- ▲ 1.81%
- F500 in state
- 4
Industry mix (Fortune 500 HQ in KY)
| Industry | F500 HQs | Revenue |
|---|---|---|
| Healthcare | 1 | $118B |
|
||
| Food / Beverage | 1 | $7B |
|
||
Price history
+4.7% since first listed20 events — show timeline
- 2026-05-11 Listed $67,550 Metro Search MLS
- 2024-06-26 Rental Removed $1,200 Avail
- 2024-06-03 Listing Removed — Metro Search MLS
- 2024-05-08 Listed for Rent $1,200 Avail
- 2024-04-05 Price Changed $77,500 Metro Search MLS
- 2024-02-23 Listed $80,000 Metro Search MLS
- 2023-08-20 Rental Removed — RENTLY
- 2023-07-08 Listing Removed — Metro Search MLS
- 2023-05-22 Relisted — Metro Search MLS
- 2023-05-22 Price Changed $72,500 Metro Search MLS
- 2023-05-15 Pending — Metro Search MLS
- 2023-03-14 Listed $75,000 Metro Search MLS
- 2022-04-01 Sold (Public Records) $451,000 Public Records
- 2018-12-26 Sold (MLS) $16,500 Metro Search MLS
- 2018-12-07 Pending — Metro Search MLS
- 2018-11-23 Listed $1 Metro Search MLS
- 2003-11-03 Sold (Public Records) $22,500 Public Records
- 2003-07-24 Listed $24,900 Metro Search MLS
- 2002-10-19 Listing Removed — Metro Search MLS
- 2001-12-13 Listed $64,500 Metro Search MLS
Property tax history
+3.6%/yrLatest (2025): $682 · -1.9% YoY. Source: county tax records.
Cash-flow waterfall
monthlySold comps — $/sqft
last 12 mo · ≤1 miLoading sold comps…