 14-Plex
1002 N J St · Tacoma, WA
Flood risk 1/10 · Minimal
- FEMA flood zone
- X (unshaded)
- Chance of flooding over 30 yrs
- 0.0%
- Est. flood insurance / yr
- $507 – $1,088
Fire risk 1/10 · Minimal
- Est. fire insurance / yr
- $604 – $1,122
Heat risk 3/10 · Minor
- Hot days now (above 87°F)
- 7 days/yr
- Hot days in 30 yrs
- 14 days/yr
Wind risk 1/10 · Minimal
- Chance of severe wind over 30 yrs
- —
Air-quality risk 6/10 · Moderate
- Unhealthy air days now
- 9 days/yr
- Unhealthy air days in 30 yrs
- 9 days/yr
Risk factors via First Street. Map © Google.
Why this score? — see what drove the F grade
The composite is a weighted blend of 9 inputs, each scored 0–100. Each bar is that input's sub-score; the figure is the points it added to the 100-point composite (weight × sub-score).
- Cash flow +8.2/30.0
- ARV discount +7.5/15.0
- Schools +4.2/10.0
- Livability +3.9/5.0
- Rent growth +3.0/5.0
- Condition / age +2.5/5.0
- DSCR +2.2/10.0
- 1% rule +1.9/10.0
- Appreciation +0.0/10.0
$3,250,000
🖨 Deal sheet (PDF) 📄 Offer letter ✓ Due diligence
Multi-family units
County records classify this as Multi-Family (5+ Unit). Listing-text estimate: 14 units. confirmed
5+ unit building — per-unit beds/baths from public records are typically unavailable; the breakdown below (if shown) is an estimate from the listing text.
Listing remarks
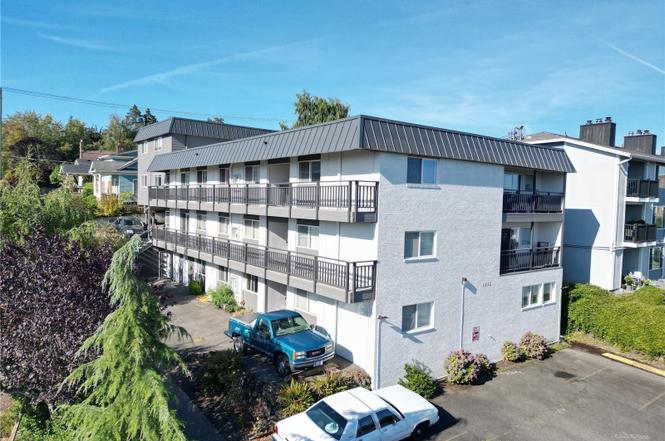
Marguerite Apartments is a meticulously well-maintained 14-unit apartment investment opportunity located in an "A" North Tacoma location. Nine of the fourteen apartments have been renovated to include; stainless steel refrigerators, sinks, oven/range and dishwashers, new lighting fixtures, new luxury vinyl plank flooring in living room, dining room, and kitchen, granite kitchen and bathroom countertops, tile flooring in the bathrooms. The property features a desirable unit mix consisting of 7 one-bedroom units averaging 477 square feet, 6 two-bedroom units averaging 920 square feet, and a top-floor, penthouse suite with ocean views spanning 1,200 square feet, also equipped with a
Key facts
- 8,580 sq ft lot
- 13 parking spots
- Built 1967
Tags
Property features AI
Finance
- Other: Vacancy rate listed at 5%
- Financial info: 14 total units; Gross scheduled income approximately $227,400; Gross adjusted income approximately $216,030; Total monthly income listed as $20,375; Net operating income approximately $133,451; Total expenses approximately $99,681; Insurance expense approximately $9,031; Other expenses approximately $36,768; Gross rent multiplier 14.29; Typical listing terms: Conventional
Exterior
- Parking: Open/uncovered parking with 9 spaces; 4 carport spaces
- Utilities: Electric energy source; Sewer connected; Water/sewer/garbage service indicated
- Home design: Residential income property; Multi-family building; 3 stories
- Construction: Brick construction; Torch down roof
- Exterior features: Brick exterior; Property has a view
Interior
- Kitchen: Unit kitchens (appliances not specified)
- Bedrooms: Mix of 1- and 2-bedroom units across the property (units include 1-bed and 2-bed layouts)
- Flooring: Vinyl plank
- Bathrooms: Units with 1 bathroom and some 2-bedroom units with 1.5 baths
- Heating & cooling: Baseboard heating; No central cooling
- Interior features: Vinyl plank flooring; Updated/remodeled condition; Coin-operated laundry on site
- Laundry & utility: Coin-operated laundry
Neighborhood map
What this means for you Summary
Snapshot
- This is a 7×1bd/1.5ba + 6×2bd/1.5ba + 1×3bd/2.0ba units multifamily listed at $3.25M.
Deal economics
- At list price, monthly cash flow is $-3k ($-37k/yr) — negative. Per door: $-218/mo.
- To cash-flow at today's rent, offer at most $2.71M (16.6% below list).
- To meet the 1% rule (rent ≥ 1% of price), the offer needs to be $2.26M (30.5% below list).
- Recommended offer: $2.26M (30.5% below list) — sets the bar for 1% rule.
- Cap rate 5.2% vs local median 2.9% in Tacoma — top-decile yield for the area; either an underpriced asset or a hidden risk that comps aren't pricing in. Stress-test before assuming the spread holds.
Location & tenants
- Location reads 78/100 on livability (#127 in WA, #2,535 nationally) — a middle-class / working-renter tenant base. Strengths: amenities A+, commute A+, housing A+; Watch: cost of living D, crime F.
- Tacoma School District (urban): math 40% / reading 53% proficiency, ranked #169 of 291 in WA (top 58%) — families likely to look elsewhere, expect single-tenant / working-renter base with shorter leases.
- Zoned schools: Lowell Elementary School (319 students, 25% FRL); Hilltop Heritage Middle School (524 students, 60% FRL); Stadium High School (1,571 students, 36% FRL).
- Market conditions: Rents rising (+1.9%/yr); 41 active listings in the ZIP; solid renter incomes; 3,209 units permitted in Pierce County in 2024 (1,269 in 5+ unit buildings).
- At $22,573/mo this rent would consume 308% of the median local household income ($88k/yr) (locally 328% of renters already pay >50% of income on rent) — very limited rent-growth headroom before tenants either downsize or default.
Forward outlook
- Local home prices are declining (-3.0%/yr); year-one equity from $22k of loan paydown is wiped out by about $98k of value loss. Plan a longer hold.
- Pierce County population projected at +26% by 2050 — long-run rental-demand tailwind backs the buy-and-hold thesis.
Negotiation context
- It's been on market 299 days — a 12% lower offer ($2.86M) is reasonable based on typical stale-listing flexibility.
- 2 sale attempts since 19y ago with the ask held roughly flat each time — persistent listings suggest the price (not the market) is what's stuck; bring a comps-based counter.
- Current owner paid $1.90M; list at $3.25M implies a 71% gain — meaningful room to come down on a strong offer.
Questions for the listing agent
- What do current leases actually rent for vs. the listed asking? Can we see a recent rent roll and the last 12 months of T-12 income?
- It's been on market 299 days. Have you received any prior offers? Is the seller open to a 31% concession, seller financing, or rate buy-down credit?
- Can we see the unit-by-unit rent roll, current vacancy, and any below-market leases? What's the average tenancy length?
- What capital expenditures (roof, boiler, parking lot, exteriors) have been made in the last 5 years, and what's planned in the next 2?
- Built in 1967 — when were the roof, HVAC, electrical panel, plumbing, and water heater last replaced?
- Why hasn't it sold? Are there any deal-killer items the seller is aware of (foundation, flood, title, zoning, code violations)?
- Is there a deadline driving the sale (1031 exchange, divorce, estate, relocation)? That informs how much negotiation room exists.
- Schools are B-rated — typically a magnet for longer-tenancy family renters. What's the average tenant stay here, and is there a school-zone premium baked into asking?
- Crime grade is F in this area — have there been break-ins, vandalism, or insurance claims at this property in the last 3 years? What carrier currently insures it and at what premium?
- The area grade is low — what's the realistic commute time and amenity access for the typical tenant pool here? Any planned neighborhood developments (good or bad) we should know about?
- What's the average days-on-market for RENTAL listings here right now (not sales)? A rising rental-DOM trend means longer vacancies and softer asking-rent achievability than the comps imply.
- What's the recent tenant-quality profile in this submarket — average credit score on applications, eviction rate, late-payment / NSF rate, and stable-employment percentage? A property-management company in the area should have these aggregated.
- How much new apartment / multifamily construction is in the pipeline within 1–3 miles? Heavy new supply (>2% of stock underway) typically softens rents 12–24 months out; light construction supports rent growth.
Investment metrics
- 1% rule
- 0.69% ✗
- Cap rate
- 5.16%
- Cash-on-cash
- -4.03%
- DSCR
- 0.82
- GRM
- 12.0
CMA / ARV
No comps found within radius.
Projected returns pro-forma
-3.0% appreciation · 1.87% rent growth · sell at horizon
- IRR
- -24.3%
- Equity multiple
- 0.18×
- Total profit
- $-747,266
- Equity at exit
- $484,586
- IRR
- -22.9%
- Equity multiple
- -0.11×
- Total profit
- $-1,005,653
- Equity at exit
- $281,001
Cash invested: $910,000 (down + closing). Projections, not guarantees.
Landlord ↔ Tenant lean methodology
- Overall (STATE)
- 28 Tenant-Leaning
- State Washington
- 28 Tenant-Leaning · D+8
- County
- — inherits STATE
- City
- — inherits STATE
ZIP-level market 98403
- Rents YoY
- 1.9%
- Active inventory
- 41
- Price-to-rent
- 174.4×
Monthly cashflow live
- Estimated rent
- $22,573 high interval (Pro) →
- Mortgage (P&I)
- −$17,043
- Tax from tax record
- −$2,491 /mo · $29,890/yr
- Insurance
- −$1,354
- HOA
- −$0
- Vacancy / Maint / Mgmt
- −$4,740
- Net cashflow
- $-3,056
Break-even live
Sensitivity live
| Price | -10% $-1,216 | -5% $-2,136 | +0% $-3,056 | +5% $-3,976 | +10% $-4,895 |
|---|---|---|---|---|---|
| Rent | -10% $-4,839 | -5% $-3,947 | +0% $-3,056 | +5% $-2,164 | +10% $-1,272 |
| Rate | -1.0pp $-1,419 | -0.5pp $-2,229 | base $-3,056 | +0.5pp $-3,898 | +1.0pp $-4,755 |
14-unit breakdown (identical units grouped — click to expand)
| Units | Beds | Baths | Est. rent |
|---|---|---|---|
| 7× units | 1 | 1.5 | $10,871 |
| #1 | 1 | 1.5 | $1,553 |
| #2 | 1 | 1.5 | $1,553 |
| #3 | 1 | 1.5 | $1,553 |
| #4 | 1 | 1.5 | $1,553 |
| #5 | 1 | 1.5 | $1,553 |
| #6 | 1 | 1.5 | $1,553 |
| #7 | 1 | 1.5 | $1,553 |
| 6× units | 2 | 1.5 | $9,786 |
| #8 | 2 | 1.5 | $1,631 |
| #9 | 2 | 1.5 | $1,631 |
| #10 | 2 | 1.5 | $1,631 |
| #11 | 2 | 1.5 | $1,631 |
| #12 | 2 | 1.5 | $1,631 |
| #13 | 2 | 1.5 | $1,631 |
| 1× unit | 3 | 2 | $1,916 |
| Total (14 units) | $22,573 | ||
UW: 25.0% down · 7.5% · 30yr · 1.5% tax · 5.0% vac · 8.0% maint · 8.0% mgmt
Financing live
Cash to close
- Down payment
- $812,500
- Closing costs
- $97,500
- Reserves months
- —
- Total cash needed
- —
Loan-product check · same deal, 3 products live
Conventional
25% down · 7.5% · 30yr
- Down + closing
- —
- Monthly P&I
- —
- Monthly cashflow
- —
- DSCR
- —
- Eligible?
- —
Personal DTI + credit; lowest rate.
DSCR
20% down · 8.5% · 30yr
- Down + closing
- —
- Monthly P&I
- —
- Monthly cashflow
- —
- DSCR
- —
- Eligible?
- —
No personal income docs; deal must DSCR.
Hard money
10% down · 12.0% · 12mo
- Down + closing
- —
- Monthly P&I
- —
- Monthly cashflow
- —
- DSCR
- —
- Eligible?
- —
Short-term bridge; refi at stabilization.
Listing history 21 events
-
2026-06-21days on market $3,250,000 Active 299 DOM
-
2026-06-18days on market $3,250,000 Active 296 DOM
-
2026-06-17days on market $3,250,000 Active 295 DOM
-
2026-06-16days on market $3,250,000 Active 294 DOM
-
2026-06-15days on market $3,250,000 Active 293 DOM
-
2026-06-13days on market $3,250,000 Active 291 DOM
-
2026-06-13days on market $3,250,000 Active 290 DOM
-
2026-06-09days on market $3,250,000 Active 287 DOM
-
2026-06-08days on market $3,250,000 Active 286 DOM
-
2026-06-07days on market $3,250,000 Active 285 DOM
-
2026-06-04days on market $3,250,000 Active 282 DOM
-
2026-06-03days on market $3,250,000 Active 281 DOM
-
2026-06-02days on market $3,250,000 Active 280 DOM
-
2026-06-01days on market $3,250,000 Active 279 DOM
-
2026-05-31days on market $3,250,000 Active 278 DOM
-
2025-08-26$3,250,000 Active
-
2019-05-01soldstatus $1,900,000
-
2007-10-17soldstatus $1,111,520
-
2007-10-17soldstatus $1,115,000
-
2007-09-19historical
-
2007-04-13$1,200,000
ⓘ Source: listings_history table (triggers on properties + properties_extension) + one-shot
backfill from property_details.listing_events for pre-trigger history.
Tax reassessment forecast WA · Resets to sale price
- Current annual tax
- $29,890 · $2,491/mo
- Projected year-2 tax
- $31,850 · $2,654/mo
- Expected delta
- +$1,960/yr (+$163/mo · 6.6%)
ⓘ Screening estimate from a state-policy table — verify with the county assessor before closing.
Climate risk First Street
- Flood 1/10 Low FEMA zone X (unshaded) · 0% chance over 30 yrs
- Wildfire 1/10 Low
- Heat 3/10 Moderate 7 d/yr ≥87°F today · 14 d/yr by 30 yrs out
- Wind 1/10 Low
- Air quality 6/10 Major 9 unhealthy d/yr today · 9 by 30 yrs out
Nearby sold comps map
Loading sold comps map…
Walkable amenities ~0.75 mi
Loading nearby amenities…
Taxation est. · year 1
- Rental income
- $270,876
- − Mortgage interest
- −$182,051
- − Property taxes
- −$29,890
- − Insurance
- −$16,250
- − Repairs & maintenance
- −$21,670
- − Management
- −$21,670
- − Depreciation
- −$94,545
- Taxable loss
- −$95,201
- Est. tax savings @ 24.0%
- +$22,848
- After-tax cash flow
- $-13,820/yr
For passive investors: Depreciation is non-cash, so a rental often shows a tax loss while cash-flowing — sheltering income. Rental losses are passive: they offset passive income freely, and up to $25,000/yr can offset ordinary (W-2) income if you actively participate and your MAGI is under $100k (phasing out to $0 by $150k); unused losses carry forward. On sale, claimed depreciation is recaptured at up to 25%, and gains may owe capital-gains tax (a 1031 exchange can defer both). Figures are a year-1 estimate at your 24.0% rate — not tax advice; consult a CPA.
Schools (NCES district)
- District
- Tacoma School District
- NCES district ID
- 5308700
- Math proficiency
- 40% ▬ 0.00%
- Reading proficiency
- 53% ▲ 1.00%
- Median HH income
- $52,467
- Composite
- 42.25/100
- National rank
- #6987
- State rank
- #169 of 291 in WA
Livability — Tacoma
- Score
- 78/100
- State rank
- #127
- US rank
- #2535
Category grades
Schools grade is shown separately in the Schools card above.
Census & demographics
- Census place
- Tacoma, WA
- County
- Pierce County · 788,257 people
- City population
- 212,935
- Metro
- Seattle-Tacoma-Bellevue, WA
- Population (ZIP)
- 9,097
- Household income
- $88,056
- Rent vs Own
- Severe rent burden
- 328.0
Population outlook (Pierce County) Hauer SSP2
- Today (2025)
- 956,648 people
- By 2030
- 1,010,862 · +5.7%
- By 2040
- 1,113,170 · +16.4%
- By 2050
- 1,206,524 · +26.1%
- By 2075
- 1,436,425 · +50.2%
- By 2100
- 1,563,654 · +63.5%
Race, ethnicity, and origin ACS 2023
- Neighborhood character
- Predominantly White (74%)
- Race & ethnicity
- White 74% Two or more races 12% Hispanic / Latino 7% Asian 4% Black 4% Native American 2%
- Hispanic origin (detail)
- Mexican 4%
- Common ancestry
- Portuguese 6% Italian 3% Slovak 3%
- Foreign-born
- 5% · Canada, Vietnam, China
- Languages at home
- 94% English-only · Spanish 2% Tagalog/Filipino 1% Russian/Polish/Slavic 1%
Political lean MEDSL · Pierce
- 2024 margin
- D (+10.8) · D 53.9% · R 43.1% · Other 3.0%
- 2008→2024 swing
- -1.4pp toward R · 2008: 12.2pp · 2024: 10.8pp
- All cycles
- 2024: D+10.8 2020: D+11.2 2016: D+7.5 2012: D+11.0 2008: D+12.2
Not yet ingested
- Civics
- —
Market trends
- HPI YoY
- ▼ -544.66%
- Current HPI
- 291.232
- Rent YoY
- ▲ 1.87%
- Metro
- Seattle-Tacoma-Bellevue, WA
- State GDP YoY
- ▲ 4.65%
- F500 in state
- 22
Industry mix (Fortune 500 HQ in WA)
| Industry | F500 HQs | Revenue |
|---|---|---|
| Retail | 2 | $269B |
|
||
| Technology / Retail | 1 | $638B |
|
||
| Technology | 1 | $245B |
|
||
| Telecommunications | 1 | $38B |
|
||
| Food / Beverage | 1 | $36B |
|
||
| Automotive / Trucks | 1 | $34B |
|
||
Price history
+170.8% since first listed6 events — show timeline
- 2025-08-26 Listed $3,250,000 NWMLS as Distributed by MLS Grid
- 2019-05-01 Sold (Public Records) $1,900,000 Public Records
- 2007-10-17 Sold (Public Records) $1,115,000 Public Records
- 2007-10-17 Sold (MLS) $1,111,520 NWMLS as Distributed by MLS Grid
- 2007-09-19 Delisted — NWMLS as Distributed by MLS Grid
- 2007-04-13 Listed $1,200,000 NWMLS as Distributed by MLS Grid
Property tax history
+4.6%/yrLatest (2026): $29,890 · -4.9% YoY. Source: county tax records.
Cash-flow waterfall
monthlySold comps — $/sqft
last 12 mo · ≤1 miLoading sold comps…