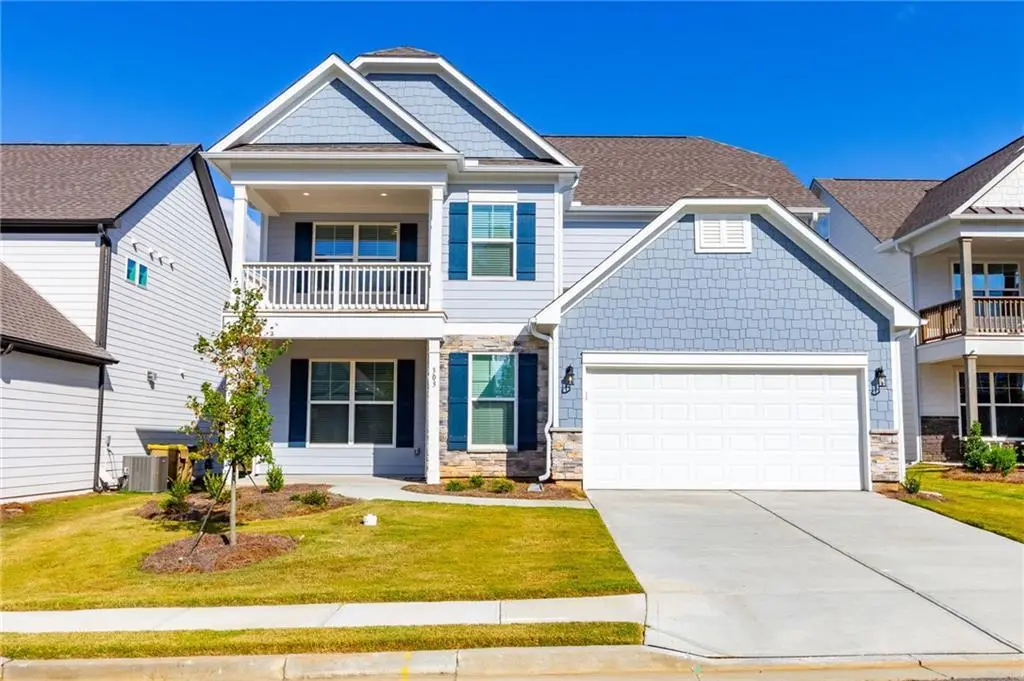
303 Bull Shoals Way · Hoschton, GA
Flood risk 1/10 · Minimal
- FEMA flood zone
- X (unshaded)
- Chance of flooding over 30 yrs
- 0.0%
- Est. flood insurance / yr
- $507 – $1,088
Fire risk 3/10 · Minor
- Est. fire insurance / yr
- $963 – $1,789
Heat risk 5/10 · Moderate
- Hot days now (above 105°F)
- 6 days/yr
- Hot days in 30 yrs
- 15 days/yr
Wind risk 4/10 · Minor
- Chance of severe wind over 30 yrs
- 12.0%
Air-quality risk 3/10 · Minor
- Unhealthy air days now
- 3 days/yr
- Unhealthy air days in 30 yrs
- 5 days/yr
Risk factors via First Street. Map © Google.
Why this score? — see what drove the F grade
The composite is a weighted blend of 9 inputs, each scored 0–100. Each bar is that input's sub-score; the figure is the points it added to the 100-point composite (weight × sub-score).
- ARV discount +6.7/15.0
- Cash flow +6.3/30.0
- Livability +3.6/5.0
- Schools +3.3/10.0
- Condition / age +2.5/5.0
- Rent growth +1.9/5.0
- 1% rule +0.7/10.0
- DSCR +0.6/10.0
- Appreciation +0.0/10.0
$549,900
🖨 Deal sheet (PDF) 📄 Offer letter ✓ Due diligence
Listing remarks
This stunning 5-bedroom, 4-bath home in sought-after Twin Lakes offers the perfect blend of luxury, space, and convenience. The open-concept floor plan features a beautiful kitchen with quartz countertops, stainless steel appliances, a large island, and seamless flow into the spacious family room with a stone fireplace. A main-level bedroom and full bath provide flexibility for guests or a home office. Upstairs, enjoy a versatile loft, spacious secondary bedrooms, and a luxurious owner's suite with a spa-like bath and dual walk-in closets. The private third-floor suite with a full bath is perfect for guests, a media room, or bonus living space. Complete with a level backyard and access to T
Key facts
- 8,276 sq ft lot
- 2 garage spots
- Community pool
Property features AI
Finance
- Other: Road surface is asphalt; Directions: please use GPS; Located in Jackson County, GA
- HOA & community: Annual association fee of $840; Association maintains grounds; Community amenities include clubhouse, pool, playground, fishing, lake, pickleball, and nearby shopping
Exterior
- Parking: Attached garage (2 garage spaces); Driveway with level approach; Garage faces front; Kitchen-level access to garage; Open parking available
- Utilities: Public water; Public sewer; Electricity available; Natural gas available; Cable available; Underground utilities
- Home design: Three or more levels; HardiPlank-type siding; Composition roof; Slab foundation
- Construction: Built with HardiPlank-type exterior; Composition shingle roof; Slab foundation
- Exterior features: Front porch; Resale condition; Lot located in Twin Lakes Phase 3C
Interior
- Kitchen: Breakfast bar; Breakfast room / eat-in kitchen; Open view to family room; Dishwasher; Gas cooktop; Gas oven; Gas range
- Bedrooms: One main-level bedroom; Four upper-level bedrooms; Oversized master with sitting room
- Flooring: Hardwood
- Bathrooms: Four full bathrooms; Main-level half/partial bath not listed (see full baths total); Master bath with double vanity and separate his-and-hers features
- Heating & cooling: Central heating (natural gas); Central air; Ceiling fans
- Interior features: Crown molding; Double vanity; His and hers closets; Walk-in closets; Gas log fireplace in the living room; No common walls
- Laundry & utility: Laundry room; Common area laundry access
Neighborhood map
What this means for you Summary
Snapshot
- This is a 5-bed/4.0-bath single-family listed at $550k.
Deal economics
- At list price, monthly cash flow is $-977 ($-12k/yr) — negative.
- To cash-flow at today's rent, offer at most $377k (31.4% below list).
- To meet the 1% rule (rent ≥ 1% of price), the offer needs to be $312k (43.3% below list).
- Recommended offer: $312k (43.3% below list) — sets the bar for 1% rule.
- Cap rate 4.2% vs local median 2.9% in Hoschton — top-decile yield for the area; either an underpriced asset or a hidden risk that comps aren't pricing in. Stress-test before assuming the spread holds.
Location & tenants
- Location reads 72/100 on livability (#71 in GA) — a middle-class / working-renter tenant base. Strengths: crime A+, employment A+, housing A+; Watch: amenities F, commute F, health & safety D-.
- Jackson County (rural): math 38% / reading 37% proficiency, ranked #50 of 174 in GA (top 29%) — families likely to look elsewhere, expect single-tenant / working-renter base with shorter leases.
- Zoned schools: West Jackson Elementary School (math 46% / reading 41%, grade F, #364 of 1,228 statewide, top 30%, 1,184 students, 30% FRL); West Jackson Middle School (math 39% / reading 43%, grade F, #135 of 470 statewide, top 29%, 1,502 students, 28% FRL); Jackson County High School (math 20% / reading 17%, grade F, #254 of 424 statewide, top 61%, 1,833 students, 26% FRL) — zoned schools average 28% FRL vs 44% district-wide (15 pts lower); this property's tenant base skews higher-income than the district average.
- Market conditions: Rents soft (-2.4%/yr); 756 active listings in the ZIP; 3 comparable units currently listed for rent nearby; rentals leasing fast (median 7d on market — plan ~1-2 weeks tenant-placement turnaround); high-income renter base; 2,167 units permitted in Jackson County in 2024 (59 in 5+ unit buildings).
- This rent runs 34% of the median local income ($111k/yr) — at the standard rent-burdened threshold; future hikes will face affordability resistance.
Forward outlook
- Local home prices are declining (-3.0%/yr); year-one equity from $4k of loan paydown is wiped out by about $16k of value loss. Plan a longer hold.
- Jackson County population projected at +14% by 2050 — modest demand growth; plan on rents tracking national, not racing it.
Negotiation context
- Only 9 days on market — expect competitive offers; lowballing is unlikely to land.
- 8 sale attempts with the ask held roughly flat each time — persistent listings suggest the price (not the market) is what's stuck; bring a comps-based counter.
Risks & watch-outs
- Climate carrying-cost: extreme-heat days projected 6→15/yr by 2055 (HVAC capex compounding) — expect insurance premiums to compound above CPI over the hold.
Questions for the listing agent
- What do current leases actually rent for vs. the listed asking? Can we see a recent rent roll and the last 12 months of T-12 income?
- What does the HOA fee cover, when was the last increase, and are there any pending special assessments or reserve-fund shortfalls?
- Is there a deadline driving the sale (1031 exchange, divorce, estate, relocation)? That informs how much negotiation room exists.
- The area grade is low — what's the realistic commute time and amenity access for the typical tenant pool here? Any planned neighborhood developments (good or bad) we should know about?
- What's the average days-on-market for RENTAL listings here right now (not sales)? A rising rental-DOM trend means longer vacancies and softer asking-rent achievability than the comps imply.
- What's the recent tenant-quality profile in this submarket — average credit score on applications, eviction rate, late-payment / NSF rate, and stable-employment percentage? A property-management company in the area should have these aggregated.
- How much new for-sale + rental construction is in the pipeline within 1–3 miles? Heavy new supply typically softens prices + rents 12–24 months out; constrained supply supports both.
Investment metrics
- 1% rule
- 0.57% ✗
- Cap rate
- 4.16%
- Cash-on-cash
- -7.61%
- DSCR
- 0.66
- GRM
- 14.7
CMA / ARV
- ARV (median comp)
- $540,798
- List price
- $549,900
- Delta
- 1.68%
- Verdict
- FAIR
- Comps
- 20 within 1.0 mi
Show comp detail 12 sales within ~0.75 mi
| Address | Dist | Beds/Ba | Sqft | Sold | Price | $/sf | Match |
|---|---|---|---|---|---|---|---|
| 142 Candlewood Ln | 0.16mi | 5/4.0 | 3,326 (+11%) | 2mo | $549,900 | $165 | 73 |
| 502 Great Salt Ln | 0.47mi | 5/3.5 | 2,721 (-9%) | 0mo | $434,685 | $160 | 60 |
| 172 Candlewood Ln | 0.13mi | 4/3.0 (-1) | 2,568 (-14%) | 2mo | $529,900 | $206 | 60 |
| 533 Great Salt Ln | 0.51mi | 5/3.5 | 2,721 (-9%) | 0mo | $429,685 | $158 | 59 |
| 234 Storm Ln | 0.50mi | 5/3.5 | 2,721 (-9%) | 1mo | $425,000 | $156 | 59 |
| 254 Storm Ln | 0.53mi | 5/3.5 | 2,721 (-9%) | 2mo | $437,690 | $161 | 56 |
| 296 Canyon Ferry Way | 0.60mi | 5/3.5 | 2,721 (-9%) | 1mo | $410,000 | $151 | 54 |
| 847 Crystal Lake Pkwy | 0.67mi | 5/3.0 | 2,793 (-7%) | 2mo | $422,990 | $151 | 52 |
| 332 Clear Lake Pkwy | 0.48mi | 4/3.0 (-1) | 2,707 (-10%) | 1mo | $787,258 | $291 | 51 |
| 795 Crystal Lake Pkwy | 0.62mi | 4/2.5 (-1) | 3,146 (+5%) | 1mo | $412,990 | $131 | 51 |
| 857 Crystal Lake Pkwy | 0.68mi | 4/2.5 (-1) | 3,141 (+5%) | 1mo | $431,990 | $138 | 49 |
| 737 Crystal Lake Pkwy | 0.57mi | 5/3.5 | 3,419 (+14%) | 2mo | $549,990 | $161 | 46 |
Match score weights: distance 35% · size 25% · config 20% · recency 20%. Top-matched comps best support the ARV.
Projected returns pro-forma
-3.0% appreciation · 0.0% rent growth · sell at horizon
- IRR
- -32.6%
- Equity multiple
- -0.04×
- Total profit
- $-160,643
- Equity at exit
- $81,992
- IRR
- -57.1%
- Equity multiple
- -0.66×
- Total profit
- $-256,032
- Equity at exit
- $47,545
Cash invested: $153,972 (down + closing). Projections, not guarantees.
Landlord ↔ Tenant lean methodology
- Overall (STATE)
- 90 Strongly Landlord-Friendly
- State Georgia
- 90 Strongly Landlord-Friendly · R+3
- County
- — inherits STATE
- City
- — inherits STATE
ZIP-level market 30548
- Home prices YoY
- -23.7%
- Rents YoY
- -2.4%
- Active inventory
- 756
- Price-to-rent
- 14.7×
Monthly cashflow live
- Estimated rent
- $3,118 medium interval (Pro) →
- Mortgage (P&I)
- −$2,884
- Tax from tax record
- −$258 /mo · $3,092/yr
- Insurance
- −$229
- HOA
- −$70
- Vacancy / Maint / Mgmt
- −$655
- Net cashflow
- $-977
Break-even live
Sensitivity live
| Price | -10% $-666 | -5% $-821 | +0% $-977 | +5% $-1,133 | +10% $-1,288 |
|---|---|---|---|---|---|
| Rent | -10% $-1,223 | -5% $-1,100 | +0% $-977 | +5% $-854 | +10% $-731 |
| Rate | -1.0pp $-700 | -0.5pp $-837 | base $-977 | +0.5pp $-1,119 | +1.0pp $-1,264 |
UW: 25.0% down · 7.5% · 30yr · 1.5% tax · 5.0% vac · 8.0% maint · 8.0% mgmt
Financing live
Cash to close
- Down payment
- $137,475
- Closing costs
- $16,497
- Reserves months
- —
- Total cash needed
- —
Loan-product check · same deal, 3 products live
Conventional
25% down · 7.5% · 30yr
- Down + closing
- —
- Monthly P&I
- —
- Monthly cashflow
- —
- DSCR
- —
- Eligible?
- —
Personal DTI + credit; lowest rate.
DSCR
20% down · 8.5% · 30yr
- Down + closing
- —
- Monthly P&I
- —
- Monthly cashflow
- —
- DSCR
- —
- Eligible?
- —
No personal income docs; deal must DSCR.
Hard money
10% down · 12.0% · 12mo
- Down + closing
- —
- Monthly P&I
- —
- Monthly cashflow
- —
- DSCR
- —
- Eligible?
- —
Short-term bridge; refi at stabilization.
Rent comps 3 comps
| Address | Beds | Baths | Sqft | Rent | $/sqft | DOM | Units | Dist |
|---|---|---|---|---|---|---|---|---|
| 247 E Lake Dr Hoschton, GA | 4.0 | 2.5 | 4261 | $3,600 | $0.84 | 45d | 1 | 0.42mi |
| 274 Canyon Ferry Way Hoschton, GA | 4.0 | 2.5 | 2186 | $2,300 | $1.05 | 7d | 1 | 0.56mi |
| 300 Peachtree Rd Hoschton, GA | 3.0–4.0 | 2.5 | 2000 | $2,421 | $1.21 | 0d | 4 | 1.23mi |
HOA detail
- Monthly dues
- $70 · $840/yr
Listing history 27 events
-
2026-06-22days on market $549,900 Active 9 DOM
-
2026-06-19days on market $549,900 Active 7 DOM
-
2026-06-18days on market $549,900 Active 6 DOM
-
2026-06-17days on market $549,900 Active 5 DOM
-
2026-06-16days on market $549,900 Active 4 DOM
-
2026-06-15days on market $549,900 Active 3 DOM
-
2026-06-13days on market $549,900 Active 1 DOM
-
2026-06-01days on market $549,900 Active 120 DOM
-
2026-05-31days on market $549,900 Active 119 DOM
-
2026-05-30days on market $549,900 Active 118 DOM
-
2026-03-15price $575,000 803-char remark
-
2026-03-15price $575,000 815-char remark
-
2026-02-01$585,000 New 803-char remark
-
2026-02-01$585,000 Active 815-char remark
-
2026-01-30historical
-
2026-01-30historical
-
2025-10-24price $597,000
-
2025-10-24price $597,000
-
2025-10-03$625,000 Active
-
2025-09-30$625,000 New
-
2025-04-02soldstatus $493,599 Sold
-
2025-04-02soldstatus $493,599 Closed
-
2025-03-24status Under Contract
-
2025-03-24status Pending
-
2025-03-24$493,599 New
-
2025-03-24$493,599 Active
-
2023-05-19soldstatus $525,126
ⓘ Source: listings_history table (triggers on properties + properties_extension) + one-shot
backfill from property_details.listing_events for pre-trigger history.
Tax reassessment forecast GA · Resets to sale price
- Current annual tax
- $3,092 · $258/mo
- Projected year-2 tax
- $5,059 · $422/mo
- Expected delta
- +$1,967/yr (+$164/mo · 63.6%)
ⓘ Screening estimate from a state-policy table — verify with the county assessor before closing.
Climate risk First Street
- Flood 1/10 Low FEMA zone X (unshaded) · 0% chance over 30 yrs
- Wildfire 3/10 Moderate
- Heat 5/10 Major 6 d/yr ≥105°F today · 15 d/yr by 30 yrs out
- Wind 4/10 Moderate 12% chance of damaging wind over 30 yrs
- Air quality 3/10 Moderate 3 unhealthy d/yr today · 5 by 30 yrs out
Nearby sold comps map
Loading sold comps map…
Walkable amenities ~0.75 mi
Loading nearby amenities…
Taxation est. · year 1
- Rental income
- $37,421
- − Mortgage interest
- −$30,803
- − Property taxes
- −$3,092
- − Insurance
- −$2,750
- − Repairs & maintenance
- −$2,994
- − Management
- −$2,994
- − HOA
- −$840
- − Depreciation
- −$15,997
- Taxable loss
- −$22,048
- Est. tax savings @ 24.0%
- +$5,291
- After-tax cash flow
- $-6,432/yr
For passive investors: Depreciation is non-cash, so a rental often shows a tax loss while cash-flowing — sheltering income. Rental losses are passive: they offset passive income freely, and up to $25,000/yr can offset ordinary (W-2) income if you actively participate and your MAGI is under $100k (phasing out to $0 by $150k); unused losses carry forward. On sale, claimed depreciation is recaptured at up to 25%, and gains may owe capital-gains tax (a 1031 exchange can defer both). Figures are a year-1 estimate at your 24.0% rate — not tax advice; consult a CPA.
Schools (NCES district)
- District
- Jackson County
- NCES district ID
- 1302940
- Math proficiency
- 38% ▼ -14.00%
- Reading proficiency
- 37% ▼ -10.00%
- Median HH income
- $56,773
- Composite
- 33.08/100
- National rank
- #5566
- State rank
- #50 of 174 in GA
Livability — Hoschton
- Score
- 72/100
- State rank
- #71
- US rank
- #6303
Category grades
Schools grade is shown separately in the Schools card above.
Census & demographics
- Census place
- Hoschton, GA
- County
- Barrow County · 133,377 people
- City population
- 24,602
- Metro
- Atlanta-Sandy Springs-Alpharetta, GA
- Population (ZIP)
- 26,232
- Household income
- $111,257
- Rent vs Own
- Severe rent burden
- 520.0
Population outlook (Jackson County) Hauer SSP2
- Today (2025)
- 68,403 people
- By 2030
- 70,771 · +3.5%
- By 2040
- 75,050 · +9.7%
- By 2050
- 78,022 · +14.1%
- By 2075
- 82,646 · +20.8%
- By 2100
- 80,701 · +18.0%
Race, ethnicity, and origin ACS 2023
- Neighborhood character
- Predominantly White (84%)
- Race & ethnicity
- White 84% Black 6% Two or more races 5% Hispanic / Latino 5% Asian 3%
- Common ancestry
- Slovak 3% Italian 2% Lithuanian 2%
- Foreign-born
- 8% · Canada, China, South Korea
- Languages at home
- 90% English-only · Spanish 3% Other Indo-European 2% Other Asian/Pacific 2%
Political lean MEDSL · Jackson
- 2024 margin
- Solid R (+55.1) · D 22.2% · R 77.2%
- 2008→2024 swing
- +0.8pp no change · 2008: -55.9pp · 2024: -55.1pp
- All cycles
- 2024: R+55.1 2020: R+58.0 2016: R+63.9 2012: R+62.9 2008: R+55.9
Not yet ingested
- Civics
- —
Market trends
- HPI YoY
- ▼ -73.49%
- Current HPI
- 236.1853
- Rent YoY
- ▼ -2.44%
- Metro
- Atlanta-Sandy Springs-Alpharetta, GA
- State GDP YoY
- ▲ 2.66%
- F500 in state
- 28
Industry mix (Fortune 500 HQ in GA)
| Industry | F500 HQs | Revenue |
|---|---|---|
| Paper / Packaging | 2 | $29B |
|
||
| Retail | 1 | $160B |
|
||
| Transportation / Logistics | 1 | $91B |
|
||
| Airlines | 1 | $62B |
|
||
| Consumer Goods | 1 | $47B |
|
||
| Utilities | 1 | $25B |
|
||
Price history
+4.7% since first listed23 events — show timeline
- 2026-06-12 Listed $549,900 FMLS
- 2026-06-01 Listing Removed — FMLS
- 2026-06-01 Listing Removed — GAMLS
- 2026-05-23 Price Changed $549,900 GAMLS
- 2026-05-23 Price Changed $549,900 FMLS
- 2026-03-15 Price Changed $575,000 GAMLS
- 2026-03-15 Price Changed $575,000 FMLS
- 2026-02-01 Listed $549,900 GAMLS
- 2026-02-01 Listed $585,000 FMLS
- 2026-02-01 Listed $585,000 GAMLS
- 2026-01-30 Listing Removed — GAMLS
- 2026-01-30 Listing Removed — FMLS
- 2025-10-24 Price Changed $597,000 GAMLS
- 2025-10-24 Price Changed $597,000 FMLS
- 2025-10-03 Listed $625,000 FMLS
- 2025-09-30 Listed $625,000 GAMLS
- 2025-04-02 Sold (MLS) $493,599 GAMLS
- 2025-04-02 Sold (MLS) $493,599 FMLS
- 2025-03-24 Pending — GAMLS
- 2025-03-24 Pending — FMLS
- 2025-03-24 Listed $493,599 GAMLS
- 2025-03-24 Listed $493,599 FMLS
- 2023-05-19 Sold (Public Records) $525,126 Public Records
Property tax history
+42.3%/yrLatest (2025): $3,092 · +207.1% YoY. Source: county tax records.
Cash-flow waterfall
monthlySold comps — $/sqft
last 12 mo · ≤1 miLoading sold comps…