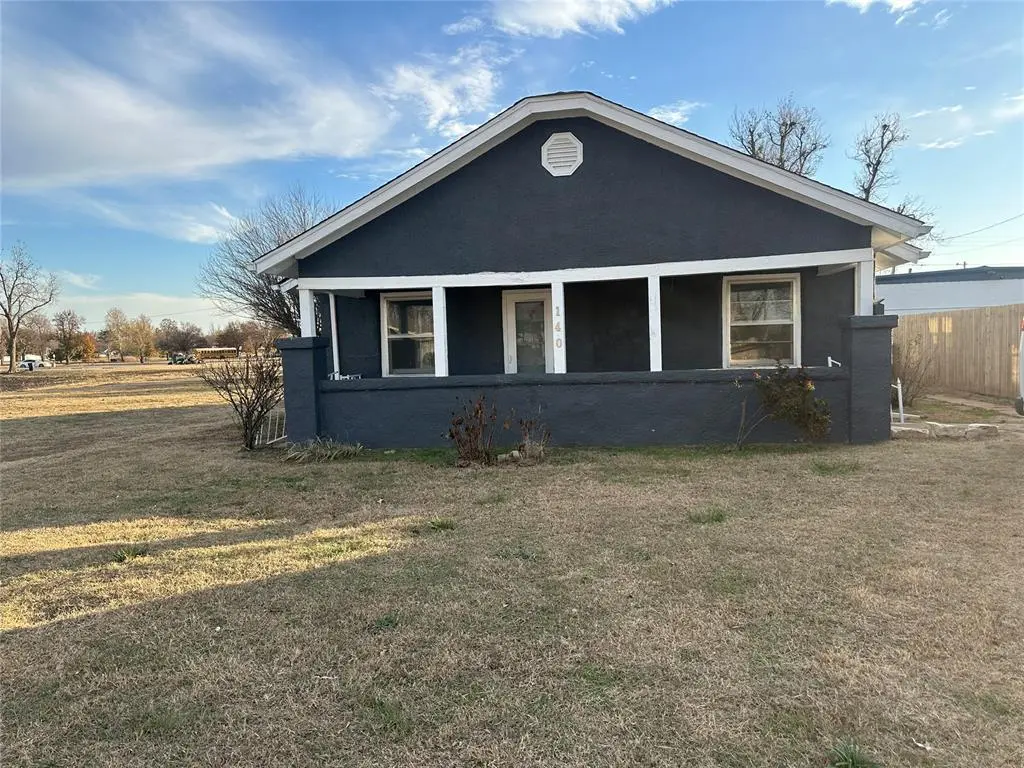
140 SW 35th St · Oklahoma City, OK
Flood risk 1/10 · Minimal
- FEMA flood zone
- X (shaded)
- Chance of flooding over 30 yrs
- 0.0%
- Est. flood insurance / yr
- $507 – $1,088
Fire risk 1/10 · Minimal
- Est. fire insurance / yr
- $2,463 – $4,575
Heat risk 6/10 · Moderate
- Hot days now (above 107°F)
- 7 days/yr
- Hot days in 30 yrs
- 19 days/yr
Wind risk 2/10 · Minimal
- Chance of severe wind over 30 yrs
- 4.0%
Air-quality risk 1/10 · Minimal
- Unhealthy air days now
- 0 days/yr
- Unhealthy air days in 30 yrs
- 0 days/yr
Risk factors via First Street. Map © Google.
Why this score? — see what drove the C grade
The composite is a weighted blend of 9 inputs, each scored 0–100. Each bar is that input's sub-score; the figure is the points it added to the 100-point composite (weight × sub-score).
- Cash flow +24.7/30.0
- ARV discount +9.6/15.0
- DSCR +8.0/10.0
- 1% rule +6.3/10.0
- Livability +4.0/5.0
- Rent growth +2.8/5.0
- Condition / age +2.5/5.0
- Schools +0.7/10.0
- Appreciation +0.0/10.0
$110,000
🖨 Deal sheet 📄 Offer letter ✓ Due diligence
Listing remarks MLS
Great investment property opportunity on a larger lot. Inside offers a large living area and spacious bedrooms. Property has updated electrical, flooring, paint and is ready for its next owner.
Key facts
- Updated electrical
- Investment property
- Wheeler district
Tags
Neighborhood map
What this means for you Summary
Snapshot
- This is a 3-bed/2.0-bath single-family listed at $110k.
Deal economics
- At list price, monthly cash flow is $230 ($3k/yr) — positive.
- The deal already cash-flows at list — no discount required.
- Meets the 1% rule at list price ($1k rent vs $110k).
- Cap rate 8.8% vs local median 3.7% in Oklahoma City — top-decile yield for the area; either an underpriced asset or a hidden risk that comps aren't pricing in. Stress-test before assuming the spread holds.
Location & tenants
- Location reads 80/100 on livability (#3 in OK, #1,635 nationally) — a professional / high-income tenant draw. Strengths: amenities A+, commute A+, cost of living A+; Watch: schools F, crime F.
- Oklahoma City (urban): math 7% / reading 10% proficiency, ranked #254 of 270 in OK (top 94%) — low school quality limits family demand, transient renter base, plan for 1-2y turnover; 82% free/reduced lunch — lower-income household profile, screen leases tightly.
- Market conditions: Rents rising (+1.1%/yr); 93 active listings in the ZIP; 23 comparable units currently listed for rent nearby; rentals at typical pace (median 24d on market — plan ~3-4 weeks tenant-placement turnaround); 5,365 units permitted in Oklahoma County in 2024 (569 in 5+ unit buildings).
- This rent runs 33% of the median local income ($45k/yr) — at the standard rent-burdened threshold; future hikes will face affordability resistance.
Forward outlook
- Local home prices are declining (-3.0%/yr); year-one equity from $761 of loan paydown is wiped out by about $3k of value loss. Plan a longer hold.
- Oklahoma County population projected at +41% by 2050 — long-run rental-demand tailwind backs the buy-and-hold thesis.
Negotiation context
- Only 12 days on market — expect competitive offers; lowballing is unlikely to land.
- Current owner paid $89k; 24% above their basis — modest negotiation headroom, anchor on the comps not their cost.
Risks & watch-outs
- Watch-outs: built in 1948 — expect roof / HVAC / electrical / plumbing capex.
- Climate carrying-cost: extreme-heat days projected 7→19/yr by 2055 (HVAC capex compounding) — expect insurance premiums to compound above CPI over the hold.
Questions for the listing agent
- Built in 1948 — when were the roof, HVAC, electrical panel, plumbing, and water heater last replaced?
- Is there a deadline driving the sale (1031 exchange, divorce, estate, relocation)? That informs how much negotiation room exists.
- Schools are F-rated, which usually means shorter tenancies and higher turnover. Who's the typical renter profile here, and what's been the actual vacancy rate?
- Crime grade is F in this area — have there been break-ins, vandalism, or insurance claims at this property in the last 3 years? What carrier currently insures it and at what premium?
- What's the average days-on-market for RENTAL listings here right now (not sales)? A rising rental-DOM trend means longer vacancies and softer asking-rent achievability than the comps imply.
- What's the recent tenant-quality profile in this submarket — average credit score on applications, eviction rate, late-payment / NSF rate, and stable-employment percentage? A property-management company in the area should have these aggregated.
- How much new for-sale + rental construction is in the pipeline within 1–3 miles? Heavy new supply typically softens prices + rents 12–24 months out; constrained supply supports both.
Investment metrics
- 1% rule
- 1.13% ✓
- Cap rate
- 8.81%
- Cash-on-cash
- 8.97%
- DSCR
- 1.40
- GRM
- 7.4
CMA / ARV
- ARV (median comp)
- $115,302
- List price
- $110,000
- Delta
- -4.16%
- Verdict
- FAIR
- Comps
- 20 within 1.0 mi
Show comp detail 12 sales within ~0.75 mi
| Address | Dist | Beds/Ba | Sqft | Sold | Price | $/sf | Match |
|---|---|---|---|---|---|---|---|
| 114 SE 37th St | 0.36mi | 3/1.0 | 1,392 (+1%) | 9mo | $109,825 | $79 | 70 |
| 520 SW 31st St | 0.48mi | 3/2.0 | 1,337 (-3%) | 6mo | $244,000 | $182 | 68 |
| 235 SE 40th St | 0.60mi | 3/1.5 | 1,428 (+3%) | 7mo | $47,500 | $33 | 58 |
| 3214 S Walker Ave | 0.40mi | 3/1.5 | 1,484 (+7%) | 14mo | $155,000 | $104 | 55 |
| 4312 S Lee Ave | 0.67mi | 3/2.0 | 1,539 (+11%) | 4mo | $219,900 | $143 | 46 |
| 243 SE 41 St | 0.66mi | 2/1.0 (-1) | 1,319 (-5%) | 8mo | $65,000 | $49 | 46 |
| 4605 S Santa Fe Ave | 0.67mi | 4/2.5 (+1) | 1,352 (-2%) | 16mo | $146,900 | $109 | 44 |
| 118 SE 40th St | 0.48mi | 3/2.0 | 1,210 (-12%) | 17mo | $142,000 | $117 | 42 |
| 4521 S Harvey Ave St | 0.64mi | 3/1.5 | 1,498 (+8%) | 14mo | $182,500 | $122 | 42 |
| 4521 S Melrose Ln | 0.64mi | 4/1.5 (+1) | 1,200 (-13%) | 1mo | $158,000 | $132 | 40 |
| 4213 S Walker Ave | 0.56mi | 3/1.0 | 1,230 (-11%) | 14mo | $157,500 | $128 | 40 |
| 132 SE 33rd St | 0.40mi | 2/1.0 (-1) | 1,191 (-14%) | 13mo | $93,000 | $78 | 38 |
Match score weights: distance 35% · size 25% · config 20% · recency 20%. Top-matched comps best support the ARV.
Projected returns pro-forma
-3.0% appreciation · 1.13% rent growth · sell at horizon
- IRR
- -4.8%
- Equity multiple
- 0.82×
- Total profit
- $-5,439
- Equity at exit
- $16,401
- IRR
- 2.5%
- Equity multiple
- 1.17×
- Total profit
- $5,122
- Equity at exit
- $9,511
Cash invested: $30,800 (down + closing). Projections, not guarantees.
Landlord ↔ Tenant lean methodology
- Overall (STATE)
- 83 Strongly Landlord-Friendly
- State Oklahoma
- 83 Strongly Landlord-Friendly · R+20
- County
- — inherits STATE
- City
- — inherits STATE
ZIP-level market 73119
- Home prices YoY
- -14.4%
- Rents YoY
- 1.1%
- Active inventory
- 93
- Price-to-rent
- 7.4×
Monthly cashflow live
- Estimated rent
- $1,246 high interval (Pro) →
- Mortgage (P&I)
- −$577
- Tax from tax record
- −$131 /mo · $1,571/yr
- Insurance
- −$46
- HOA
- −$0
- Vacancy / Maint / Mgmt
- −$262
- Net cashflow
- $230
Break-even live
UW: 25.0% down · 7.5% · 30yr · 1.5% tax · 5.0% vac · 8.0% maint · 8.0% mgmt
Financing live
Cash to close
- Down payment
- $27,500
- Closing costs
- $3,300
- Reserves months
- —
- Total cash needed
- —
Loan-product check · same deal, 3 products live
Conventional
25% down · 7.5% · 30yr
- Down + closing
- —
- Monthly P&I
- —
- Monthly cashflow
- —
- DSCR
- —
- Eligible?
- —
Personal DTI + credit; lowest rate.
DSCR
20% down · 8.5% · 30yr
- Down + closing
- —
- Monthly P&I
- —
- Monthly cashflow
- —
- DSCR
- —
- Eligible?
- —
No personal income docs; deal must DSCR.
Hard money
10% down · 12.0% · 12mo
- Down + closing
- —
- Monthly P&I
- —
- Monthly cashflow
- —
- DSCR
- —
- Eligible?
- —
Short-term bridge; refi at stabilization.
Rent comps 23 comps
| Address | Beds | Baths | Sqft | Rent | $/sqft | DOM | Units | Dist |
|---|---|---|---|---|---|---|---|---|
| 4101 S Shields Blvd Apt 3B Oklahoma City, OK | 3.0 | 2.0 | 957 | $1,025 | $1.07 | 4d | 1 | 0.50mi |
| 4101 S Shields Blvd Unit Shields 3B Oklahoma City, OK | 3.0 | 2.0 | 957 | $1,050 | $1.10 | 23d | 1 | 0.50mi |
| 3407 S Lee Ave Oklahoma City, OK | 2.0 | 1.0 | 900 | $980 | $1.09 | 43d | 1 | 0.52mi |
| 624 SW 44th St Oklahoma City, OK | 2.0 | 1.0 | 1206 | $1,500 | $1.24 | 43d | 1 | 0.80mi |
| 632 SW 44th St Oklahoma City, OK | 2.0 | 1.0 | 958 | $1,000 | $1.04 | 4d | 1 | 0.82mi |
| 4426 S Olie Ave Oklahoma City, OK | 2.0 | 2.0 | 1159 | $1,220 | $1.05 | 11d | 1 | 0.88mi |
| 321 SE 25th St Oklahoma City, OK | 3.0 | 1.0 | 1152 | $1,095 | $0.95 | 43d | 1 | 0.90mi |
| 407 SE 25th St Oklahoma City, OK | 3.0 | 1.0 | 896 | $1,275 | $1.42 | 44d | 1 | 0.94mi |
| 317 SE 24th St Oklahoma City, OK | 2.0 | 1.0 | 917 | $950 | $1.04 | 4d | 1 | 0.95mi |
| 104 SW 50th St Oklahoma City, OK | 4.0 | 2.0 | 1512 | $1,595 | $1.05 | 23d | 1 | 0.96mi |
| 733 SW 47th St Oklahoma City, OK | 3.0 | 1.5 | 1228 | $1,180 | $0.96 | 23d | 1 | 1.02mi |
| 5113 S Sage Ave Oklahoma City, OK | 3.0 | 1.5 | 996 | $1,025 | $1.03 | 2d | 1 | 1.02mi |
| 620 SW 50th St Oklahoma City, OK | 2.0 | 1.0 | 977 | $1,100 | $1.13 | 2d | 1 | 1.10mi |
| 904 SE 34th St Oklahoma City, OK | 4.0 | 2.0 | 1248 | $1,495 | $1.20 | 43d | 1 | 1.11mi |
| 2701 S Phillips Ave Oklahoma City, OK | 3.0 | 2.0 | 1177 | $995 | $0.85 | 23d | 1 | 1.19mi |
| 526 SE 21st St Oklahoma City, OK | 3.0 | 1.0 | 1054 | $1,150 | $1.09 | 4d | 1 | 1.24mi |
| 24 SW 54th St Oklahoma City, OK | 3.0 | 1.5 | 1272 | $1,400 | $1.10 | 43d | 1 | 1.24mi |
| 1132 SW 40th St Oklahoma City, OK | 3.0 | 2.0 | 1436 | $1,350 | $0.94 | 23d | 1 | 1.27mi |
| 630 SE 21st St Oklahoma City, OK | 3.0 | 2.0 | 1000 | $1,095 | $1.09 | 43d | 1 | 1.30mi |
| 800 SW 52nd St Oklahoma City, OK | 2.0 | 1.0 | 920 | $995 | $1.08 | 23d | 1 | 1.33mi |
| 5413 S Lee Ave Oklahoma City, OK | 3.0 | 2.0 | 1460 | $2,100 | $1.44 | 2d | 1 | 1.36mi |
| 900 Hangar Dr Oklahoma City, OK | 2.0 | 1.0–2.0 | 743 | $2,075 | $2.79 | 1d | 37 | 1.44mi |
| 1900 Terrace Lawn Dr Oklahoma City, OK | 3.0 | 2.0 | 1415 | $1,225 | $0.87 | 2d | 1 | 1.44mi |
Listing history 18 events
-
2026-06-18days on market $110,000 Active 12 DOM
-
2026-06-17days on market $110,000 Active 11 DOM
-
2026-06-16days on market $110,000 Active 10 DOM
-
2026-06-15days on market $110,000 Active 9 DOM
-
2026-06-13days on market $110,000 Active 7 DOM
-
2026-06-09days on market $110,000 Active 3 DOM
-
2026-06-08days on market $110,000 Active 2 DOM
-
2026-06-07remarks 348-char remark
-
2026-06-07pricedays on market $110,000 Active 1 DOM
-
2026-06-03days on market $110,500 Active 169 DOM
-
2026-06-02days on market $110,500 Active 168 DOM
-
2026-06-01days on market $110,500 Active 167 DOM
-
2026-05-31days on market $110,500 Active 166 DOM
-
2026-05-12price $110,500 193-char remark
Show marketing remark (193 chars)
Great investment property opportunity on a larger lot. Inside offers a large living area and spacious bedrooms. Property has updated electrical, flooring, paint and is ready for its next owner.
-
2026-01-13price $119,500 193-char remark
Show marketing remark (193 chars)
Great investment property opportunity on a larger lot. Inside offers a large living area and spacious bedrooms. Property has updated electrical, flooring, paint and is ready for its next owner.
-
2025-12-16$127,500 Active 193-char remark
Show marketing remark (193 chars)
Great investment property opportunity on a larger lot. Inside offers a large living area and spacious bedrooms. Property has updated electrical, flooring, paint and is ready for its next owner.
-
2025-05-01soldstatus $89,000
-
2024-11-15soldstatus $104,000
ⓘ Source: listings_history table (triggers on properties + properties_extension) + one-shot
backfill from property_details.listing_events for pre-trigger history.
Tax reassessment forecast OK · Resets to sale price
- Current annual tax
- $1,571 · $131/mo
- Projected year-2 tax
- $1,571 · $131/mo
- Expected delta
- $0/yr ($0/mo · 0.0%)
ⓘ Screening estimate from a state-policy table — verify with the county assessor before closing.
Climate risk First Street
- Flood 1/10 Low FEMA zone X (shaded) · 0% chance over 30 yrs
- Wildfire 1/10 Low
- Heat 6/10 Major 7 d/yr ≥107°F today · 19 d/yr by 30 yrs out
- Wind 2/10 Low 4% chance of damaging wind over 30 yrs
- Air quality 1/10 Low 0 unhealthy d/yr today · 0 by 30 yrs out
Nearby sold comps map
Loading sold comps map…
Walkable amenities ~0.75 mi
Loading nearby amenities…
Taxation est. · year 1
- Rental income
- $14,946
- − Mortgage interest
- −$6,162
- − Property taxes
- −$1,571
- − Insurance
- −$550
- − Repairs & maintenance
- −$1,196
- − Management
- −$1,196
- − Depreciation
- −$3,200
- Taxable income
- $1,072
- Est. tax owed @ 24.0%
- −$257
- After-tax cash flow
- $2,507/yr
For passive investors: Depreciation is non-cash, so a rental often shows a tax loss while cash-flowing — sheltering income. Rental losses are passive: they offset passive income freely, and up to $25,000/yr can offset ordinary (W-2) income if you actively participate and your MAGI is under $100k (phasing out to $0 by $150k); unused losses carry forward. On sale, claimed depreciation is recaptured at up to 25%, and gains may owe capital-gains tax (a 1031 exchange can defer both). Figures are a year-1 estimate at your 24.0% rate — not tax advice; consult a CPA.
Schools (NCES district)
- District
- Oklahoma City
- NCES district ID
- 4022770
- Math proficiency
- 7% ▼ -5.00%
- Reading proficiency
- 10% ▼ -6.00%
- Median HH income
- $35,606
- Composite
- 7.0/100
- National rank
- #9970
- State rank
- #254 of 270 in OK
Livability — Oklahoma City
- Score
- 80/100
- State rank
- #3
- US rank
- #1635
Category grades
Schools grade is shown separately in the Schools card above.
Census & demographics
- Census place
- Oklahoma City, OK
- County
- Oklahoma County · 771,644 people
- City population
- 498,656
- Metro
- Oklahoma City, OK
- Population (ZIP)
- 30,398
- Household income
- $45,421
- Rent vs Own
- Severe rent burden
- 1221.0
Population outlook (Oklahoma County) Hauer SSP2
- Today (2025)
- 911,875 people
- By 2030
- 982,413 · +7.7%
- By 2040
- 1,130,468 · +24.0%
- By 2050
- 1,288,422 · +41.3%
- By 2075
- 1,711,482 · +87.7%
- By 2100
- 2,088,448 · +129.0%
Race, ethnicity, and origin ACS 2023
- Neighborhood character
- Majority Hispanic (63%)
- Race & ethnicity
- Hispanic / Latino 63% Two or more races 24% White 24% Native American 7% Black 6%
- Hispanic origin (detail)
- Mexican 58%
- Common ancestry
- Slovak 1% Lithuanian 1%
- Foreign-born
- 28% · Canada
- Languages at home
- 45% English-only · Spanish 54%
Political lean MEDSL · Oklahoma
- 2024 margin
- Toss-up / Even · D 48.0% · R 49.7% · Other 2.3%
- 2008→2024 swing
- +15.1pp toward D · 2008: -16.8pp · 2024: -1.7pp
- All cycles
- 2024: R+1.7 2020: R+1.1 2016: R+10.5 2012: R+16.7 2008: R+16.8
Not yet ingested
- Civics
- —
Market trends
- HPI YoY
- ▼ -50.15%
- Current HPI
- 297.1117
- Rent YoY
- ▲ 1.13%
- Metro
- Oklahoma City, OK
- State GDP YoY
- ▲ 1.55%
- F500 in state
- 6
Industry mix (Fortune 500 HQ in OK)
| Industry | F500 HQs | Revenue |
|---|---|---|
| Energy | 3 | $48B |
|
||
Price history
+6.2% since first listed5 events — show timeline
- 2026-05-12 Price Changed $110,500 MLSOK
- 2026-01-13 Price Changed $119,500 MLSOK
- 2025-12-16 Listed $127,500 MLSOK
- 2025-05-01 Sold (Public Records) $89,000 Public Records
- 2024-11-15 Sold (Public Records) $104,000 Public Records
Property tax history
+23.4%/yrLatest (2025): $1,571 · +1038.4% YoY. Source: county tax records.
Cash-flow waterfall
monthlySold comps — $/sqft
last 12 mo · ≤1 miLoading sold comps…