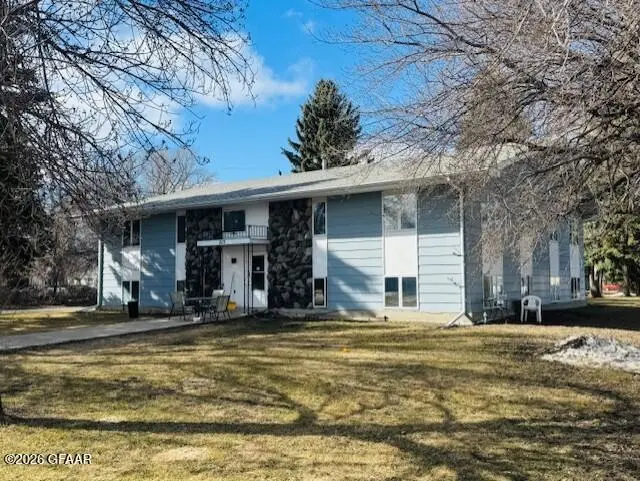
 Triplex
517 3rd St · Cando, ND
Flood risk No data
- FEMA flood zone
- —
- Chance of flooding over 30 yrs
- —
- Est. flood insurance / yr
- —
Fire risk No data
- Est. fire insurance / yr
- —
Heat risk No data
- Hot days now (above threshold)
- —
- Hot days in 30 yrs
- —
Wind risk No data
- Chance of severe wind over 30 yrs
- —
Air-quality risk No data
- Unhealthy air days now
- —
- Unhealthy air days in 30 yrs
- —
Risk factors via First Street. Map © Google.
Why this score? — see what drove the B grade
The composite is a weighted blend of 9 inputs, each scored 0–100. Each bar is that input's sub-score; the figure is the points it added to the 100-point composite (weight × sub-score).
- Cash flow +30.0/30.0
- DSCR +10.0/10.0
- 1% rule +9.5/10.0
- ARV discount +7.5/15.0
- Appreciation +5.0/10.0
- Schools +3.5/10.0
- Livability +3.5/5.0
- Rent growth +2.5/5.0
- Condition / age +2.2/5.0
$199,000
🖨 Deal sheet (PDF) 📄 Offer letter ✓ Due diligence
Multi-family units
County records classify this as Multi-Family (5+ Unit). Listing-text estimate: 3 units. estimate disagrees with records
5+ unit building — per-unit beds/baths from public records are typically unavailable; the breakdown below (if shown) is an estimate from the listing text.
Key facts
- 7,500 sq ft lot
- Built 1981
- Listed 58 days
Property features AI
Finance
- Other: Lot approximately 7,500 sq ft (50 x 300)
- Financial info: Residential income / multi-family investment property
Exterior
- Parking: Off-street parking
- Home design: Multi-family residential income property; Two levels
- Construction: Multi Family structure
- Exterior features: Off-street parking; Zoned A-1 Limited Development
Interior
- Kitchen: Range; Refrigerator
- Heating & cooling: Hot water heating system; Oil fuel
- Interior features: Dryer; Range; Refrigerator; Hot water heating; Oil heating
- Laundry & utility: Common area laundry (shared dryer)
Neighborhood map
What this means for you Summary
Snapshot
- This is a 3 × 3-bed/?-bath units multifamily listed at $199k. Condition is rated fair.
Deal economics
- At list price, monthly cash flow is $902 ($11k/yr) — positive. Per door: $301/mo.
- The deal already cash-flows at list — no discount required.
- Meets the 1% rule at list price ($3k rent vs $199k).
- Recommended offer: $193k (3.0% below list) — sets the bar for market timing.
Location & tenants
- Location reads 70/100 on livability (#90 in ND) — a middle-class / working-renter tenant base. Strengths: crime A+, cost of living A+, housing A+; Watch: schools D, employment D, amenities F.
- North Star 10 (rural): math 40% / reading 35% proficiency, ranked #113 of 169 in ND (top 67%) — families likely to look elsewhere, expect single-tenant / working-renter base with shorter leases.
- Market conditions: 10 active listings in the ZIP.
Forward outlook
- In year one you build about $7k of equity ($1k loan paydown + $6k appreciation (3.0% local appreciation)).
- Towner County population projected at +23% by 2050 — long-run rental-demand tailwind backs the buy-and-hold thesis.
- At projected returns (3.0% appreciation + 3.0% rent growth), your $56k cash investment doubles in ~3 years — after that, you're playing with house money.
- By year 5, paydown + projected appreciation supports a ~$32k cash-out refi (75% LTV) — recoverable capital for the next deal without selling this one.
Negotiation context
- It's been on market 58 days — a 3% lower offer ($193k) is reasonable based on typical stale-listing flexibility.
Questions for the listing agent
- It's been on market 58 days. Have you received any prior offers? Is the seller open to a 3% concession, seller financing, or rate buy-down credit?
- Can we see the unit-by-unit rent roll, current vacancy, and any below-market leases? What's the average tenancy length?
- What capital expenditures (roof, boiler, parking lot, exteriors) have been made in the last 5 years, and what's planned in the next 2?
- Have any recent inspections been done? Can we get a copy of the seller's disclosures and any deferred-maintenance estimates?
- Is there a deadline driving the sale (1031 exchange, divorce, estate, relocation)? That informs how much negotiation room exists.
- Schools are D-rated, which usually means shorter tenancies and higher turnover. Who's the typical renter profile here, and what's been the actual vacancy rate?
- What's the average days-on-market for RENTAL listings here right now (not sales)? A rising rental-DOM trend means longer vacancies and softer asking-rent achievability than the comps imply.
- What's the recent tenant-quality profile in this submarket — average credit score on applications, eviction rate, late-payment / NSF rate, and stable-employment percentage? A property-management company in the area should have these aggregated.
- How much new apartment / multifamily construction is in the pipeline within 1–3 miles? Heavy new supply (>2% of stock underway) typically softens rents 12–24 months out; light construction supports rent growth.
Investment metrics
- 1% rule
- 1.45% ✓
- Cap rate
- 11.73%
- Cash-on-cash
- 19.42%
- DSCR
- 1.86
- GRM
- 5.8
CMA / ARV
No comps found within radius.
Projected returns pro-forma
3.0% appreciation · 3.0% rent growth · sell at horizon
- IRR
- 25.8%
- Equity multiple
- 2.46×
- Total profit
- $81,435
- Equity at exit
- $89,479
- IRR
- 26.5%
- Equity multiple
- 4.76×
- Total profit
- $209,521
- Equity at exit
- $137,898
Cash invested: $55,720 (down + closing). Projections, not guarantees.
Landlord ↔ Tenant lean methodology
- Overall (STATE)
- 82 Strongly Landlord-Friendly
- State North Dakota
- 82 Strongly Landlord-Friendly · R+20
- County
- — inherits STATE
- City
- — inherits STATE
ZIP-level market 58324
- Active inventory
- 10
- Price-to-rent
- 17.3×
Monthly cashflow live
- Estimated rent
- $2,882 medium interval (Pro) →
- Mortgage (P&I)
- −$1,044
- Tax est. 1.5%
- −$249 /mo · $2,985/yr
- Insurance
- −$83
- HOA
- −$0
- Vacancy / Maint / Mgmt
- −$605
- Net cashflow
- $902
Break-even live
Sensitivity live
| Price | -10% $1,039 | -5% $970 | +0% $902 | +5% $833 | +10% $764 |
|---|---|---|---|---|---|
| Rent | -10% $674 | -5% $788 | +0% $902 | +5% $1,015 | +10% $1,129 |
| Rate | -1.0pp $1,002 | -0.5pp $952 | base $902 | +0.5pp $850 | +1.0pp $798 |
3-unit breakdown (identical units grouped — click to expand)
| Units | Beds | Baths | Est. rent |
|---|---|---|---|
| 3× units | 3 | — | $2,883 |
| #1 | 3 | — | $961 |
| #2 | 3 | — | $961 |
| #3 | 3 | — | $961 |
| Total (3 units) | $2,882 | ||
UW: 25.0% down · 7.5% · 30yr · 1.5% tax · 5.0% vac · 8.0% maint · 8.0% mgmt
Financing live
Cash to close
- Down payment
- $49,750
- Closing costs
- $5,970
- Reserves months
- —
- Total cash needed
- —
Loan-product check · same deal, 3 products live
Conventional
25% down · 7.5% · 30yr
- Down + closing
- —
- Monthly P&I
- —
- Monthly cashflow
- —
- DSCR
- —
- Eligible?
- —
Personal DTI + credit; lowest rate.
DSCR
20% down · 8.5% · 30yr
- Down + closing
- —
- Monthly P&I
- —
- Monthly cashflow
- —
- DSCR
- —
- Eligible?
- —
No personal income docs; deal must DSCR.
Hard money
10% down · 12.0% · 12mo
- Down + closing
- —
- Monthly P&I
- —
- Monthly cashflow
- —
- DSCR
- —
- Eligible?
- —
Short-term bridge; refi at stabilization.
Listing history 16 events
-
2026-06-21days on market $199,000 Active 58 DOM
-
2026-06-18days on market $199,000 Active 56 DOM
-
2026-06-17days on market $199,000 Active 55 DOM
-
2026-06-16days on market $199,000 Active 54 DOM
-
2026-06-15days on market $199,000 Active 53 DOM
-
2026-06-13days on market $199,000 Active 51 DOM
-
2026-06-12days on market $199,000 Active 50 DOM
-
2026-06-09days on market $199,000 Active 47 DOM
-
2026-06-08days on market $199,000 Active 46 DOM
-
2026-06-07days on market $199,000 Active 45 DOM
-
2026-06-05days on market $199,000 Active 43 DOM
-
2026-06-04days on market $199,000 Active 41 DOM
-
2026-06-02days on market $199,000 Active 40 DOM
-
2026-06-01days on market $199,000 Active 39 DOM
-
2026-05-31days on market $199,000 Active 38 DOM
-
2026-04-21$199,000 Active
ⓘ Source: listings_history table (triggers on properties + properties_extension) + one-shot
backfill from property_details.listing_events for pre-trigger history.
Nearby sold comps map
Loading sold comps map…
Walkable amenities ~0.75 mi
Loading nearby amenities…
Taxation est. · year 1
- Rental income
- $34,584
- − Mortgage interest
- −$11,147
- − Property taxes
- −$2,985
- − Insurance
- −$995
- − Repairs & maintenance
- −$2,767
- − Management
- −$2,767
- − Depreciation
- −$5,789
- Taxable income
- $8,134
- Est. tax owed @ 24.0%
- −$1,952
- After-tax cash flow
- $8,866/yr
For passive investors: Depreciation is non-cash, so a rental often shows a tax loss while cash-flowing — sheltering income. Rental losses are passive: they offset passive income freely, and up to $25,000/yr can offset ordinary (W-2) income if you actively participate and your MAGI is under $100k (phasing out to $0 by $150k); unused losses carry forward. On sale, claimed depreciation is recaptured at up to 25%, and gains may owe capital-gains tax (a 1031 exchange can defer both). Figures are a year-1 estimate at your 24.0% rate — not tax advice; consult a CPA.
Condition & rehab AI · 4 photos
This multi-family property requires moderate repairs to the exterior and roof, with some maintenance needed. Painting and trimming the landscaping can significantly improve its curb appeal and value.
Repairs flagged
- Major roof — No visible damage, but may need inspection
- Major exterior siding — Light wear and tear, some discoloration
Value-add opportunities
- Both paint exterior — Fresh paint can improve curb appeal and value
- Both trim landscaping — Well-maintained landscaping can enhance curb appeal and value
Renovation cost estimate screening
| Repair item | Severity | Est. cost |
|---|---|---|
| roof · No visible damage, but may need inspection | Major | $15,000–50,000 |
| exterior siding · Light wear and tear, some discoloration | Major | $15,000–50,000 |
| Total estimated repair cost · 2 items | $30,000–100,000 |
Value-add ROI direction
- Both paint exterior — Fresh paint can improve curb appeal and value ↑
- Both trim landscaping — Well-maintained landscaping can enhance curb appeal and value ↑
ⓘ Cost ranges are severity-bucket heuristics (US national rule-of-thumb). Get contractor quotes + a written scope before underwriting a rehab budget.
Schools (NCES district)
- District
- North Star 10
- NCES district ID
- 3800390
- Math proficiency
- 40% ▬ 0.00%
- Reading proficiency
- 35% ▼ -25.00%
- Median HH income
- $50,163
- Composite
- 34.97/100
- National rank
- #9959
- State rank
- #113 of 169 in ND
Livability — Cando
- Score
- 70/100
- State rank
- #90
- US rank
- #8005
Category grades
Schools grade is shown separately in the Schools card above.
Census & demographics
- Census place
- Cando, ND
- Population (ZIP)
- 1,354
Population outlook (Towner County) Hauer SSP2
- Today (2025)
- 2,328 people
- By 2030
- 2,390 · +2.7%
- By 2040
- 2,588 · +11.2%
- By 2050
- 2,861 · +22.9%
- By 2075
- 4,024 · +72.9%
- By 2100
- 4,838 · +107.8%
Race, ethnicity, and origin ACS 2023
- Neighborhood character
- Predominantly White (80%)
- Race & ethnicity
- White 80% Native American 9% Two or more races 8% Hispanic / Latino 6%
- Hispanic origin (detail)
- Mexican 6%
- Common ancestry
- Portuguese 24% Scottish 6% Slovak 3%
- Foreign-born
- 4% · Canada
- Languages at home
- 96% English-only · Spanish 3%
Political lean MEDSL · Towner
- 2024 margin
- Solid R (+45.7) · D 26.0% · R 71.7% · Other 2.2%
- 2008→2024 swing
- -52.8pp toward R · 2008: 7.1pp · 2024: -45.7pp
- All cycles
- 2024: R+45.7 2020: R+43.7 2016: R+37.6 2012: R+9.3 2008: D+7.1
Not yet ingested
- Civics
- —
Market trends
- HPI YoY
- —
- Current HPI
- —
- Rent YoY
- —
- Metro
- —
- State GDP YoY
- ▲ 2.09%
- F500 in state
- 2
Industry mix (Fortune 500 HQ in ND)
| Industry | F500 HQs | Revenue |
|---|---|---|
| Utilities / Construction | 1 | $6B |
|
||
Price history
1 event — show timeline
- 2026-04-21 Listed $199,000 GFAAR
Cash-flow waterfall
monthlySold comps — $/sqft
last 12 mo · ≤1 miLoading sold comps…