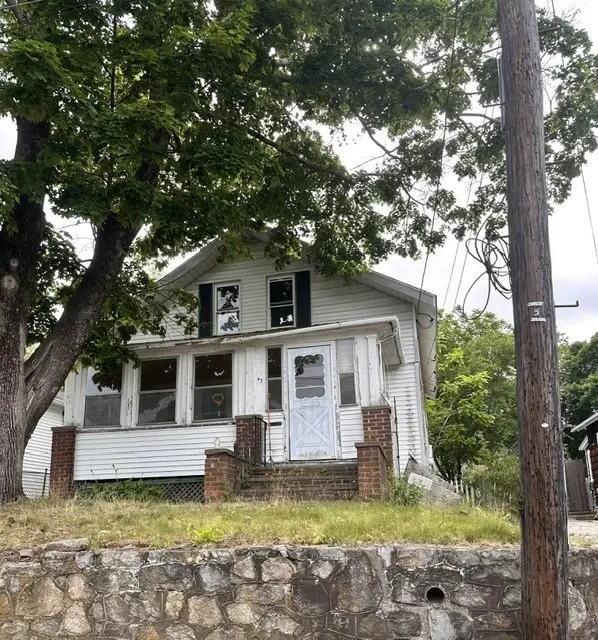
43 Plymouth Rd · Warwick, RI
Flood risk 1/10 · Minimal
- FEMA flood zone
- X (unshaded)
- Chance of flooding over 30 yrs
- 0.0%
- Est. flood insurance / yr
- $473 – $860
Fire risk 1/10 · Minimal
- Est. fire insurance / yr
- $835 – $1,551
Heat risk 5/10 · Moderate
- Hot days now (above 96°F)
- 7 days/yr
- Hot days in 30 yrs
- 16 days/yr
Wind risk 8/10 · Major
- Chance of severe wind over 30 yrs
- 80.0%
Air-quality risk 2/10 · Minimal
- Unhealthy air days now
- 2 days/yr
- Unhealthy air days in 30 yrs
- 2 days/yr
Risk factors via First Street. Map © Google.
Why this score? — see what drove the D+ grade
The composite is a weighted blend of 9 inputs, each scored 0–100. Each bar is that input's sub-score; the figure is the points it added to the 100-point composite (weight × sub-score).
- ARV discount +15.0/15.0
- Cash flow +14.9/30.0
- DSCR +4.6/10.0
- 1% rule +4.1/10.0
- Livability +3.9/5.0
- Rent growth +2.5/5.0
- Schools +2.2/10.0
- Condition / age +1.5/5.0
- Appreciation +0.0/10.0
$299,900
🖨 Deal sheet (PDF) 📄 Offer letter ✓ Due diligence
Listing remarks
Very RARE opportunity !! Desirable Chepiwanoxet Village !! Investors take notice. This is a 3 bed 1 bath home that is in need of the right team to make it shine. The hardwood floors and woodwork are in amazing shape. This will need major renovation to occupy. There is gas service in the house for cooking and hot water and there is an oil fired force air system for heat. This has not been occupied in over 10 years so disclosures are not available. This is a cash or hard money sale. Will be sold as is with a warranty deed. Cameras on the property. . Do not walk or attempt to gain entry without agent present. Professional photos to come. Seller reserves the right to accept offer prior to open
Key facts
- Woodwork
- Gas service
- Hardwood floors
Tags
Property features AI
Finance
- HOA & community: Highway access; Near hospital; Public transportation access
Exterior
- Parking: Detached garage; Total parking for 4 vehicles; 1 covered parking space
- Utilities: Cesspool sewer; Connected water
- Home design: 2-story house
- Construction: Plaster and aluminum siding exterior; Block and concrete perimeter foundation
- Exterior features: Fenced yard; Beach access; Walking distance to water
Interior
- Flooring: Hardwood
- Bathrooms: 1 full bathroom
- Heating & cooling: Forced air heating; Oil-fired heating
- Interior features: Attic; Interior steps; Storage; Tub with shower
- Laundry & utility: Gas water heater
Neighborhood map
What this means for you Summary
Snapshot
- This is a 3-bed/1.0-bath single-family listed at $300k. Condition is rated poor.
Deal economics
- At list price, monthly cash flow is $90 ($1k/yr) — positive.
- The deal already cash-flows at list — no discount required.
- To meet the 1% rule (rent ≥ 1% of price), the offer needs to be $274k (8.7% below list).
- Recommended offer: $274k (8.7% below list) — sets the bar for 1% rule.
- Cap rate 6.7% vs local median 3.3% in Warwick — top-decile yield for the area; either an underpriced asset or a hidden risk that comps aren't pricing in. Stress-test before assuming the spread holds.
Location & tenants
- Location reads 78/100 on livability (#6 in RI, #2,425 nationally) — a middle-class / working-renter tenant base. Strengths: crime A+, commute A+, housing A+; Watch: amenities F.
- Warwick (urban): math 15% / reading 32% proficiency, ranked #25 of 39 in RI (top 64%) — low school quality limits family demand, transient renter base, plan for 1-2y turnover.
- Zoned schools: Cedar Hill School (math 27% / reading 47%, grade F, #52 of 167 statewide, top 33%, 310 students, 16% FRL); Winman Middle School (math 12% / reading 22%, grade F, #35 of 57 statewide, top 62%, 725 students, 29% FRL); Toll Gate High School (math 23% / reading 50%, grade F, #25 of 58 statewide, top 42%, 1,188 students, 30% FRL) — zoned schools at 25% FRL track the district average.
- Market conditions: Rents soft (-0.1%/yr); 132 active listings in the ZIP; 5 comparable units currently listed for rent nearby; rentals leasing fast (median 13d on market — plan ~1-2 weeks tenant-placement turnaround); high-income renter base; 471 units permitted in Kent County in 2024 (240 in 5+ unit buildings).
Forward outlook
- Local home prices are declining (-3.0%/yr); year-one equity from $2k of loan paydown is wiped out by about $9k of value loss. Plan a longer hold.
- Kent County population projected at -14% by 2050 — secular population decline; favor cash flow + early exit over multi-decade hold.
Negotiation context
- Only 1 days on market — expect competitive offers; lowballing is unlikely to land.
Risks & watch-outs
- Watch-outs: built in 1935 — expect roof / HVAC / electrical / plumbing capex.
- Climate carrying-cost: severe wind risk, 80% chance of damaging wind over 30y; extreme-heat days projected 7→16/yr by 2055 (HVAC capex compounding) — expect insurance premiums to compound above CPI over the hold.
Questions for the listing agent
- Have any recent inspections been done? Can we get a copy of the seller's disclosures and any deferred-maintenance estimates?
- Built in 1935 — when were the roof, HVAC, electrical panel, plumbing, and water heater last replaced?
- Is there a deadline driving the sale (1031 exchange, divorce, estate, relocation)? That informs how much negotiation room exists.
- Schools are D-rated, which usually means shorter tenancies and higher turnover. Who's the typical renter profile here, and what's been the actual vacancy rate?
- The area grade is low — what's the realistic commute time and amenity access for the typical tenant pool here? Any planned neighborhood developments (good or bad) we should know about?
- What's the average days-on-market for RENTAL listings here right now (not sales)? A rising rental-DOM trend means longer vacancies and softer asking-rent achievability than the comps imply.
- What's the recent tenant-quality profile in this submarket — average credit score on applications, eviction rate, late-payment / NSF rate, and stable-employment percentage? A property-management company in the area should have these aggregated.
- How much new for-sale + rental construction is in the pipeline within 1–3 miles? Heavy new supply typically softens prices + rents 12–24 months out; constrained supply supports both.
Investment metrics
- 1% rule
- 0.91% ✗
- Cap rate
- 6.65%
- Cash-on-cash
- 1.29%
- DSCR
- 1.06
- GRM
- 9.1
CMA / ARV
- ARV (on-the-fly)
- $402,192
- Comps found
- 1
Show comp detail 1 sale within ~0.75 mi
| Address | Dist | Beds/Ba | Sqft | Sold | Price | $/sf | Match |
|---|---|---|---|---|---|---|---|
| 51 Alger Ave | 0.12mi | 2/2.0 (-1) | 1,152 (+14%) | 12mo | $460,000 | $399 | 52 |
Match score weights: distance 35% · size 25% · config 20% · recency 20%. Top-matched comps best support the ARV.
Projected returns pro-forma
-3.0% appreciation · 0.0% rent growth · sell at horizon
- IRR
- -17.7%
- Equity multiple
- 0.39×
- Total profit
- $-50,824
- Equity at exit
- $44,716
- IRR
- -16.8%
- Equity multiple
- 0.19×
- Total profit
- $-67,687
- Equity at exit
- $25,930
Cash invested: $83,972 (down + closing). Projections, not guarantees.
Landlord ↔ Tenant lean methodology
- Overall (STATE)
- 31 Tenant-Leaning
- State Rhode Island
- 31 Tenant-Leaning · D+8
- County
- — inherits STATE
- City
- — inherits STATE
ZIP-level market 02818
- Rents YoY
- -0.1%
- Active inventory
- 132
- Price-to-rent
- 9.1×
Monthly cashflow live
- Estimated rent
- $2,738 high interval (Pro) →
- Mortgage (P&I)
- −$1,573
- Tax est. 1.5%
- −$375 /mo · $4,498/yr
- Insurance
- −$125
- HOA
- −$0
- Vacancy / Maint / Mgmt
- −$575
- Net cashflow
- $90
Break-even live
Sensitivity live
| Price | -10% $298 | -5% $194 | +0% $90 | +5% $-13 | +10% $-117 |
|---|---|---|---|---|---|
| Rent | -10% $-126 | -5% $-18 | +0% $90 | +5% $198 | +10% $307 |
| Rate | -1.0pp $241 | -0.5pp $167 | base $90 | +0.5pp $13 | +1.0pp $-66 |
UW: 25.0% down · 7.5% · 30yr · 1.5% tax · 5.0% vac · 8.0% maint · 8.0% mgmt
Financing live
Cash to close
- Down payment
- $74,975
- Closing costs
- $8,997
- Reserves months
- —
- Total cash needed
- —
Loan-product check · same deal, 3 products live
Conventional
25% down · 7.5% · 30yr
- Down + closing
- —
- Monthly P&I
- —
- Monthly cashflow
- —
- DSCR
- —
- Eligible?
- —
Personal DTI + credit; lowest rate.
DSCR
20% down · 8.5% · 30yr
- Down + closing
- —
- Monthly P&I
- —
- Monthly cashflow
- —
- DSCR
- —
- Eligible?
- —
No personal income docs; deal must DSCR.
Hard money
10% down · 12.0% · 12mo
- Down + closing
- —
- Monthly P&I
- —
- Monthly cashflow
- —
- DSCR
- —
- Eligible?
- —
Short-term bridge; refi at stabilization.
Rent comps 5 comps
| Address | Beds | Baths | Sqft | Rent | $/sqft | DOM | Units | Dist |
|---|---|---|---|---|---|---|---|---|
| 4600 Post Rd Unit 9 East Greenwich, RI | 2.0 | 1.0 | 950 | $2,000 | $2.11 | 16d | 1 | 0.61mi |
| 4610 Post Rd Unit 20 East Greenwich, RI | 2.0 | 1.0 | 1100 | $2,400 | $2.18 | 3d | 1 | 0.64mi |
| 2 Melrose St Unit 2 East Greenwich, RI | 2.0 | 2.0 | 950 | $3,700 | $3.89 | 12d | 1 | 0.83mi |
| 19 King St Unit 1 East Greenwich, RI | 2.0 | 1.0 | 1439 | $3,250 | $2.26 | 13d | 1 | 0.89mi |
| 3595 Post Rd Warwick, RI | 1.0–2.0 | 1.0–2.0 | 951 | $2,750 | $2.89 | 3d | 8 | 1.41mi |
Listing history 4 events
-
2026-06-21status $299,900 Pending 1 DOM
-
2026-06-19remarks 699-char remark
-
2026-06-18remarks 642-char remark
-
2026-06-18$299,900 Active 1 DOM
ⓘ Source: listings_history table (triggers on properties + properties_extension) + one-shot
backfill from property_details.listing_events for pre-trigger history.
Climate risk First Street
- Flood 1/10 Low FEMA zone X (unshaded) · 0% chance over 30 yrs
- Wildfire 1/10 Low
- Heat 5/10 Major 7 d/yr ≥96°F today · 16 d/yr by 30 yrs out
- Wind 8/10 Severe 80% chance of damaging wind over 30 yrs
- Air quality 2/10 Low 2 unhealthy d/yr today · 2 by 30 yrs out
Nearby sold comps map
Loading sold comps map…
Walkable amenities ~0.75 mi
Loading nearby amenities…
Taxation est. · year 1
- Rental income
- $32,854
- − Mortgage interest
- −$16,799
- − Property taxes
- −$4,498
- − Insurance
- −$1,500
- − Repairs & maintenance
- −$2,628
- − Management
- −$2,628
- − Depreciation
- −$8,724
- Taxable loss
- −$3,924
- Est. tax savings @ 24.0%
- +$942
- After-tax cash flow
- $2,026/yr
For passive investors: Depreciation is non-cash, so a rental often shows a tax loss while cash-flowing — sheltering income. Rental losses are passive: they offset passive income freely, and up to $25,000/yr can offset ordinary (W-2) income if you actively participate and your MAGI is under $100k (phasing out to $0 by $150k); unused losses carry forward. On sale, claimed depreciation is recaptured at up to 25%, and gains may owe capital-gains tax (a 1031 exchange can defer both). Figures are a year-1 estimate at your 24.0% rate — not tax advice; consult a CPA.
Condition & rehab AI · 12 photos
This property requires extensive renovation to bring it up to modern standards, with a focus on the kitchen and bathroom. A fresh paint job and HVAC upgrade will significantly improve its resale and rental value.
Repairs flagged
- Major kitchen appliances — need replacement
- Major bathroom fixtures — need replacement
- Major flooring — need replacement
- Major exterior paint — peeling and in poor condition
- Major interior paint — peeling and in poor condition
- Major HVAC system — dated and likely inefficient
Value-add opportunities
- Resale kitchen renovation — modern kitchen will attract buyers
- Resale bathroom renovation — modern bathroom will attract buyers
- Resale exterior paint job — fresh paint will improve curb appeal
- Both HVAC system upgrade — modern HVAC will improve comfort and energy efficiency
Renovation cost estimate screening
| Repair item | Severity | Est. cost |
|---|---|---|
| kitchen appliances · need replacement | Major | $15,000–50,000 |
| bathroom fixtures · need replacement | Major | $15,000–50,000 |
| flooring · need replacement | Major | $15,000–50,000 |
| exterior paint · peeling and in poor condition | Major | $15,000–50,000 |
| interior paint · peeling and in poor condition | Major | $15,000–50,000 |
| HVAC system · dated and likely inefficient | Major | $15,000–50,000 |
| Total estimated repair cost · 6 items | $90,000–300,000 |
Value-add ROI direction
- Resale kitchen renovation — modern kitchen will attract buyers ↑
- Resale bathroom renovation — modern bathroom will attract buyers ↑
- Resale exterior paint job — fresh paint will improve curb appeal ↑
- Both HVAC system upgrade — modern HVAC will improve comfort and energy efficiency ↑
ⓘ Cost ranges are severity-bucket heuristics (US national rule-of-thumb). Get contractor quotes + a written scope before underwriting a rehab budget.
Schools (NCES district)
- District
- Warwick
- NCES district ID
- 4401110
- Math proficiency
- 15% ▼ -11.00%
- Reading proficiency
- 32% ▼ -7.00%
- Median HH income
- $63,420
- Composite
- 22.03/100
- National rank
- #8203
- State rank
- #25 of 39 in RI
Livability — Warwick
- Score
- 78/100
- State rank
- #6
- US rank
- #2425
Category grades
Schools grade is shown separately in the Schools card above.
Census & demographics
- Census place
- Warwick, RI
- County
- Kent County · 90,904 people
- City population
- 108,434
- Metro
- Providence-Warwick, RI-MA
- Population (ZIP)
- 19,786
- Household income
- $139,217
- Rent vs Own
- Severe rent burden
- 379.0
Population outlook (Kent County) Hauer SSP2
- Today (2025)
- 160,994 people
- By 2030
- 157,428 · -2.2%
- By 2040
- 148,389 · -7.8%
- By 2050
- 137,995 · -14.3%
- By 2075
- 118,536 · -26.4%
- By 2100
- 102,266 · -36.5%
Race, ethnicity, and origin ACS 2023
- Neighborhood character
- Predominantly White (84%)
- Race & ethnicity
- White 84% Asian 8% Two or more races 4% Hispanic / Latino 4% Black 1%
- Common ancestry
- Lithuanian 6% Romanian 4% Scotch-Irish 2%
- Foreign-born
- 12% · China, Canada, South Korea
- Languages at home
- 88% English-only · Other Indo-European 4% Chinese 2% Spanish 2%
Political lean MEDSL · Kent
- 2024 margin
- Toss-up / Even · D 49.9% · R 48.1% · Other 2.0%
- 2008→2024 swing
- -15.6pp toward R · 2008: 17.5pp · 2024: 1.9pp
- All cycles
- 2024: D+1.9 2020: D+7.6 2016: R+0.7 2012: D+18.4 2008: D+17.5
Not yet ingested
- Civics
- —
Market trends
- HPI YoY
- ▼ -440.62%
- Current HPI
- 331.8657
- Rent YoY
- ▼ -0.06%
- Metro
- Providence-Warwick, RI-MA
- State GDP YoY
- ▲ 2.25%
- F500 in state
- 10
Industry mix (Fortune 500 HQ in RI)
| Industry | F500 HQs | Revenue |
|---|---|---|
| Healthcare | 1 | $373B |
|
||
| Food Distribution | 1 | $31B |
|
||
| Aerospace / Defense | 1 | $14B |
|
||
| Financial Services | 1 | $8B |
|
||
| Consumer Goods | 1 | $4B |
|
||
Price history
1 event — show timeline
- 2026-06-18 Listed $299,900 RIS
Cash-flow waterfall
monthlySold comps — $/sqft
last 12 mo · ≤1 miLoading sold comps…