 🏗️ New Construction
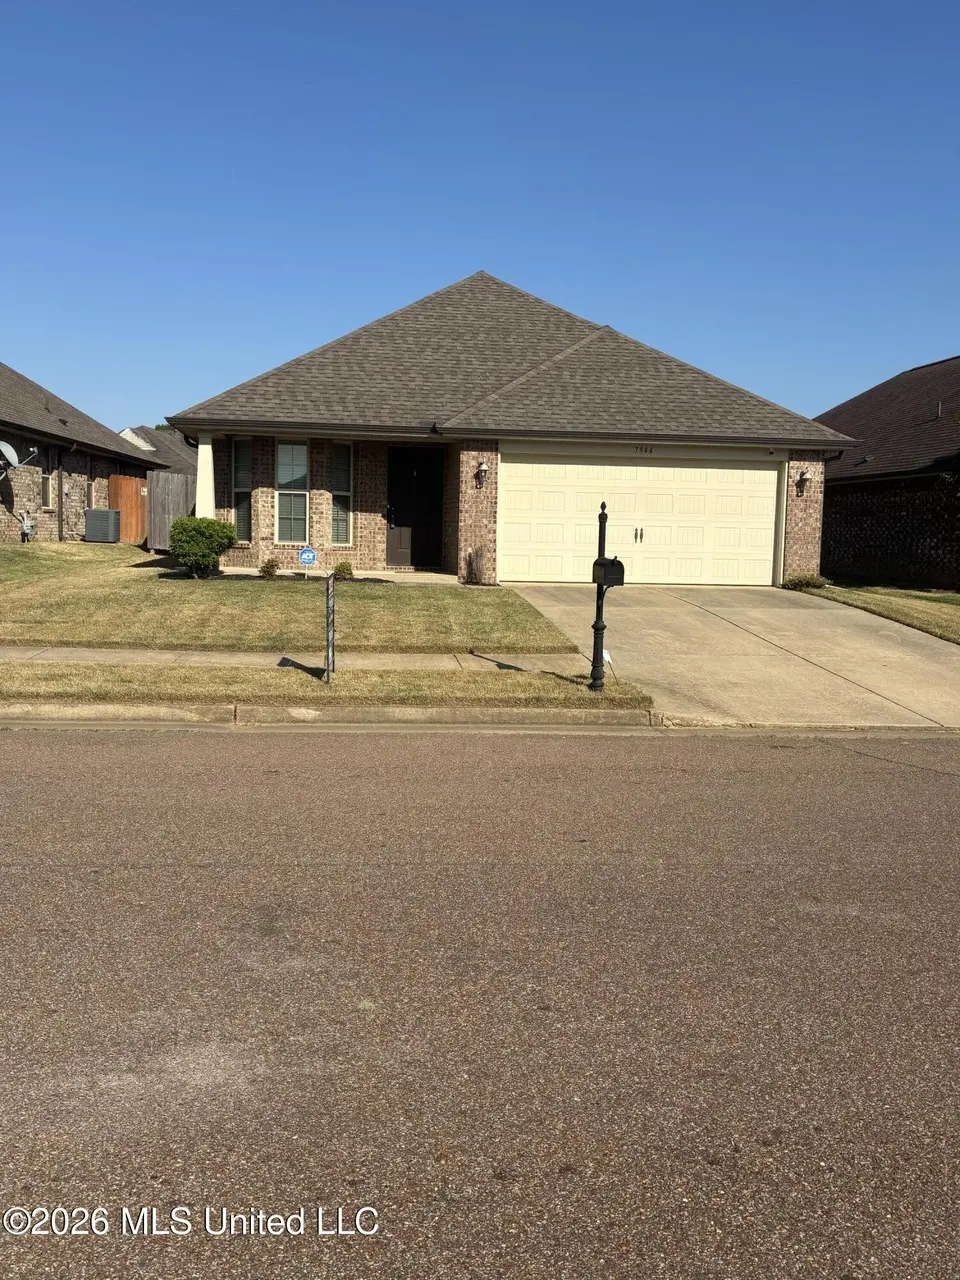
7944 Allenwood Ln · Olive Branch, MS
Flood risk 1/10 · Minimal
- FEMA flood zone
- X (unshaded)
- Chance of flooding over 30 yrs
- 0.0%
- Est. flood insurance / yr
- $507 – $1,088
Fire risk 1/10 · Minimal
- Est. fire insurance / yr
- $1,241 – $2,305
Heat risk 7/10 · Major
- Hot days now (above 109°F)
- 7 days/yr
- Hot days in 30 yrs
- 21 days/yr
Wind risk 4/10 · Minor
- Chance of severe wind over 30 yrs
- 20.0%
Air-quality risk 2/10 · Minimal
- Unhealthy air days now
- 2 days/yr
- Unhealthy air days in 30 yrs
- 2 days/yr
Risk factors via First Street. Map © Google.
Why this score? — see what drove the D- grade
The composite is a weighted blend of 9 inputs, each scored 0–100. Each bar is that input's sub-score; the figure is the points it added to the 100-point composite (weight × sub-score).
- Cash flow +13.2/30.0
- ARV discount +7.5/15.0
- DSCR +4.0/10.0
- Schools +4.0/10.0
- Livability +3.6/5.0
- 1% rule +2.8/10.0
- Condition / age +2.5/5.0
- Rent growth +2.4/5.0
- Appreciation +0.0/10.0
$272,000
🖨 Deal sheet (PDF) 📄 Offer letter ✓ Due diligence
Listing remarks MLS
ADAMS HOMES CRAFTSMAN 1668 PLAN IS 3 BEDROOMS AND 2 FULL BATHS. FEATURES A MASTER SUITE WITH TREY CEILINGS, AND A WALK IN CLOSET. DOUBLE RAISED VANITY. LARGE FAMILY ROOM WITH GAS FIREPLACE. KITCHEN HAS NICE SIZED PANTRY, AND IS OPEN TO A DINING ROOM. HAS COVERED FRONT PORCH AND BACK PORCH WITH A 2 CAR GARAGE. INCLUDES GE APPLIANCES(REFRIGERATOR NOT INCLUDED). ONE YEAR BUILDER WARRANTY AND A 2-10 BONDED BUILDER WARRANTY.
Key facts
- Master suite
- Cozy gas fireplace
- Large family room
Tags
Property features AI
Exterior
- Parking: 2-car garage with direct access; Concrete driveway
- Security: 24-hour security; Security system; Smoke detectors; Carbon monoxide detectors
- Utilities: Public water; Public sewer; Electricity connected; Natural gas connected; Cable available
- Home design: Single-family house; One story; New construction
- Construction: Brick and siding exterior; Architectural composition shingle roof; Slab foundation; Built by owner (year built source: Owner)
- Exterior features: Private, landscaped yard; Back yard fenced with privacy wood fencing; Patio slab; Rain gutters
Interior
- Kitchen: Dishwasher; Disposal; Free-standing electric range; Free-standing range; Microwave; Refrigerator; Breakfast bar
- Bedrooms: Primary bedroom; Additional bedrooms (2)
- Flooring: Carpet; Combination flooring; Laminate; Linoleum; Vinyl
- Bathrooms: 2 full bathrooms
- Heating & cooling: Forced air heating (natural gas); Central air conditioning; Ceiling fans; Electric and gas utilities for cooling
- Interior features: Ceiling fans; Pantry; Soaking tub; Breakfast bar; Gas log fireplace in the great room; Blinds and insulated windows; Deadbolt and insulated metal doors
- Laundry & utility: Washer and dryer hookups; Inside laundry with electric dryer hookup; Common area laundry; Water heater
Neighborhood map
What this means for you Summary
Snapshot
- This is a 3-bed/2.0-bath single-family listed at $272k.
Deal economics
- At list price, monthly cash flow is $-6 ($-74/yr) — negative.
- To cash-flow at today's rent, offer at most $271k (0.2% below list).
- To meet the 1% rule (rent ≥ 1% of price), the offer needs to be $213k (21.5% below list).
- Recommended offer: $213k (21.5% below list) — sets the bar for 1% rule.
- Cap rate 6.3% vs local median 4.3% in Olive Branch — top-decile yield for the area; either an underpriced asset or a hidden risk that comps aren't pricing in. Stress-test before assuming the spread holds.
Location & tenants
- Location reads 72/100 on livability (#29 in MS) — a middle-class / working-renter tenant base. Strengths: cost of living A+, housing A+, employment A; Watch: amenities F, commute F.
- Desoto County School District (suburban): math 48% / reading 42% proficiency, ranked #20 of 130 in MS (top 15%) — families likely to look elsewhere, expect single-tenant / working-renter base with shorter leases.
- Zoned schools: Olive Branch Elem (503 students, 99% FRL); Olive Branch Middle (math 48% / reading 32%, grade F, #68 of 179 statewide, top 38%, 726 students, 100% FRL); Olive Branch High School (math 54% / reading 48%, grade D+, #17 of 197 statewide, top 9%, 1,117 students, 100% FRL) — zoned schools average 100% FRL vs 43% district-wide (56 pts higher); higher-poverty schools than district average — tighter screening recommended.
- Market conditions: Rents soft (-0.3%/yr); 575 active listings in the ZIP; 6 comparable units currently listed for rent nearby; rentals leasing fast (median 13d on market — plan ~1-2 weeks tenant-placement turnaround); solid renter incomes; 1,155 units permitted in DeSoto County in 2024 (0 in 5+ unit buildings).
Forward outlook
- Local home prices are declining (-3.0%/yr); year-one equity from $2k of loan paydown is wiped out by about $8k of value loss. Plan a longer hold.
- DeSoto County population projected at +33% by 2050 — long-run rental-demand tailwind backs the buy-and-hold thesis.
Negotiation context
- It's been on market 15 days — a 2% lower offer ($268k) is reasonable based on typical stale-listing flexibility.
- 2 sale attempts since 10y ago with the ask held roughly flat each time — persistent listings suggest the price (not the market) is what's stuck; bring a comps-based counter.
Risks & watch-outs
- Climate carrying-cost: extreme-heat days projected 7→21/yr by 2055 (HVAC capex compounding) — expect insurance premiums to compound above CPI over the hold.
Questions for the listing agent
- What do current leases actually rent for vs. the listed asking? Can we see a recent rent roll and the last 12 months of T-12 income?
- Is there a deadline driving the sale (1031 exchange, divorce, estate, relocation)? That informs how much negotiation room exists.
- Schools are B-rated — typically a magnet for longer-tenancy family renters. What's the average tenant stay here, and is there a school-zone premium baked into asking?
- The area grade is low — what's the realistic commute time and amenity access for the typical tenant pool here? Any planned neighborhood developments (good or bad) we should know about?
- What's the average days-on-market for RENTAL listings here right now (not sales)? A rising rental-DOM trend means longer vacancies and softer asking-rent achievability than the comps imply.
- What's the recent tenant-quality profile in this submarket — average credit score on applications, eviction rate, late-payment / NSF rate, and stable-employment percentage? A property-management company in the area should have these aggregated.
- How much new for-sale + rental construction is in the pipeline within 1–3 miles? Heavy new supply typically softens prices + rents 12–24 months out; constrained supply supports both.
Investment metrics
- 1% rule
- 0.78% ✗
- Cap rate
- 6.27%
- Cash-on-cash
- -0.10%
- DSCR
- 1.00
- GRM
- 10.6
CMA / ARV
- ARV (median comp)
- $272,553
- List price
- $272,000
- Delta
- -0.20%
- Verdict
- FAIR
- Comps
- 20 within 1.0 mi
Show comp detail 12 sales within ~0.75 mi
| Address | Dist | Beds/Ba | Sqft | Sold | Price | $/sf | Match |
|---|---|---|---|---|---|---|---|
| 7944 Allenwood Ln | 0.00mi | 3/2.0 | 1,668 (+0%) | 1mo | $272,000 | $163 | 99 |
| 7831 Ferndale Dr | 0.16mi | 3/2.0 | 1,717 (+3%) | 2mo | $249,500 | $145 | 86 |
| 7843 Ferndale Dr | 0.16mi | 3/2.0 | 1,717 (+3%) | 5mo | $279,000 | $162 | 84 |
| 7905 Gardendale Dr | 0.16mi | 3/2.0 | 1,717 (+3%) | 6mo | $309,200 | $180 | 83 |
| 7880 Allenwood Ln | 0.07mi | 3/2.0 | 1,449 (-13%) | 6mo | $279,900 | $193 | 70 |
| 7835 Gardendale Dr | 0.21mi | 4/2.0 (+1) | 1,820 (+9%) | 2mo | $324,600 | $178 | 68 |
| 7736 Ferndale Dr | 0.16mi | 3/2.0 | 1,425 (-14%) | 1mo | $286,250 | $201 | 68 |
| 7843 Gardendale Dr | 0.20mi | 4/2.0 (+1) | 1,820 (+9%) | 4mo | $314,600 | $173 | 67 |
| 7839 Gardendale Dr | 0.20mi | 4/2.0 (+1) | 1,820 (+9%) | 4mo | $314,800 | $173 | 67 |
| 7384 Woodland Dr | 0.71mi | 3/2.0 | 1,693 (+2%) | 2mo | $229,999 | $136 | 62 |
| 7859 Gardendale Dr | 0.18mi | 3/2.0 | 1,425 (-14%) | 8mo | $290,250 | $204 | 61 |
| 7333 Deerbrook Rd | 0.74mi | 4/2.0 (+1) | 1,457 (-12%) | 6mo | $256,900 | $176 | 34 |
Match score weights: distance 35% · size 25% · config 20% · recency 20%. Top-matched comps best support the ARV.
Projected returns pro-forma
-3.0% appreciation · 0.0% rent growth · sell at horizon
- IRR
- -19.6%
- Equity multiple
- 0.33×
- Total profit
- $-50,896
- Equity at exit
- $40,639
- IRR
- -19.4%
- Equity multiple
- 0.09×
- Total profit
- $-69,340
- Equity at exit
- $23,565
Cash invested: $76,315 (down + closing). Projections, not guarantees.
Landlord ↔ Tenant lean methodology
- Overall (STATE)
- 90 Strongly Landlord-Friendly
- State Mississippi
- 90 Strongly Landlord-Friendly · R+11
- County
- — inherits STATE
- City
- — inherits STATE
ZIP-level market 38654
- Home prices YoY
- -26.1%
- Rents YoY
- -0.3%
- Active inventory
- 575
- Price-to-rent
- 10.6×
Monthly cashflow live
- Estimated rent
- $2,134 high interval (Pro) →
- Mortgage (P&I)
- −$1,429
- Tax from tax record
- −$149 /mo · $1,791/yr
- Insurance
- −$114
- HOA
- −$0
- Vacancy / Maint / Mgmt
- −$448
- Net cashflow
- $-6
Break-even live
Sensitivity live
| Price | -10% $148 | -5% $71 | +0% $-6 | +5% $-83 | +10% $-160 |
|---|---|---|---|---|---|
| Rent | -10% $-175 | -5% $-90 | +0% $-6 | +5% $78 | +10% $162 |
| Rate | -1.0pp $131 | -0.5pp $63 | base $-6 | +0.5pp $-77 | +1.0pp $-149 |
UW: 25.0% down · 7.5% · 30yr · 1.5% tax · 5.0% vac · 8.0% maint · 8.0% mgmt
Financing live
Cash to close
- Down payment
- $68,138
- Closing costs
- $8,177
- Reserves months
- —
- Total cash needed
- —
Loan-product check · same deal, 3 products live
Conventional
25% down · 7.5% · 30yr
- Down + closing
- —
- Monthly P&I
- —
- Monthly cashflow
- —
- DSCR
- —
- Eligible?
- —
Personal DTI + credit; lowest rate.
DSCR
20% down · 8.5% · 30yr
- Down + closing
- —
- Monthly P&I
- —
- Monthly cashflow
- —
- DSCR
- —
- Eligible?
- —
No personal income docs; deal must DSCR.
Hard money
10% down · 12.0% · 12mo
- Down + closing
- —
- Monthly P&I
- —
- Monthly cashflow
- —
- DSCR
- —
- Eligible?
- —
Short-term bridge; refi at stabilization.
Rent comps 6 comps
| Address | Beds | Baths | Sqft | Rent | $/sqft | DOM | Units | Dist |
|---|---|---|---|---|---|---|---|---|
| 7959 Ridgedale Dr Olive Branch, MS | 3.0 | 2.0 | 1510 | $1,910 | $1.26 | 12d | 1 | 0.03mi |
| 7916 Ridgedale Dr Olive Branch, MS | 4.0 | 2.0 | 1724 | $1,945 | $1.13 | 5d | 1 | 0.09mi |
| 8564 Courtly Cir N Olive Branch, MS | 4.0 | 3.0 | 2207 | $2,140 | $0.97 | 45d | 1 | 0.96mi |
| 6769 Terry Chase Olive Branch, MS | 4.0 | 2.0 | 2002 | $2,315 | $1.16 | 6d | 1 | 1.29mi |
| 9025 Creekside Dr Olive Branch, MS | 3.0 | 2.5 | 1800 | $1,995 | $1.11 | 6d | 1 | 1.37mi |
| 9112 Lakeshore Dr Olive Branch, MS | 4.0 | 2.5 | 1985 | $2,350 | $1.18 | 45d | 1 | 1.45mi |
Listing history 4 events
-
2026-05-04status Pending 658-char remark
-
2026-04-19$272,000 Active 658-char remark
-
2016-07-29soldstatus 423-char remark
Show marketing remark (423 chars)
ADAMS HOMES CRAFTSMAN 1668 PLAN IS 3 BEDROOMS AND 2 FULL BATHS. FEATURES A MASTER SUITE WITH TREY CEILINGS, AND A WALK IN CLOSET. DOUBLE RAISED VANITY. LARGE FAMILY ROOM WITH GAS FIREPLACE. KITCHEN HAS NICE SIZED PANTRY, AND IS OPEN TO A DINING ROOM. HAS COVERED FRONT PORCH AND BACK PORCH WITH A 2 CAR GARAGE. INCLUDES GE APPLIANCES(REFRIGERATOR NOT INCLUDED). ONE YEAR BUILDER WARRANTY AND A 2-10 BONDED BUILDER WARRANTY.
-
2016-04-05$152,000 423-char remark
Show marketing remark (423 chars)
ADAMS HOMES CRAFTSMAN 1668 PLAN IS 3 BEDROOMS AND 2 FULL BATHS. FEATURES A MASTER SUITE WITH TREY CEILINGS, AND A WALK IN CLOSET. DOUBLE RAISED VANITY. LARGE FAMILY ROOM WITH GAS FIREPLACE. KITCHEN HAS NICE SIZED PANTRY, AND IS OPEN TO A DINING ROOM. HAS COVERED FRONT PORCH AND BACK PORCH WITH A 2 CAR GARAGE. INCLUDES GE APPLIANCES(REFRIGERATOR NOT INCLUDED). ONE YEAR BUILDER WARRANTY AND A 2-10 BONDED BUILDER WARRANTY.
ⓘ Source: listings_history table (triggers on properties + properties_extension) + one-shot
backfill from property_details.listing_events for pre-trigger history.
Tax reassessment forecast MS · Resets to sale price
- Current annual tax
- $1,791 · $149/mo
- Projected year-2 tax
- $2,149 · $179/mo
- Expected delta
- +$358/yr (+$30/mo · 20.0%)
ⓘ Screening estimate from a state-policy table — verify with the county assessor before closing.
Climate risk First Street
- Flood 1/10 Low FEMA zone X (unshaded) · 0% chance over 30 yrs
- Wildfire 1/10 Low
- Heat 7/10 Severe 7 d/yr ≥109°F today · 21 d/yr by 30 yrs out
- Wind 4/10 Moderate 20% chance of damaging wind over 30 yrs
- Air quality 2/10 Low 2 unhealthy d/yr today · 2 by 30 yrs out
Nearby sold comps map
Loading sold comps map…
Walkable amenities ~0.75 mi
Loading nearby amenities…
Taxation est. · year 1
- Rental income
- $25,610
- − Mortgage interest
- −$15,267
- − Property taxes
- −$1,791
- − Insurance
- −$1,363
- − Repairs & maintenance
- −$2,049
- − Management
- −$2,049
- − Depreciation
- −$7,929
- Taxable loss
- −$4,838
- Est. tax savings @ 24.0%
- +$1,161
- After-tax cash flow
- $1,087/yr
For passive investors: Depreciation is non-cash, so a rental often shows a tax loss while cash-flowing — sheltering income. Rental losses are passive: they offset passive income freely, and up to $25,000/yr can offset ordinary (W-2) income if you actively participate and your MAGI is under $100k (phasing out to $0 by $150k); unused losses carry forward. On sale, claimed depreciation is recaptured at up to 25%, and gains may owe capital-gains tax (a 1031 exchange can defer both). Figures are a year-1 estimate at your 24.0% rate — not tax advice; consult a CPA.
Schools (NCES district)
- District
- Desoto County School District
- NCES district ID
- 2801320
- Math proficiency
- 48% ▼ -13.00%
- Reading proficiency
- 42% ▼ -6.00%
- Median HH income
- $59,272
- Composite
- 39.56/100
- National rank
- #3933
- State rank
- #20 of 130 in MS
Livability — Olive Branch
- Score
- 72/100
- State rank
- #29
- US rank
- #6509
Category grades
Schools grade is shown separately in the Schools card above.
Census & demographics
- Census place
- Olive Branch, MS
- County
- DeSoto County · 176,513 people
- City population
- 57,898
- Metro
- Memphis, TN-MS-AR
- Population (ZIP)
- 57,898
- Household income
- $103,092
- Rent vs Own
- Severe rent burden
- 801.0
Population outlook (DeSoto County) Hauer SSP2
- Today (2025)
- 203,338 people
- By 2030
- 217,692 · +7.1%
- By 2040
- 245,320 · +20.6%
- By 2050
- 270,133 · +32.8%
- By 2075
- 323,341 · +59.0%
- By 2100
- 348,742 · +71.5%
Race, ethnicity, and origin ACS 2023
- Neighborhood character
- Diverse neighborhood (Simpson 0.57)
- Race & ethnicity
- White 57% Black 32% Hispanic / Latino 5% Two or more races 5% Asian 2%
- Hispanic origin (detail)
- Mexican 4%
- Common ancestry
- Slovak 2% Lithuanian 1% Romanian 1%
- Foreign-born
- 4% · Canada, Vietnam, China
- Languages at home
- 93% English-only · Spanish 4% Vietnamese 1% Arabic 1%
Political lean MEDSL · DeSoto
- 2024 margin
- Strong R (+24.1) · D 36.7% · R 60.8% · Other 2.5%
- 2008→2024 swing
- +14.2pp toward D · 2008: -38.2pp · 2024: -24.1pp
- All cycles
- 2024: R+24.1 2020: R+23.9 2016: R+34.8 2012: R+33.5 2008: R+38.2
Not yet ingested
- Civics
- —
Market trends
- HPI YoY
- ▼ -66.27%
- Current HPI
- 187.2114
- Rent YoY
- ▼ -0.34%
- Metro
- Memphis, TN-MS-AR
- State GDP YoY
- —
- F500 in state
- 0
Price history
+78.9% since first listed6 events — show timeline
- 2026-06-04 Sold (Public Records) — Public Records
- 2026-06-04 Sold (MLS) — MLSU
- 2026-05-04 Pending — MLSU
- 2026-04-19 Listed $272,000 MLSU
- 2016-07-29 Sold (MLS) — MLSU
- 2016-04-05 Listed $152,000 MLSU
Property tax history
+20.5%/yrLatest (2025): $1,791 · +21.5% YoY. Source: county tax records.
Cash-flow waterfall
monthlySold comps — $/sqft
last 12 mo · ≤1 miLoading sold comps…