 Triplex
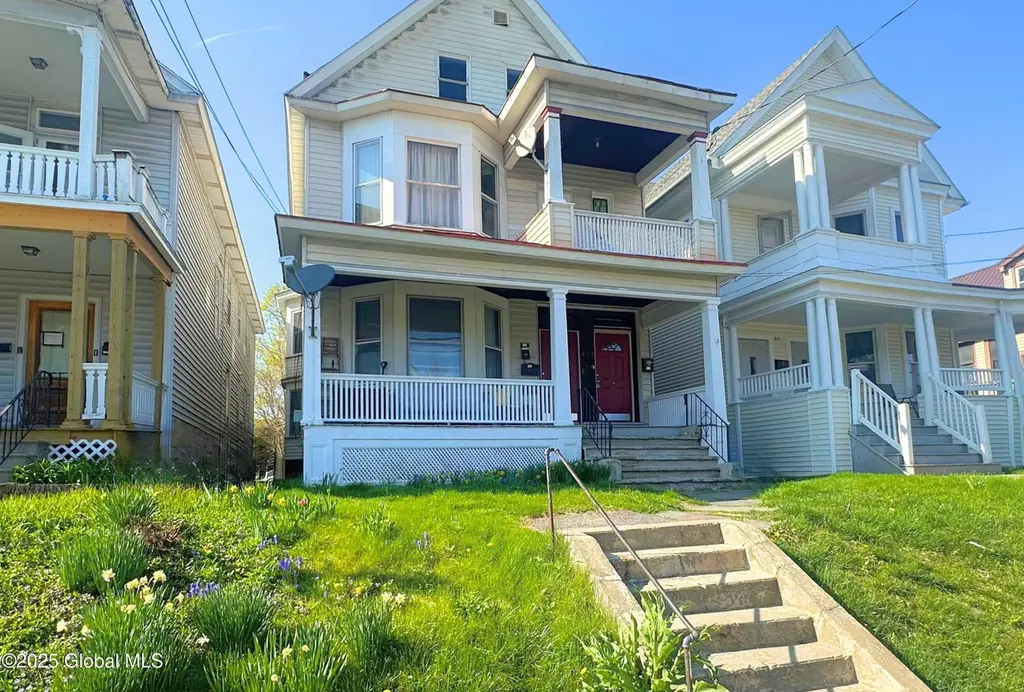
219 Delaware Ave · Albany, NY
Flood risk 1/10 · Minimal
- FEMA flood zone
- X (unshaded)
- Chance of flooding over 30 yrs
- 0.0%
- Est. flood insurance / yr
- $473 – $860
Fire risk 3/10 · Minor
- Est. fire insurance / yr
- $691 – $1,283
Heat risk 4/10 · Minor
- Hot days now (above 99°F)
- 7 days/yr
- Hot days in 30 yrs
- 16 days/yr
Wind risk 3/10 · Minor
- Chance of severe wind over 30 yrs
- 6.0%
Air-quality risk 1/10 · Minimal
- Unhealthy air days now
- 0 days/yr
- Unhealthy air days in 30 yrs
- 0 days/yr
Risk factors via First Street. Map © Google.
Why this score? — see what drove the B- grade
The composite is a weighted blend of 9 inputs, each scored 0–100. Each bar is that input's sub-score; the figure is the points it added to the 100-point composite (weight × sub-score).
- Cash flow +30.0/30.0
- DSCR +10.0/10.0
- 1% rule +9.5/10.0
- Livability +4.0/5.0
- Condition / age +3.8/5.0
- Schools +3.2/10.0
- Rent growth +2.5/5.0
- ARV discount +2.4/15.0
- Appreciation +0.0/10.0
$340,000
🖨 Deal sheet (PDF) 📄 Offer letter ✓ Due diligence
Multi-family units
County records classify this as Multi-Family (2-4 Unit). Listing-text estimate: 3 units. confirmed
Listing remarks
Turnkey Triplex in Albany's sought-after Delaware Avenue section, perfect for investors or owner-occupants seeking strong income potential. Generating $3,850/month, with room to increase rents. Offering a versatile unit mix of 3, 2, and 1 bedrooms, this property also features recent upgrades, front and rear porches, a large backyard, and a usable basement space. Prime location with easy access to dining, shopping, major employers, medical facilities, colleges, parks, the Madison Theatre, and public transportation. First Unit (front lower level ) is intentionally VACANT for owner-occupant homebuyer. LEGAL Non-Conforming Right to Use as a Dwelling- 3-Unit Detached. ALL OFFERS WILL BE REVIEWE
Key facts
- Recent upgrades
- Turnkey triplex
- Large backyard
Tags
Neighborhood map
What this means for you Summary
Snapshot
- This is a 3 × 2-bed/1.0-bath units multifamily listed at $340k. Condition is rated good.
Deal economics
- At list price, monthly cash flow is $2k ($19k/yr) — positive. Per door: $516/mo.
- The deal already cash-flows at list — no discount required.
- Meets the 1% rule at list price ($5k rent vs $340k).
- Cap rate 11.8% vs local median 5.7% in Albany — top-decile yield for the area; either an underpriced asset or a hidden risk that comps aren't pricing in. Stress-test before assuming the spread holds.
Location & tenants
- Location reads 79/100 on livability (#129 in NY, #2,083 nationally) — a middle-class / working-renter tenant base. Strengths: amenities A+, commute A+, housing A+; Watch: employment C-, crime F.
- Albany City School District (urban): math 37% / reading 40% proficiency, ranked #543 of 590 in NY (top 92%) — families likely to look elsewhere, expect single-tenant / working-renter base with shorter leases; 66% free/reduced lunch — lower-income household profile, screen leases tightly.
- Zoned schools: Albany High School (math 74% / reading 67%, grade B+, #710 of 1,100 statewide, top 65%, 2,676 students, 69% FRL) — zoned schools at 69% FRL track the district average.
- Zoned-school proficiency averages 70% at this address vs 38% district-wide (+32 pts) — the actual schools serving this property are materially stronger than the Albany City School District average implies; a family-tenant draw the district grade alone would hide.
- Market conditions: 47 active listings in the ZIP; 675 units permitted in Albany County in 2024 (451 in 5+ unit buildings).
Forward outlook
- Local home prices are declining (-3.0%/yr); year-one equity from $2k of loan paydown is wiped out by about $10k of value loss. Plan a longer hold.
- Albany County population projected at +9% by 2050 — modest demand growth; plan on rents tracking national, not racing it.
- At projected returns (-3.0% appreciation + 3.0% rent growth), your $95k cash investment doubles in ~7 years — after that, you're playing with house money.
Negotiation context
- Only 8 days on market — expect competitive offers; lowballing is unlikely to land.
- 2 sale attempts with the ask held roughly flat each time — persistent listings suggest the price (not the market) is what's stuck; bring a comps-based counter.
Risks & watch-outs
- Watch-outs: built in 1930 — expect roof / HVAC / electrical / plumbing capex.
Questions for the listing agent
- Can we see the unit-by-unit rent roll, current vacancy, and any below-market leases? What's the average tenancy length?
- What capital expenditures (roof, boiler, parking lot, exteriors) have been made in the last 5 years, and what's planned in the next 2?
- Built in 1930 — when were the roof, HVAC, electrical panel, plumbing, and water heater last replaced?
- Is there a deadline driving the sale (1031 exchange, divorce, estate, relocation)? That informs how much negotiation room exists.
- Crime grade is F in this area — have there been break-ins, vandalism, or insurance claims at this property in the last 3 years? What carrier currently insures it and at what premium?
- What's the average days-on-market for RENTAL listings here right now (not sales)? A rising rental-DOM trend means longer vacancies and softer asking-rent achievability than the comps imply.
- What's the recent tenant-quality profile in this submarket — average credit score on applications, eviction rate, late-payment / NSF rate, and stable-employment percentage? A property-management company in the area should have these aggregated.
- How much new apartment / multifamily construction is in the pipeline within 1–3 miles? Heavy new supply (>2% of stock underway) typically softens rents 12–24 months out; light construction supports rent growth.
Investment metrics
- 1% rule
- 1.45% ✓
- Cap rate
- 11.75%
- Cash-on-cash
- 19.50%
- DSCR
- 1.87
- GRM
- 5.7
CMA / ARV
- ARV (on-the-fly)
- $305,536
- Comps found
- 12
Show comp detail 12 sales within ~0.75 mi
| Address | Dist | Beds/Ba | Sqft | Sold | Price | $/sf | Match |
|---|---|---|---|---|---|---|---|
| 278 Morton Ave | 0.15mi | 6/2.5 | 2,460 (-0%) | 5mo | $195,000 | $79 | 87 |
| 41 Barrows St | 0.66mi | 6/2.0 | 2,472 (+0%) | 2mo | $290,000 | $117 | 63 |
| 252 Morton Ave | 0.21mi | 6/4.0 | 2,152 (-13%) | 3mo | $285,000 | $132 | 62 |
| 23 Sloan St | 0.60mi | 6/3.0 | 2,310 (-6%) | 1mo | $170,000 | $74 | 60 |
| 62 Summit Ave | 0.45mi | 6/2.5 | 2,658 (+8%) | 6mo | $330,000 | $124 | 59 |
| 14 Bogart Ter | 0.46mi | 6/2.0 | 2,232 (-9%) | 2mo | $250,000 | $112 | 58 |
| 79 Alexander St | 0.65mi | 6/4.0 | 2,600 (+6%) | 0mo | $215,000 | $83 | 56 |
| 105 Southern Blvd | 0.71mi | 5/4.0 (-1) | 2,446 (-1%) | 1mo | $405,000 | $166 | 56 |
| 50 Southern Blvd | 0.74mi | 6/2.0 | 2,380 (-3%) | 2mo | $347,000 | $146 | 54 |
| 10 Putnam St | 0.50mi | 6/2.0 | 2,764 (+12%) | 4mo | $375,000 | $136 | 49 |
| 58 Southern Blvd | 0.75mi | 6/2.0 | 2,264 (-8%) | 4mo | $350,000 | $155 | 44 |
| 24 Delaware St | 0.73mi | 5/2.5 (-1) | 2,112 (-14%) | 2mo | $240,000 | $114 | 33 |
Match score weights: distance 35% · size 25% · config 20% · recency 20%. Top-matched comps best support the ARV.
Projected returns pro-forma
-3.0% appreciation · 3.0% rent growth · sell at horizon
- IRR
- 11.5%
- Equity multiple
- 1.46×
- Total profit
- $43,485
- Equity at exit
- $50,695
- IRR
- 20.5%
- Equity multiple
- 2.73×
- Total profit
- $165,009
- Equity at exit
- $29,397
Cash invested: $95,200 (down + closing). Projections, not guarantees.
Landlord ↔ Tenant lean methodology
- Overall (STATE)
- 15 Strongly Tenant-Friendly
- State New York
- 15 Strongly Tenant-Friendly · D+10
- County
- — inherits STATE
- City
- — inherits STATE
ZIP-level market 12209
- Home prices YoY
- -7.3%
- Active inventory
- 47
- Price-to-rent
- 17.2×
Monthly cashflow live
- Estimated rent
- $4,932 high interval (Pro) →
- Mortgage (P&I)
- −$1,783
- Tax est. 1.5%
- −$425 /mo · $5,100/yr
- Insurance
- −$142
- HOA
- −$0
- Vacancy / Maint / Mgmt
- −$1,036
- Net cashflow
- $1,547
Break-even live
Sensitivity live
| Price | -10% $1,782 | -5% $1,664 | +0% $1,547 | +5% $1,429 | +10% $1,312 |
|---|---|---|---|---|---|
| Rent | -10% $1,157 | -5% $1,352 | +0% $1,547 | +5% $1,741 | +10% $1,936 |
| Rate | -1.0pp $1,718 | -0.5pp $1,633 | base $1,547 | +0.5pp $1,459 | +1.0pp $1,369 |
3-unit breakdown (identical units grouped — click to expand)
| Units | Beds | Baths | Est. rent |
|---|---|---|---|
| 3× units | 2 | 1 | $4,932 |
| #1 | 2 | 1 | $1,644 |
| #2 | 2 | 1 | $1,644 |
| #3 | 2 | 1 | $1,644 |
| Total (3 units) | $4,932 | ||
UW: 25.0% down · 7.5% · 30yr · 1.5% tax · 5.0% vac · 8.0% maint · 8.0% mgmt
Financing live
Cash to close
- Down payment
- $85,000
- Closing costs
- $10,200
- Reserves months
- —
- Total cash needed
- —
Loan-product check · same deal, 3 products live
Conventional
25% down · 7.5% · 30yr
- Down + closing
- —
- Monthly P&I
- —
- Monthly cashflow
- —
- DSCR
- —
- Eligible?
- —
Personal DTI + credit; lowest rate.
DSCR
20% down · 8.5% · 30yr
- Down + closing
- —
- Monthly P&I
- —
- Monthly cashflow
- —
- DSCR
- —
- Eligible?
- —
No personal income docs; deal must DSCR.
Hard money
10% down · 12.0% · 12mo
- Down + closing
- —
- Monthly P&I
- —
- Monthly cashflow
- —
- DSCR
- —
- Eligible?
- —
Short-term bridge; refi at stabilization.
Listing history 2 events
-
2026-06-16remarks 699-char remark
-
2026-06-16$340,000 Pending 8 DOM
ⓘ Source: listings_history table (triggers on properties + properties_extension) + one-shot
backfill from property_details.listing_events for pre-trigger history.
Climate risk First Street
- Flood 1/10 Low FEMA zone X (unshaded) · 0% chance over 30 yrs
- Wildfire 3/10 Moderate
- Heat 4/10 Moderate 7 d/yr ≥99°F today · 16 d/yr by 30 yrs out
- Wind 3/10 Moderate 6% chance of damaging wind over 30 yrs
- Air quality 1/10 Low 0 unhealthy d/yr today · 0 by 30 yrs out
Nearby sold comps map
Loading sold comps map…
Walkable amenities ~0.75 mi
Loading nearby amenities…
Taxation est. · year 1
- Rental income
- $59,184
- − Mortgage interest
- −$19,045
- − Property taxes
- −$5,100
- − Insurance
- −$1,700
- − Repairs & maintenance
- −$4,735
- − Management
- −$4,735
- − Depreciation
- −$9,891
- Taxable income
- $13,978
- Est. tax owed @ 24.0%
- −$3,355
- After-tax cash flow
- $15,205/yr
For passive investors: Depreciation is non-cash, so a rental often shows a tax loss while cash-flowing — sheltering income. Rental losses are passive: they offset passive income freely, and up to $25,000/yr can offset ordinary (W-2) income if you actively participate and your MAGI is under $100k (phasing out to $0 by $150k); unused losses carry forward. On sale, claimed depreciation is recaptured at up to 25%, and gains may owe capital-gains tax (a 1031 exchange can defer both). Figures are a year-1 estimate at your 24.0% rate — not tax advice; consult a CPA.
Condition & rehab AI · 13 photos
This turnkey triplex in Albany's sought-after Delaware Avenue section is in good condition with recent upgrades and a prime location. It's ready for immediate occupancy and can be further enhanced with exterior painting and gutter cleaning.
Value-add opportunities
- Both Paint the exterior — Painting the exterior can enhance the curb appeal and increase the property's value.
- Both Clean the gutters — Clean gutters improve the property's appearance and prevent water damage to the siding and foundation.
Renovation cost estimate screening
Value-add ROI direction
- Both Paint the exterior — Painting the exterior can enhance the curb appeal and increase the property's value. ↑
- Both Clean the gutters — Clean gutters improve the property's appearance and prevent water damage to the siding and foundation. ↑
ⓘ Cost ranges are severity-bucket heuristics (US national rule-of-thumb). Get contractor quotes + a written scope before underwriting a rehab budget.
Schools (NCES district)
- District
- Albany City School District
- NCES district ID
- 3602460
- Math proficiency
- 37% ▲ 6.00%
- Reading proficiency
- 40% ▲ 7.00%
- Median HH income
- $40,568
- Composite
- 32.34/100
- National rank
- #5744
- State rank
- #543 of 590 in NY
Livability — Albany
- Score
- 79/100
- State rank
- #129
- US rank
- #2083
Category grades
Schools grade is shown separately in the Schools card above.
Census & demographics
- Census place
- Albany, NY
- City population
- 116,921
- Population (ZIP)
- 10,754
Population outlook (Albany County) Hauer SSP2
- Today (2025)
- 320,794 people
- By 2030
- 327,401 · +2.1%
- By 2040
- 338,218 · +5.4%
- By 2050
- 348,467 · +8.6%
- By 2075
- 381,693 · +19.0%
- By 2100
- 393,809 · +22.8%
Race, ethnicity, and origin ACS 2023
- Neighborhood character
- Diverse neighborhood (Simpson 0.69)
- Race & ethnicity
- White 46% Black 23% Hispanic / Latino 19% Asian 8% Two or more races 7%
- Hispanic origin (detail)
- Puerto Rican 6%
- Common ancestry
- Romanian 4% Lithuanian 3% Serbian 1%
- Foreign-born
- 18% · Canada, Philippines, South Korea
- Languages at home
- 77% English-only · Spanish 13% Other Asian/Pacific 3% Tagalog/Filipino 1%
Political lean MEDSL · Albany
- 2024 margin
- Strong D (+25.8) · D 62.9% · R 37.1%
- 2008→2024 swing
- -3.6pp toward R · 2008: 29.4pp · 2024: 25.8pp
- All cycles
- 2024: D+25.8 2020: D+31.4 2016: D+24.3 2012: D+31.0 2008: D+29.4
Not yet ingested
- Civics
- —
Market trends
- HPI YoY
- ▼ -24.91%
- Current HPI
- 318.0191
- Rent YoY
- —
- Metro
- —
- State GDP YoY
- ▲ 2.60%
- F500 in state
- 92
Industry mix (Fortune 500 HQ in NY)
| Industry | F500 HQs | Revenue |
|---|---|---|
| Financial Services | 10 | $950B |
|
||
| Consumer Goods | 9 | $162B |
|
||
| Insurance | 4 | $225B |
|
||
| Telecommunications | 2 | $144B |
|
||
| Pharmaceuticals | 2 | $112B |
|
||
| Media / Entertainment | 2 | $69B |
|
||
Price history
-2.9% since first listed4 events — show timeline
- 2026-04-22 Pending — Global MLS
- 2026-04-11 Listed $340,000 Global MLS
- 2025-06-29 Listing Removed — Global MLS
- 2025-04-26 Listed $350,000 Global MLS
Cash-flow waterfall
monthlySold comps — $/sqft
last 12 mo · ≤1 miLoading sold comps…